
How Important is Customer Lifetime Value?
This is the third article of article series Getting started with the top eCommerce use cases. If you are interested in reading the first article you can find it here.
Customer Lifetime Value
Many researches have shown that cost for acquiring a new customer is higher than the cost of retention of an existing customer which makes Customer Lifetime Value (CLV or LTV) one of the most important KPI’s. Marketing is about building a relationship with your customer and quality service matters a lot when it comes to customer retention. CLV is a metric which determines the total amount of money a customer is expected to spend in your business.
CLV allows marketing department of the company to understand how much money a customer is going to spend over their life cycle which helps them to determine on how much the company should spend to acquire each customer. Using CLV a company can better understand their customer and come up with different strategies either to retain their existing customers by sending them personalized email, discount voucher, provide them with better customer service etc. This will help a company to narrow their focus on acquiring similar customers by applying customer segmentation or look alike modeling.
One of the main focus of every company is Growth in this competitive eCommerce market today and price is not the only factor when a customer makes a decision. CLV is a metric which revolves around a customer and helps to retain valuable customers, increase revenue from less valuable customers and improve overall customer experience. Don’t look at CLV as just one metric but the journey to calculate this metric involves answering some really important questions which can be crucial for the business. Metrics and questions like:
- Number of sales
- Average number of times a customer buys
- Full Customer journey
- How many marketing channels were involved in one purchase?
- When the purchase was made?
- Customer retention rate
- Marketing cost
- Cost of acquiring a new customer
and so on are somehow associated with the calculation of CLV and exploring these questions can be quite insightful. Lately, a lot of companies have started to use this metric and shift their focuses in order to make more profit. Amazon is the perfect example for this, in 2013, a study by Consumers Intelligence Research Partners found out that prime members spends more than a non-prime member. So Amazon started focusing on Prime members to increase their profit over the past few years. The whole article can be found here.
How to calculate CLV?
There are several methods to calculate CLV and few of them are listed below.
Method 1: By calculating average revenue per customer
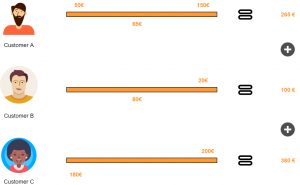
Figure 1: Using average revenue per customer
Let’s suppose three customers brought 745€ as profit to a company over a period of 2 months then:
CLV (2 months) = Total Profit over a period of time / Number of Customers over a period of time
CLV (2 months) = 745 / 3 = 248 €
Now the company can use this to calculate CLV for an year however, this is a naive approach and works only if the preferences of the customer are same for the same period of time. So let’s explore other approaches.
Method 2
This method requires to first calculate KPI’s like retention rate and discount rate.
CLV = Gross margin per lifespan ( Retention rate per month / 1 + Discount rate – Retention rate per month)
Where
Retention rate = Customer at the end of the month – Customer during the month / Customer at the beginning of the month ) * 100
Method 3
This method will allow us to look at other metrics also and can be calculated in following steps:
- Calculate average number of transactions per month (T)
- Calculate average order value (OV)
- Calculate average gross margin (GM)
- Calculate customer lifespan in months (ALS)
After calculating these metrics CLV can be calculated as:
CLV = T*OV*GM*ALS / No. of Clients for the period
where
Transactions (T) = Total transactions / Period
Average order value (OV) = Total revenue / Total orders
Gross margin (GM) = (Total revenue – Cost of sales/ Total revenue) * 100 [but how you calculate cost of sales is debatable]
Customer lifespan in months (ALS) = 1 / Churn Rate %
CLV can be calculated using any of the above mentioned methods depending upon how robust your company wants the analysis to be. Some companies are also using Machine learning models to predict CLV, maybe not directly but they use ML models to predict customer churn rate, retention rate and other marketing KPI’s. Some companies take advantage of all the methods by taking an average at the end.
 Read this article in German: