
Looking Ahead: The Future of Data Preparation for Generative AI
Sponsored Post
Generative AI is a significant part of the technology landscape. The effectiveness of generative AI is linked to the data it uses. Similar to how a chef needs fresh ingredients to prepare a meal, generative AI needs well-prepared, clean data to produce outputs. Businesses need to understand the trends in data preparation to adapt and succeed.
The Principle of “Garbage In, Garbage Out”
The principle of “garbage in, garbage out” (GIGO) remains as relevant as ever. If you input poor-quality data into an AI system, the results will be poor. This principle highlights the need for careful data preparation, ensuring that the input data is accurate, consistent, and relevant.
Emerging Trends in Data Preparation
- Automated Data Cleaning
Manual data cleaning is both time-consuming and error-prone. Emerging tools now leverage AI to automate this process, identifying and correcting errors more efficiently. This shift not only saves time but also ensures a higher standard of data quality. Tools like BiG EVAL are leading data quality field for all technical systems in which data is transported and transformed. BiG EVAL utilizes plausibility and validation mechanisms to adopt proactive quality assurance and enable short release cycles in agile projects as well.
- Real-Time Data Processing
Businesses are adopting technologies that can process and analyze data instantly due to the need for real-time insights. Real-time data preparation tools allow companies to react quickly to new information, maintaining a competitive edge in fast-paced industries.
- Improved Data Integration
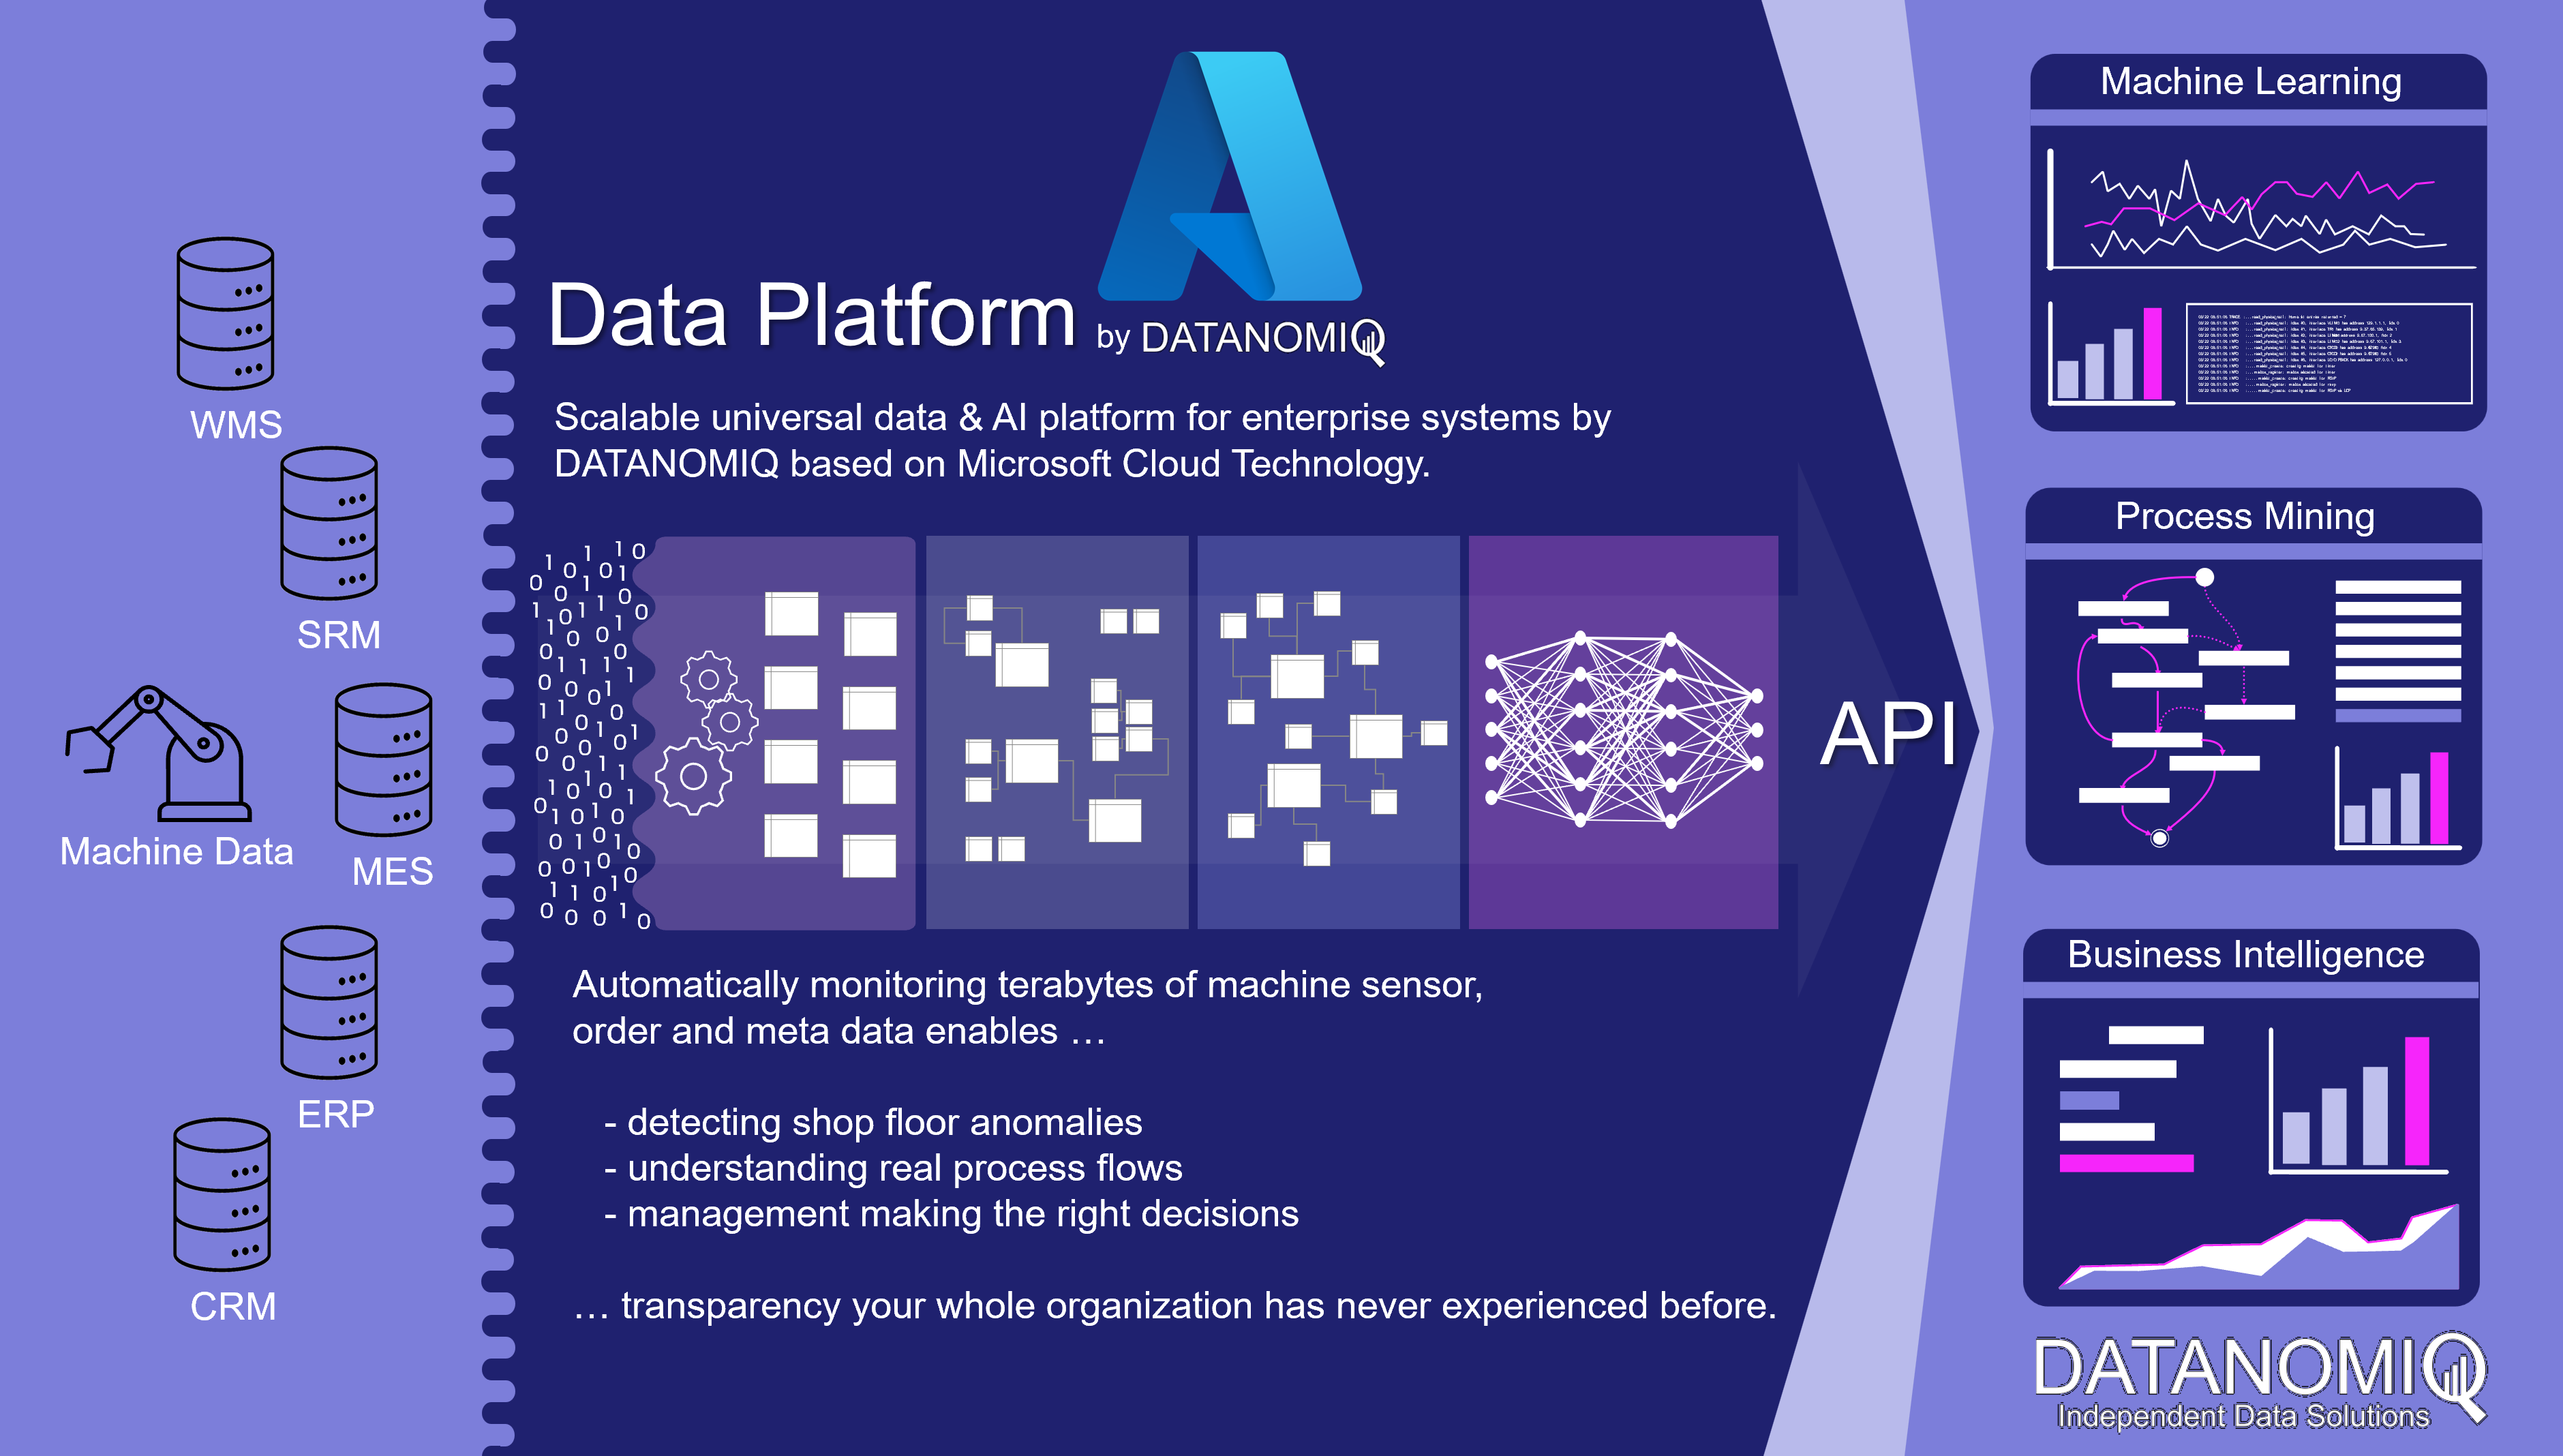
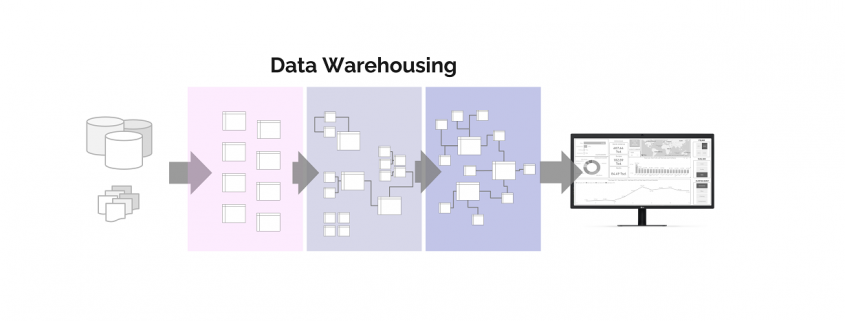
Data often comes from various sources, and integrating this data smoothly is essential. Advanced data integration tools now facilitate the merging of different data sets, creating a cohesive and comprehensive dataset for analysis. Managing a vast array of data sources is almost incomprehensible with data automation tools.
- Augmented Data Catalogs
Modern data catalogs are becoming more intuitive and intelligent. They not only help in organizing and finding data but also in understanding its lineage and context. This contextual awareness aids in better data preparation and utilization.
Adapting to These Changes
Businesses must be proactive in adopting these emerging trends. Here are a few strategies to consider:
- Invest in Advanced Data Tools
Investing in modern data preparation tools can enhance data processing capabilities. Solutions like AnalyticsCreator provide robust platforms for real-time processing and seamless integration.
- Foster a Data-Driven Culture
Promote a culture where data quality is a shared responsibility. Encourage teams to prioritize data accuracy and consistency at every stage of data handling.
- Continuous Training and Development
The field of data science is constantly evolving. Ensure your team is up-to-date with the latest trends and technologies in data preparation through continuous learning and development programs.
- Leverage Expert Guidance
Sometimes, navigating the complex landscape of data preparation requires expert guidance. Partnering with specialists can provide valuable insights and help in implementing best practices tailored to your business needs. (Link to our partner page).
The Role of AnalyticsCreator
AnalyticsCreator helps businesses navigate the future of data preparation. By providing advanced tools and solutions, AnalyticsCreator ensures that your data is prepared, well-integrated, and ready for analysis. Its platform is designed to handle the complexities of modern data environments, offering features that align with the latest trends in data preparation.
In conclusion, as generative AI continues to influence industries, the need for high-quality data is important. By staying informed of emerging trends and leveraging tools like AnalyticsCreator, businesses can ensure they are prepared to harness the full potential of generative AI. Just as a chef’s masterpiece depends on the quality of the ingredients, your AI outcomes will depend on the data you prepare. Investing in your data can only lead to positive results.


 David M. Raab is as a consultant specialized in marketing software and service vendor selection, marketing analytics and marketing technology assessment. Furthermore he is the founder of the Customer Data Platform Institute which is a vendor-neutral educational project to help marketers build a unified customer view that is available to all of their company systems.
 Read this article in German: