5 Apache Spark Best Practices

Already familiar with the term big data, right? Despite the fact that we would all discuss Big Data, it takes a very long time before you confront it in your career. Apache Spark is a Big Data tool that aims to handle large datasets in a parallel and distributed manner. Apache Spark began as a research project at UC Berkeley’s AMPLab, a student, researcher, and faculty collaboration centered on data-intensive application domains, in 2009. 

Introduction

Spark’s aim is to create a new framework that was optimized for quick iterative processing, such as machine learning and interactive data analysis while retaining Hadoop MapReduce’s scalability and fault-tolerant. Spark outperforms Hadoop in many ways, reaching performance levels that are nearly 100 times higher in some cases. Spark has a number of components for various types of processing, all of which are based on Spark Core. Today we will be going to discuss in brief the Apache  Spark and 5 of its best practices to look forward to-

What is Apache Spark?

Apache Spark is an open-source distributed system for big data workforces. For fast analytic queries against another size of data, it uses in-memory caching and optimised query execution. It is a parallel processing framework for grouped computers to operate large-scale data analytics applications. This could handle packet and real-time data processing and predictive analysis workloads.

It claims to support code reuse all over multiple workloads—batch processing, interactive queries, real-time analytics, machine learning, and graph processing—and offers development APIs in Java, Scala, Python, and R. With 365,000 meetup members in 2017, Apache Spark is becoming one of the most renowned big data distributed processing frameworks. Explore for Apache Spark Tutorial for more information.

5 best practices of Apache Spark

1. Begin with a small sample of the data.

Because we want to make big data work, we need to start with a small sample of data to see if we’re on the right track. In my project, I sampled 10% of the data and verified that the pipelines were working properly. This allowed me to use the SQL section of the Spark UI to watch the numbers grow throughout the flow while not having to wait too long for it to complete.

In my experience, if you attain your preferred runtime with a small sample, scaling up is usually simple.

2. Spark troubleshooting

For transformations, Spark seems to have a lazy loading behaviour. That is, it will not initiate the transformation computation; instead, it will keep records of the transformation requested. This makes it difficult to determine where in our code there are bugs or areas that need to be optimised. Splitting the code into sections with df.cache() and then using df.count() to force Spark to calculate the df at every section was one practise that we found useful.

Spark actions seem to be keen in that they cause the underlying action to perform a computation. So, if you’ve had a Spark action which you only call when it’s required, pay attention. A Spark action, for instance, is count() on a dataset. You can now inspect the computation of each section using the spark UI and identify any issues. It’s important to note that if you don’t use the sampling we mentioned in (1), you’ll probably end up with a very long runtime that’s difficult to debug.

Check out Apache Spark Training & Certification Course to get yourself certified in Apache Spark with industry-level skills.

3. Finding and resolving Skewness is a difficult task.

Having to look at the stage specifics in the spark UI and looking for just a major difference between both the max and median can help you find the Skewness:

Let’s begin with a definition of Skewness. As previously stated, our data is divided into partitions, and the size of each partition will most likely change as the progress of transformation. This can result in a large difference in size between partitions, indicating that our data is skew. This implies that a few of the tasks were markedly slower than the rest.

Why is this even a bad thing? Because it may cause other stages to stand in line for these few tasks, leaving cores idle. If you understand where all the Skewness has been coming from, you can fix it right away by changing the partitioning.

4. Appropriately cache

Spark allows you to cache datasets in memory. There are a variety of options to choose from:

  • Since the same operation has been computed several times in the pipeline flow, cache it.
  • To allow the required cache setting, use the persist API to enable caching (persist to disc or not; serialized or not).
  • Be cognizant of lazy loading and, if necessary, prime cache up front. Some APIs are eager, while others aren’t.
  • To see information about the datasets you’ve cached, go to the Storage tab in the Spark UI.
  • It’s a good idea to unpersist your cached datasets after you’ve finished using them to free up resources, especially if other people are using the cluster.

5. Spark has issues with iterative code.

It was particularly difficult. Spark uses lazy evaluation so that when the code is run, it only creates a computational graph, a DAG. Once you have an iterative process, however, this method can be very problematic so because DAG finally opens the prior iteration and then becomes extremely large, we mean extremely large. This may be too large for the driver to remember. Because the application is stuck, this makes it appear in the spark UI as if no jobs are running (which is correct) for an extended period of time — until the driver crashes.

This seems to be presently an obvious issue with Spark, and the workaround that worked for me was to use df.checkpoint() / df.reset() / df.reset() / df.reset() / df.reset() / df. every 5–6 iterations, call localCheckpoint() (find your number by experimenting a bit). This works because, unlike cache(), checkpoint() breaks the lineage and the DAG, saves the results and starts from a new checkpoint. The disadvantage is that you don’t have the entire DAG to recreate the df if something goes wrong.

Conclusion

Spark is now one of the most popular projects inside the Hadoop ecosystem, with many companies using it in conjunction with Hadoop to process large amounts of data. In June 2013, Spark was acknowledged into the Apache Software Foundation’s (ASF) entrepreneurial context, and in February 2014, it was designated as an Apache Top-Level Project. Spark could indeed run by itself, on Apache Mesos, or on Apache Hadoop, which is the most common. Spark is used by large enterprises working with big data applications because of its speed and ability to connect multiple types of databases and run various types of analytics applications.

Learning how to make Spark work its magic takes time, but these 5 practices will help you move your project forward and sprinkle some spark charm on your code.

process.science presents a new release

Advertisement

Process Mining Tool provider process.science presents a new release

process.science, specialist in the development of process mining plugins for BI systems, presents its upgraded version of their product ps4pbi. Process.science has added the following improvements to their plug-in for Microsoft Power BI. Identcal upgrades will soon also be released for ps4qlk, the corresponding plug-in for Qlik Sense:

  • 3x faster performance: By improvement of the graph library the graph built got approx. 300% more performant. This is particularly noticeable in complex processes
  • Navigator window: For a better overview in complex graphs, an overview window has been added, in which the entire graph and the respective position of the viewed area within the overall process is displayed
  • Activities legend: This allows activities to be assigned to specific categories and highlighted in different colors, for example in which source system an activity was carried out
  • Activity drill-through: This makes it possible to take filters that have been set for selected activities into other dashboards
  • Value Color Scale: Activity values ​​can be color-coded and assigned to freely selectable groupings, which makes the overview easier at first sight
process.science Process Mining on Power BI

process.science Process Mining on Power BI

Process mining is a business data analysis technique. The software used for this extracts the data that is already available in the source systems and visualizes them in a process graph. The aim is to ensure continuous monitoring in real time in order to identify optimization measures for processes, to simulate them and to continuously evaluate them after implementation.

The process mining tools from process.science are integrated directly into Microsoft Power BI and Qlik Sense. A corresponding plug-in for Tableau is already in development. So it is not a complicated isolated solution requires a new set up in addition to existing systems. With process.science the existing know-how on the BI system already implemented and the existing infrastructure framework can be adapted.

The integration of process.science in the BI systems has no influence on day-to-day business and bears absolutely no risk of system failures, as process.science does not intervene in the the source system or any other program but extends the respective business intelligence tool by the process perspective including various functionalities.

Contact person for inquiries:

process.science GmbH & Co. KG
Gordon Arnemann
Tel .: + 49 (231) 5869 2868
Email: ga@process.science
https://de.process.science/

How to make a toy English-German translator with multi-head attention heat maps: the overall architecture of Transformer

If you have been patient enough to read the former articles of this article series Instructions on Transformer for people outside NLP field, but with examples of NLP, you should have already learned a great deal of Transformer model, and I hope you gained a solid foundation of learning theoretical sides on this algorithm.

This article is going to focus more on practical implementation of a transformer model. We use codes in the Tensorflow official tutorial. They are maintained well by Google, and I think it is the best practice to use widely known codes.

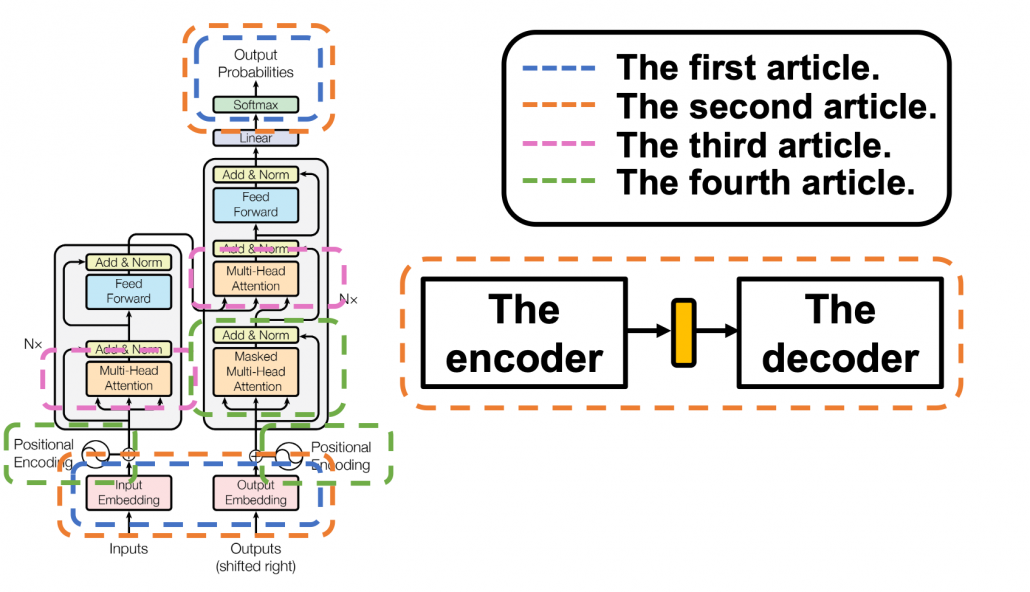
The figure below shows what I have explained in the articles so far. Depending on your level of understanding, you can go back to my former articles. If you are familiar with NLP with deep learning, you can start with the third article.

1 The datasets

I think this article series appears to be on NLP, and I do believe that learning Transformer through NLP examples is very effective. But I cannot delve into effective techniques of processing corpus in each language. Thus we are going to use a library named BPEmb. This library enables you to encode any sentences in various languages into lists of integers. And conversely you can decode lists of integers to the language. Thanks to this library, we do not have to do simplification of alphabets, such as getting rid of Umlaut.

*Actually, I am studying in computer vision field, so my codes would look elementary to those in NLP fields.

The official Tensorflow tutorial makes a Portuguese-English translator, but in article we are going to make an English-German translator. Basically, only the codes below are my original. As I said, this is not an article on NLP, so all you have to know is that at every iteration you get a batch of (64, 41) sized tensor as the source sentences, and a batch of (64, 42) tensor as corresponding target sentences. 41, 42 are respectively the maximum lengths of the input or target sentences, and when input sentences are shorter than them, the rest positions are zero padded, as you can see in the codes below.

*If you just replace datasets and modules for encoding, you can make translators of other pairs of languages.

We are going to train a seq2seq-like Transformer model of converting those list of integers, thus a mapping from a vector to another vector. But each word, or integer is encoded as an embedding vector, so virtually the Transformer model is going to learn a mapping from sequence data to another sequence data. Let’s formulate this into a bit more mathematics-like way: when we get a pair of sequence data \boldsymbol{X} = (\boldsymbol{x}^{(1)}, \dots, \boldsymbol{x}^{(\tau _x)}) and \boldsymbol{Y} = (\boldsymbol{y}^{(1)}, \dots, \boldsymbol{y}^{(\tau _y)}), where \boldsymbol{x}^{(t)} \in \mathbb{R}^{|\mathcal{V}_{\mathcal{X}}|}, \boldsymbol{x}^{(t)} \in \mathbb{R}^{|\mathcal{V}_{\mathcal{Y}}|}, respectively from English and German corpus, then we learn a mapping f: \boldsymbol{X} \to \boldsymbol{Y}.

*In this implementation the vocabulary sizes are both 10002. Thus |\mathcal{V}_{\mathcal{X}}|=|\mathcal{V}_{\mathcal{Y}}|=10002

2 The whole architecture

This article series has covered most of components of Transformer model, but you might not understand how seq2seq-like models can be constructed with them. It is very effective to understand how transformer is constructed by actually reading or writing codes, and in this article we are finally going to construct the whole architecture of a Transforme translator, following the Tensorflow official tutorial. At the end of this article, you would be able to make a toy English-German translator.

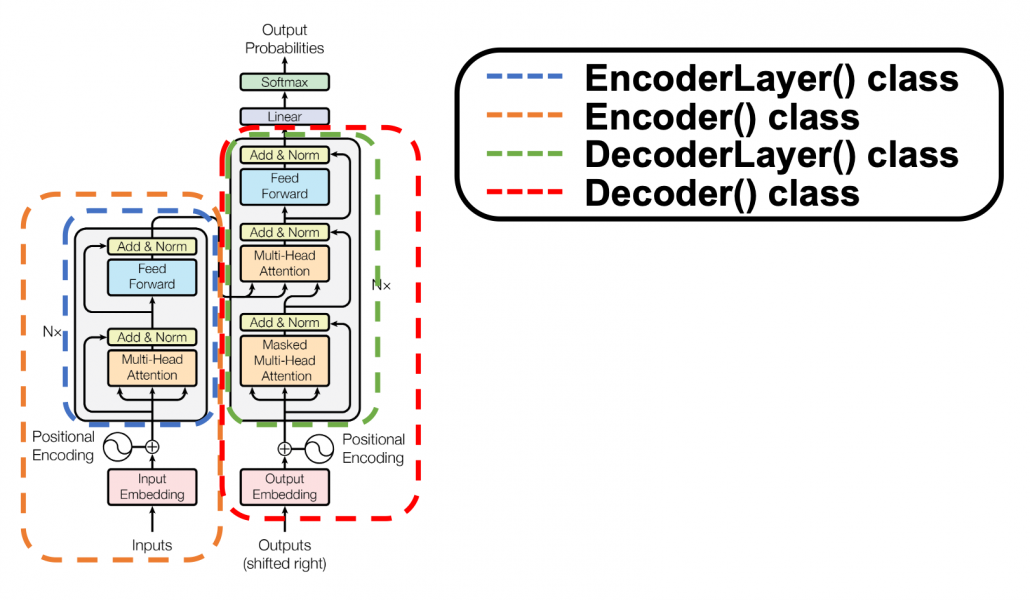
The implementation is mainly composed of 4 classes, EncoderLayer(), Encoder(), DecoderLayer(), and Decoder() class. The inclusion relations of the classes are displayed in the figure below.

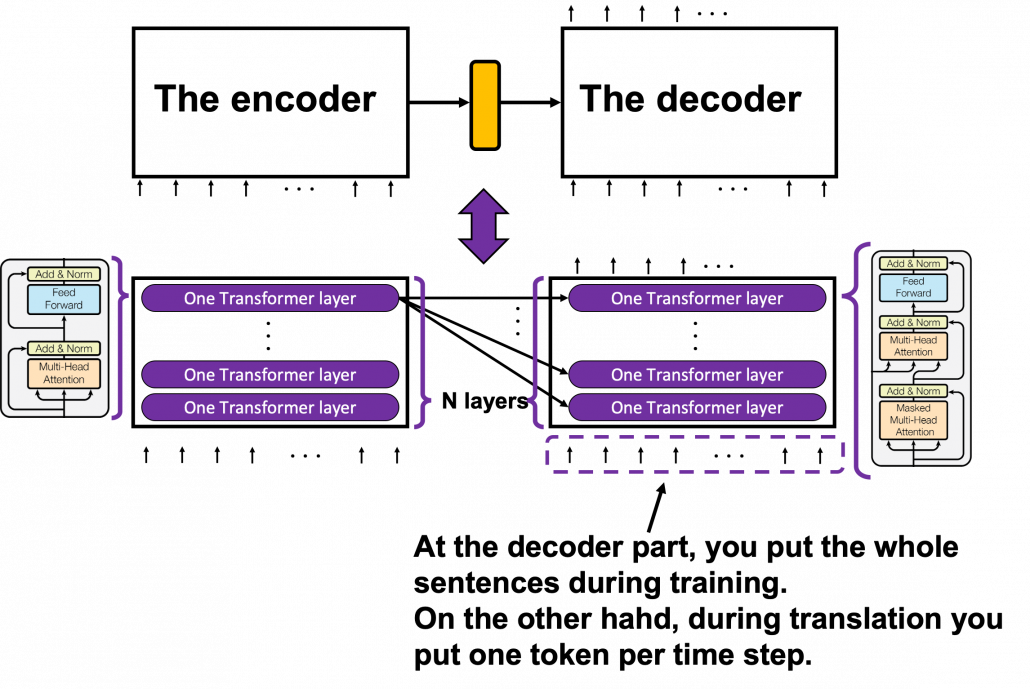
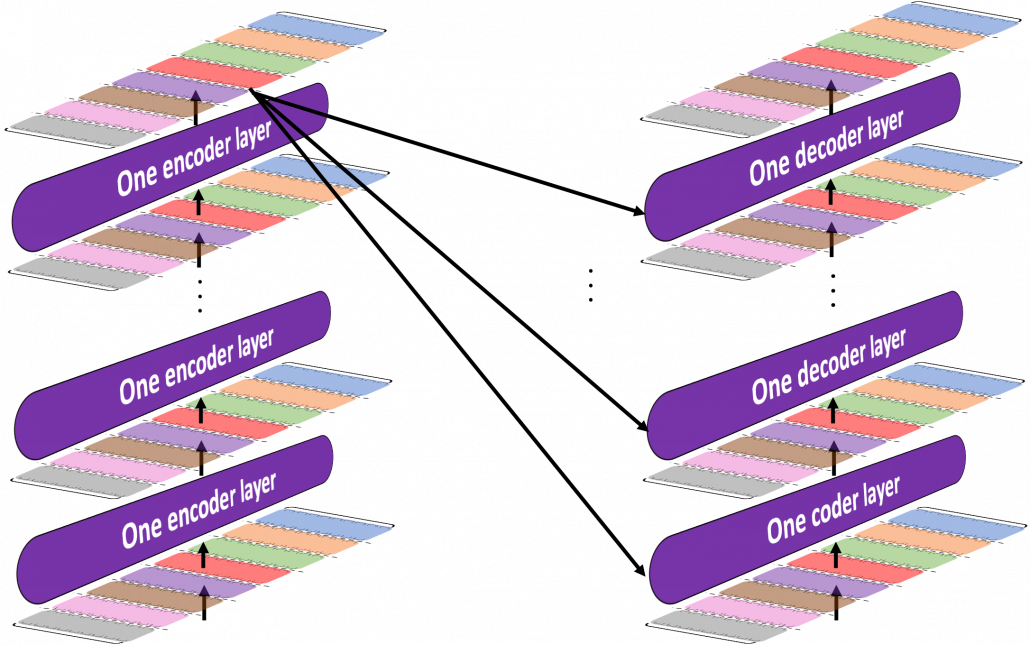
To be more exact in a seq2seq-like model with Transformer, the encoder and the decoder are connected like in the figure below. The encoder part keeps converting input sentences in the original language through N layers. The decoder part also keeps converting the inputs in the target languages, also through N layers, but it receives the output of the final layer of the Encoder at every layer.

You can see how the Encoder() class and the Decoder() class are combined in Transformer in the codes below. If you have used Tensorflow or Pytorch to some extent, the codes below should not be that hard to read.

3 The encoder

*From now on “sentences” do not mean only the input tokens in natural language, but also the reweighted and concatenated “values,” which I repeatedly explained in explained in the former articles. By the end of this section, you will see that Transformer repeatedly converts sentences layer by layer, remaining the shape of the original sentence.

I have explained multi-head attention mechanism in the third article, precisely, and I explained positional encoding and masked multi-head attention in the last article. Thus if you have read them and have ever written some codes in Tensorflow or Pytorch, I think the codes of Transformer in the official Tensorflow tutorial is not so hard to read. What is more, you do not use CNNs or RNNs in this implementation. Basically all you need is linear transformations. First of all let’s see how the EncoderLayer() and the Encoder() classes are implemented in the codes below.

You might be confused what “Feed Forward” means in  this article or the original paper on Transformer. The original paper says this layer is calculated as FFN(x) = max(0, xW_1 + b_1)W_2 +b_2. In short you stack two fully connected layers and activate it with a ReLU function. Let’s see how point_wise_feed_forward_network() function works in the implementation with some simple codes. As you can see from the number of parameters in each layer of the position wise feed forward neural network, the network does not depend on the length of the sentences.

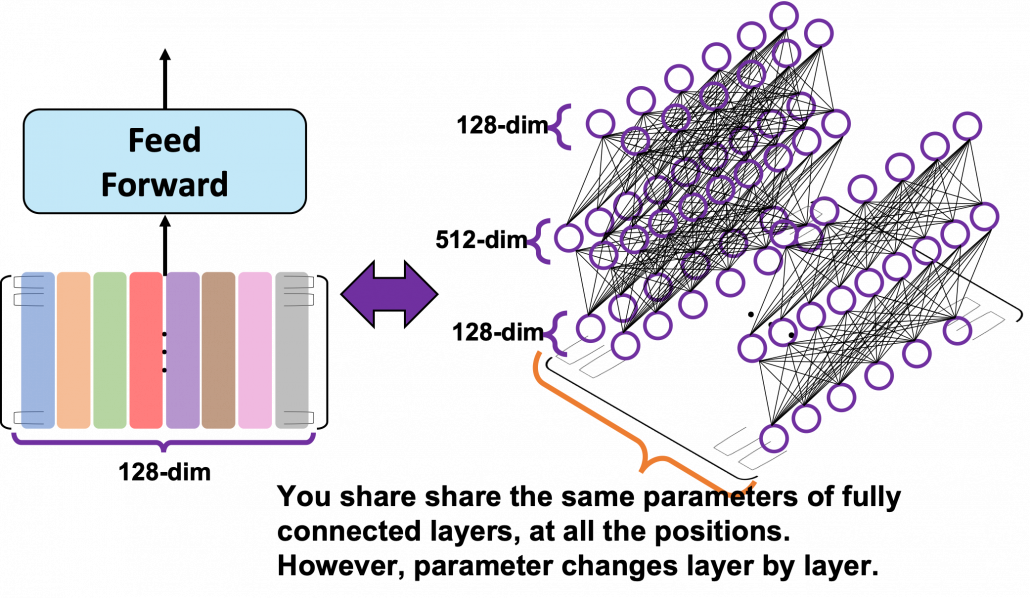
From the number of parameters of the position-wise feed forward neural networks, you can see that you share the same parameters over all the positions of the sentences. That means in the figure above, you use the same densely connected layers at all the positions, in single layer. But you also have to keep it in mind that parameters for position-wise feed-forward networks change from layer to layer. That is also true of “Layer” parts in Transformer model, including the output part of the decoder: there are no learnable parameters which cover over different positions of tokens. These facts lead to one very important feature of Transformer: the number of parameters does not depend on the length of input or target sentences. You can offset the influences of the length of sentences with multi-head attention mechanisms. Also in the decoder part, you can keep the shape of sentences, or reweighted values, layer by layer, which is expected to enhance calculation efficiency of Transformer models.

4, The decoder

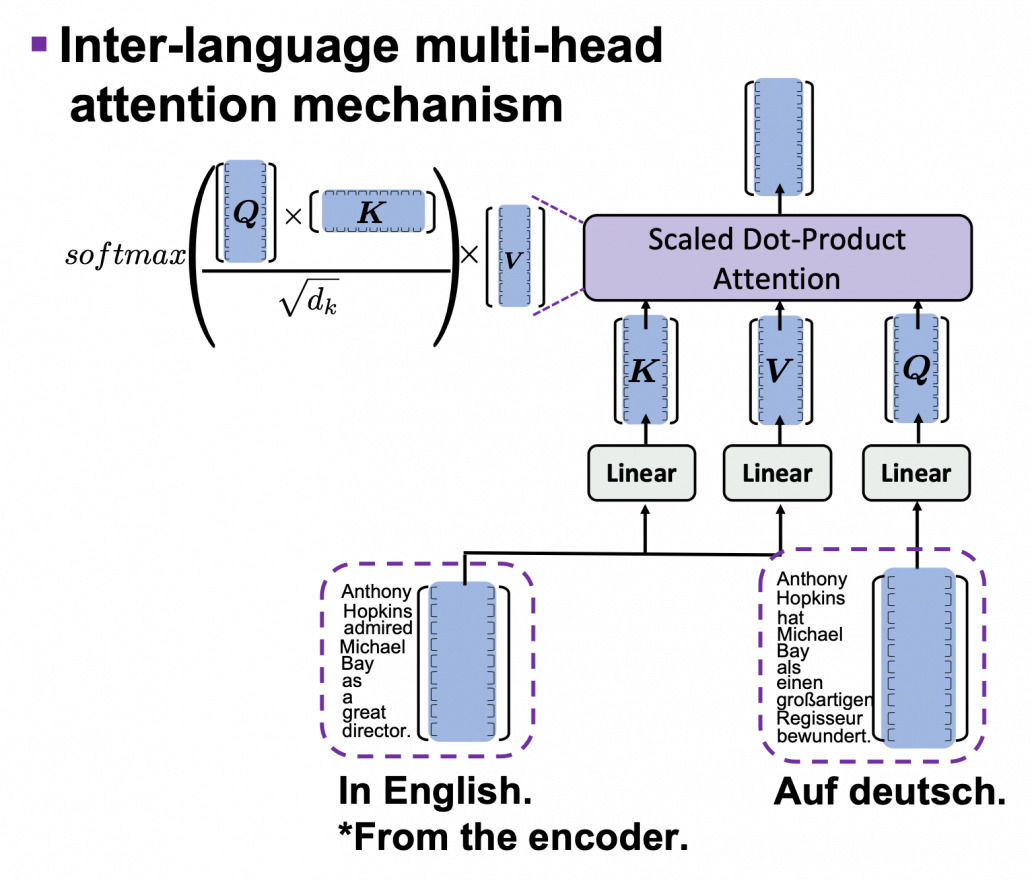
The structures of DecoderLayer() and the Decoder() classes are quite similar to those of EncoderLayer() and the Encoder() classes, so if you understand the last section, you would not find it hard to understand the codes below. What you have to care additionally in this section is inter-language multi-head attention mechanism. In the third article I was repeatedly explaining multi-head self attention mechanism, taking the input sentence “Anthony Hopkins admired Michael Bay as a great director.” as an example. However, as I explained in the second article, usually in attention mechanism, you compare sentences with the same meaning in two languages. Thus the decoder part of Transformer model has not only self-attention multi-head attention mechanism of the target sentence, but also an inter-language multi-head attention mechanism. That means, In case of translating from English to German, you compare the sentence “Anthony Hopkins hat Michael Bay als einen großartigen Regisseur bewundert.” with the sentence itself in masked multi-head attention mechanism (, just as I repeatedly explained in the third article). On the other hand, you compare “Anthony Hopkins hat Michael Bay als einen großartigen Regisseur bewundert.” with “Anthony Hopkins admired Michael Bay as a great director.” in the inter-language multi-head attention mechanism (, just as you can see in the figure above).

*The “inter-language multi-head attention mechanism” is my original way to call it.

I briefly mentioned how you calculate the inter-language multi-head attention mechanism in the end of the third article, with some simple codes, but let’s see that again, with more straightforward figures. If you understand my explanation on multi-head attention mechanism in the third article, the inter-language multi-head attention mechanism is nothing difficult to understand. In the multi-head attention mechanism in encoder layers, “queries”, “keys”, and “values” come from the same sentence in English, but in case of inter-language one, only “keys” and “values” come from the original sentence, and “queries” come from the target sentence. You compare “queries” in German with the “keys” in the original sentence in English, and you re-weight the sentence in English. You use the re-weighted English sentence in the decoder part, and you do not need look-ahead mask in this inter-language multi-head attention mechanism.

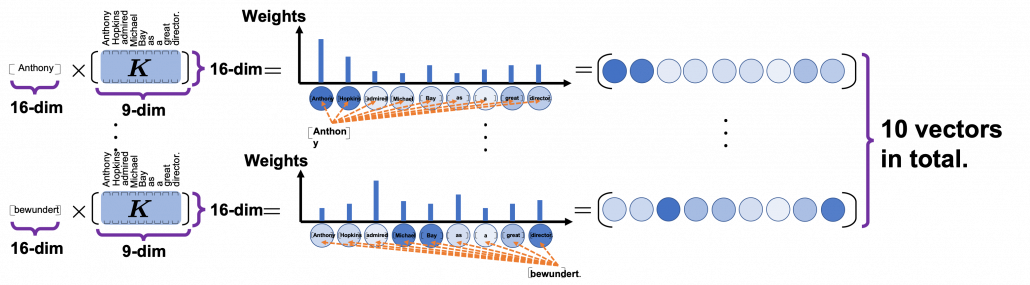
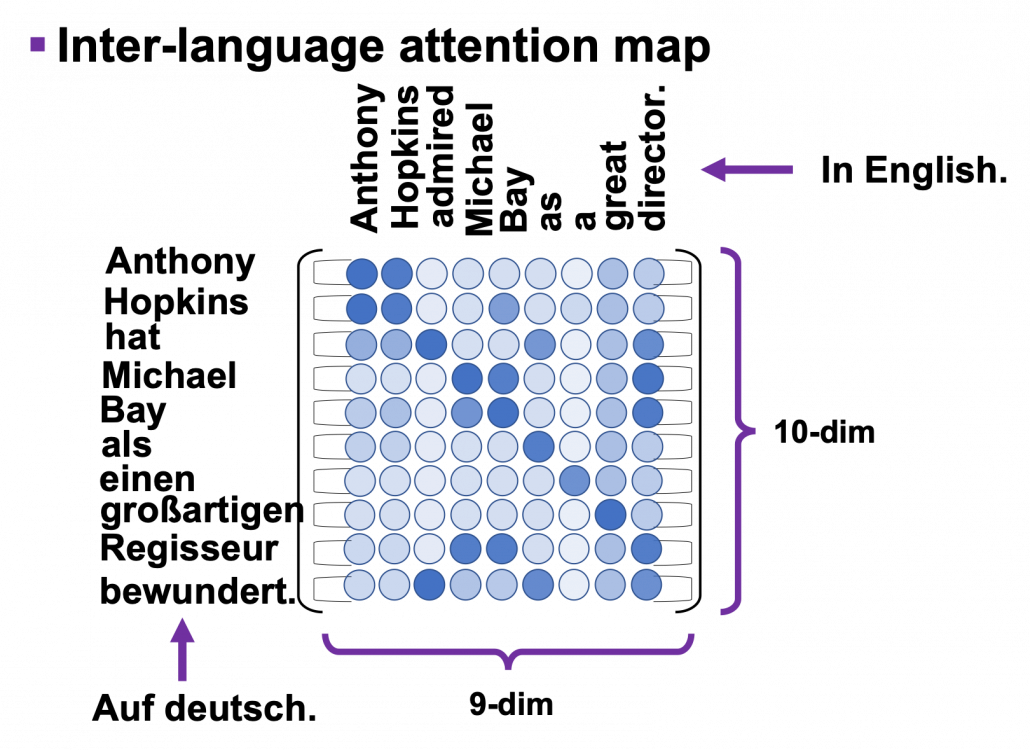
Just as well as multi-head self-attention, you can calculate inter-language multi-head attention mechanism as follows: softmax(\frac{\boldsymbol{Q} \boldsymbol{K} ^T}{\sqrt{d}_k}). In the example above, the resulting multi-head attention map is a 10 \times 9 matrix like in the figure below.

Once you keep the points above in you mind, the implementation of the decoder part should not be that hard.

5 Masking tokens in practice

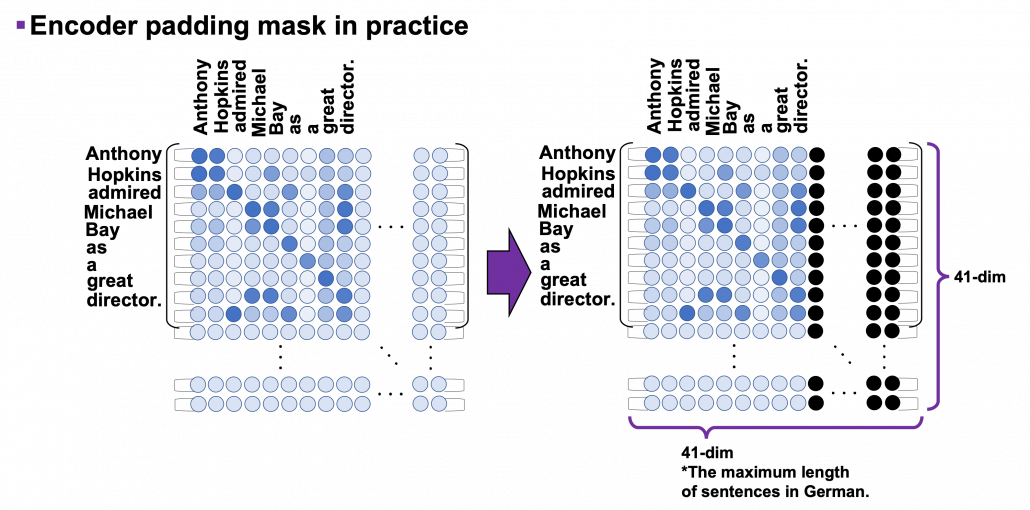
I explained masked-multi-head attention mechanism in the last article, and the ideas itself is not so difficult. However in practice this is implemented in a little tricky way. You might have realized that the size of input matrices is fixed so that it fits the longest sentence. That means, when the maximum length of the input sentences is 41, even if the sentences in a batch have less than 41 tokens, you sample (64, 41) sized tensor as a batch every time (The 64 is a batch size). Let “Anthony Hopkins admired Michael Bay as a great director.”, which has 9 tokens in total, be an input. We have been considering calculating (9, 9) sized attention maps or (10, 9) sized attention maps, but in practice you use (41, 41) or (42, 41) sized ones. When it comes to calculating self attentions in the encoder part, you zero pad self attention maps with encoder padding masks, like in the figure below. The black dots denote the zero valued elements.

As you can see in the codes below, encode padding masks are quite simple. You just multiply the padding masks with -1e9 and add them to attention maps and apply a softmax function. Thereby you can zero-pad the columns in the positions/columns where you added -1e9 to.

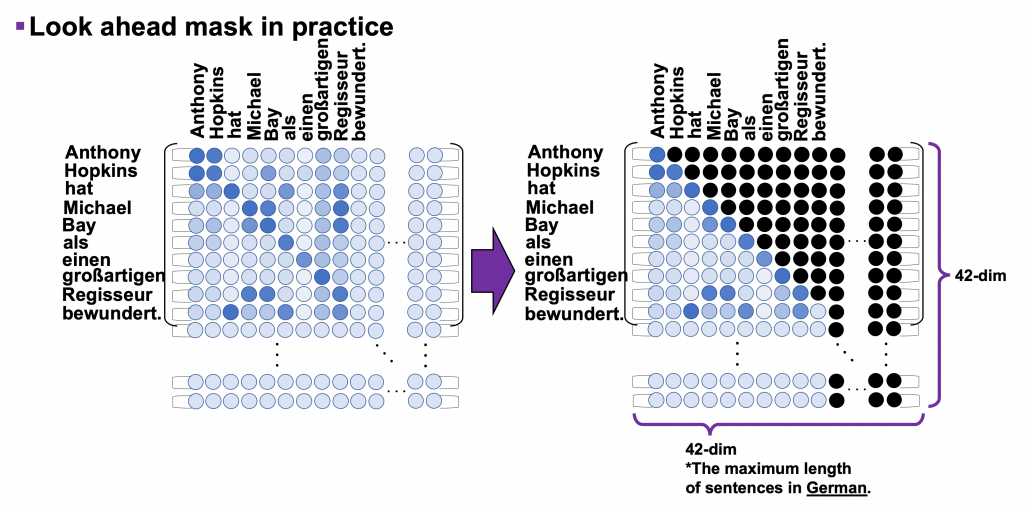
I explained look ahead mask in the last article, and in practice you combine normal padding masks and look ahead masks like in the figure below. You can see that you can compare each token with only its previous tokens. For example you can compare “als” only with “Anthony”, “Hopkins”, “hat”, “Michael”, “Bay”, “als”, not with “einen”, “großartigen”, “Regisseur” or “bewundert.”

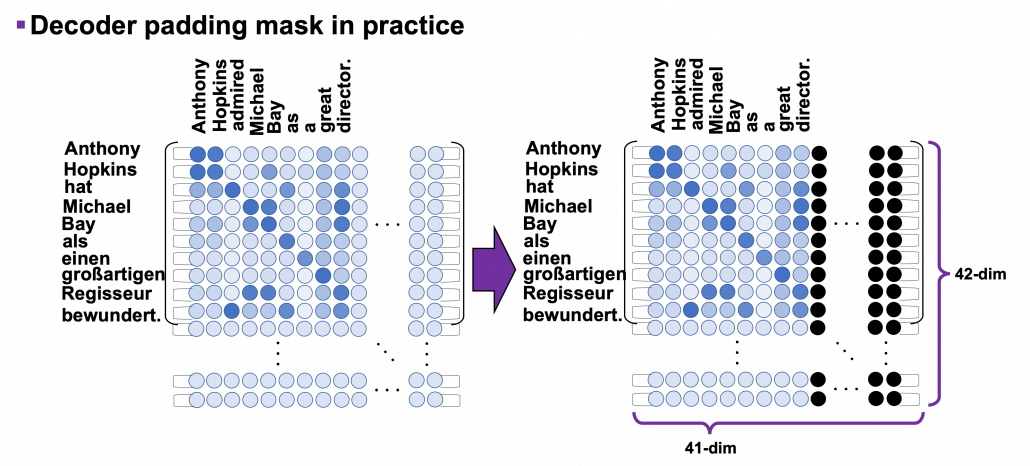
Decoder padding masks are almost the same as encoder one. You have to keep it in mind that you zero pad positions which surpassed the length of the source input sentence.

6 Decoding process

In the last section we have seen that we can zero-pad columns, but still the rows are redundant. However I guess that is not a big problem because you decode the final output in the direction of the rows of attention maps. Once you decode <end> token, you stop decoding. The redundant rows would not affect the decoding anymore.

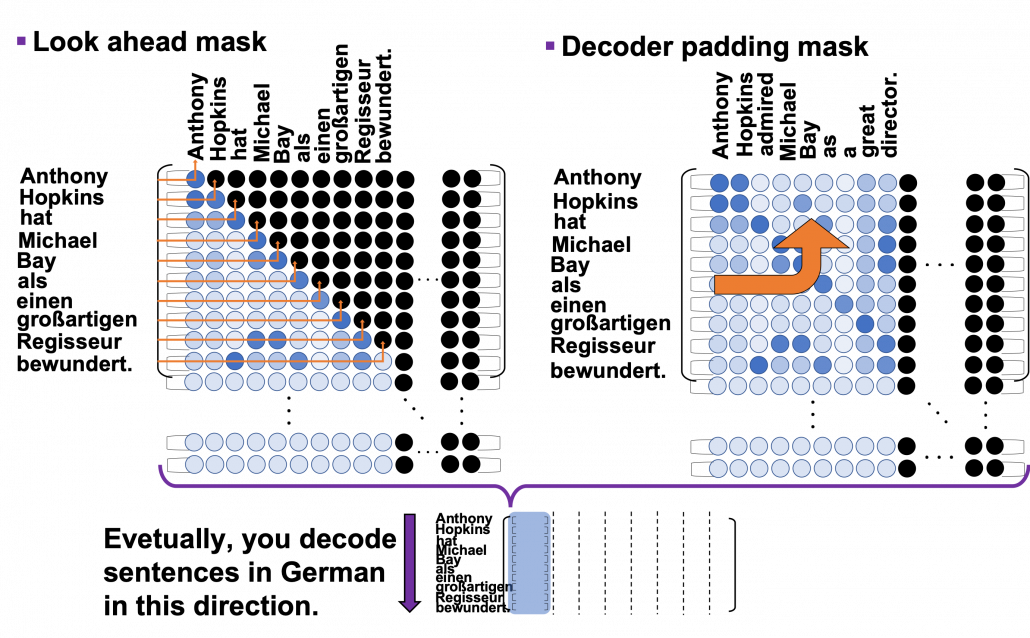
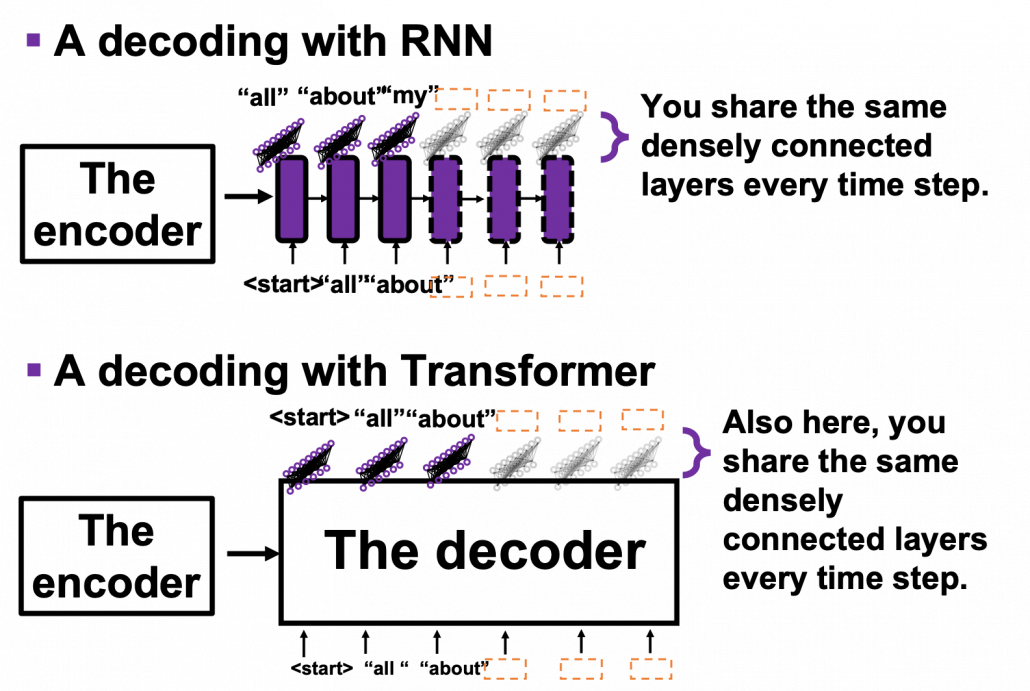
This decoding process is similar to that of seq2seq models with RNNs, and that is why you need to hide future tokens in the self-multi-head attention mechanism in the decoder. You share the same densely connected layers followed by a softmax function, at all the time steps of decoding. Transformer has to learn how to decode only based on the words which have appeared so far.

According to the original paper, “We also modify the self-attention sub-layer in the decoder stack to prevent positions from attending to subsequent positions. This masking, combined with fact that the output embeddings are offset by one position, ensures that the predictions for position i can depend only on the known outputs at positions less than i.” After these explanations, I think you understand the part more clearly.

The codes blow is for the decoding part. You can see that you first start decoding an output sentence with a sentence composed of only <start>, and you decide which word to decoded, step by step.

*It easy to imagine that this decoding procedure is not the best. In reality you have to consider some possibilities of decoding, and you can do that with beam search decoding.

After training this English-German translator for 30 epochs you can translate relatively simple English sentences into German. I displayed some results below, with heat maps of multi-head attention. Each colored attention maps corresponds to each head of multi-head attention. The examples below are all from the fourth (last) layer, but you can visualize maps in any layers. When it comes to look ahead attention, naturally only the lower triangular part of the maps is activated.

This article series has not covered some important topics machine translation, for example how to calculate translation errors. Actually there are many other fascinating topics related to machine translation. For example beam search decoding, which consider some decoding possibilities, or other topics like how to handle proper nouns such as “Anthony” or “Hopkins.” But this article series is not on NLP. I hope you could effectively learn the architecture of Transformer model with examples of languages so far. And also I have not explained some details of training the network, but I will not cover that because I think that depends on tasks. The next article is going to be the last one of this series, and I hope you can see how Transformer is applied in computer vision fields, in a more “linguistic” manner.

But anyway we have finally made it. In this article series we have seen that one of the earliest computers was invented to break Enigma. And today we can quickly make a more or less accurate translator on our desk. With Transformer models, you can even translate deadly funny jokes into German.

*You can train a translator with this code.

*After training a translator, you can translate English sentences into German with this code.

[References]

[1] Ashish Vaswani, Noam Shazeer, Niki Parmar, Jakob Uszkoreit, Llion Jones, Aidan N. Gomez, Lukasz Kaiser, Illia Polosukhin, “Attention Is All You Need” (2017)

[2] “Transformer model for language understanding,” Tensorflow Core
https://www.tensorflow.org/overview

[3] Jay Alammar, “The Illustrated Transformer,”
http://jalammar.github.io/illustrated-transformer/

[4] “Stanford CS224N: NLP with Deep Learning | Winter 2019 | Lecture 14 – Transformers and Self-Attention,” stanfordonline, (2019)
https://www.youtube.com/watch?v=5vcj8kSwBCY

[5]Tsuboi Yuuta, Unno Yuuya, Suzuki Jun, “Machine Learning Professional Series: Natural Language Processing with Deep Learning,” (2017), pp. 91-94
坪井祐太、海野裕也、鈴木潤 著, 「機械学習プロフェッショナルシリーズ 深層学習による自然言語処理」, (2017), pp. 191-193

* I make study materials on machine learning, sponsored by DATANOMIQ. I do my best to make my content as straightforward but as precise as possible. I include all of my reference sources. If you notice any mistakes in my materials, including grammatical errors, please let me know (email: yasuto.tamura@datanomiq.de). And if you have any advice for making my materials more understandable to learners, I would appreciate hearing it.

A Bird’s Eye View: How Machine Learning Can Help You Charge Your E-Scooters

Bird scooters in Columbus, Ohio

Bird scooters in Columbus, Ohio

Ever since I started using bike-sharing to get around in Seattle, I have become fascinated with geolocation data and the transportation sharing economy. When I saw this project leveraging the mobility data RESTful API from the Los Angeles Department of Transportation, I was eager to dive in and get my hands dirty building a data product utilizing a company’s mobility data API.

Unfortunately, the major bike and scooter providers (Bird, JUMP, Lime) don’t have publicly accessible APIs. However, some folks have seemingly been able to reverse-engineer the Bird API used to populate the maps in their Android and iOS applications.

One interesting feature of this data is the nest_id, which indicates if the Bird scooter is in a “nest” — a centralized drop-off spot for charged Birds to be released back into circulation.

I set out to ask the following questions:

  1. Can real-time predictions be made to determine if a scooter is currently in a nest?
  2. For non-nest scooters, can new nest location recommendations be generated from geospatial clustering?

To answer these questions, I built a full-stack machine learning web application, NestGenerator, which provides an automated recommendation engine for new nest locations. This application can help power Bird’s internal nest location generation that runs within their Android and iOS applications. NestGenerator also provides real-time strategic insight for Bird chargers who are enticed to optimize their scooter collection and drop-off route based on proximity to scooters and nest locations in their area.

Bird

The electric scooter market has seen substantial growth with Bird’s recent billion dollar valuation  and their $300 million Series C round in the summer of 2018. Bird offers electric scooters that top out at 15 mph, cost $1 to unlock and 15 cents per minute of use. Bird scooters are in over 100 cities globally and they announced in late 2018 that they eclipsed 10 million scooter rides since their launch in 2017.

Bird scooters in Tel Aviv, Israel

Bird scooters in Tel Aviv, Israel

With all of these scooters populating cities, there’s much-needed demand for people to charge them. Since they are electric, someone needs to charge them! A charger can earn additional income for charging the scooters at their home and releasing them back into circulation at nest locations. The base price for charging each Bird is $5.00. It goes up from there when the Birds are harder to capture.

Data Collection and Machine Learning Pipeline

The full data pipeline for building “NestGenerator”

Data

From the details here, I was able to write a Python script that returned a list of Bird scooters within a specified area, their geolocation, unique ID, battery level and a nest ID.

I collected scooter data from four cities (Atlanta, Austin, Santa Monica, and Washington D.C.) across varying times of day over the course of four weeks. Collecting data from different cities was critical to the goal of training a machine learning model that would generalize well across cities.

Once equipped with the scooter’s latitude and longitude coordinates, I was able to leverage additional APIs and municipal data sources to get granular geolocation data to create an original scooter attribute and city feature dataset.

Data Sources:

  • Walk Score API: returns a walk score, transit score and bike score for any location.
  • Google Elevation API: returns elevation data for all locations on the surface of the earth.
  • Google Places API: returns information about places. Places are defined within this API as establishments, geographic locations, or prominent points of interest.
  • Google Reverse Geocoding API: reverse geocoding is the process of converting geographic coordinates into a human-readable address.
  • Weather Company Data: returns the current weather conditions for a geolocation.
  • LocationIQ: Nearby Points of Interest (PoI) API returns specified PoIs or places around a given coordinate.
  • OSMnx: Python package that lets you download spatial geometries and model, project, visualize, and analyze street networks from OpenStreetMap’s APIs.

Feature Engineering

After extensive API wrangling, which included a four-week prolonged data collection phase, I was finally able to put together a diverse feature set to train machine learning models. I engineered 38 features to classify if a scooter is currently in a nest.

Full Feature Set

Full Feature Set

The features boiled down into four categories:

  • Amenity-based: parks within a given radius, gas stations within a given radius, walk score, bike score
  • City Network Structure: intersection count, average circuity, street length average, average streets per node, elevation level
  • Distance-based: proximity to closest highway, primary road, secondary road, residential road
  • Scooter-specific attributes: battery level, proximity to closest scooter, high battery level (> 90%) scooters within a given radius, total scooters within a given radius


Log-Scale Transformation

For each feature, I plotted the distribution to explore the data for feature engineering opportunities. For features with a right-skewed distribution, where the mean is typically greater than the median, I applied these log transformations to normalize the distribution and reduce the variability of outlier observations. This approach was used to generate a log feature for proximity to closest scooter, closest highway, primary road, secondary road, and residential road.

An example of a log transformation

Statistical Analysis: A Systematic Approach

Next, I wanted to ensure that the features I included in my model displayed significant differences when broken up by nest classification. My thinking was that any features that did not significantly differ when stratified by nest classification would not have a meaningful predictive impact on whether a scooter was in a nest or not.

Distributions of a feature stratified by their nest classification can be tested for statistically significant differences. I used an unpaired samples t-test with a 0.01% significance level to compute a p-value and confidence interval to determine if there was a statistically significant difference in means for a feature stratified by nest classification. I rejected the null hypothesis if a p-value was smaller than the 0.01% threshold and if the 99.9% confidence interval did not straddle zero. By rejecting the null-hypothesis in favor of the alternative hypothesis, it’s deemed there is a significant difference in means of a feature by nest classification.

Battery Level Distribution Stratified by Nest Classification to run a t-test

Battery Level Distribution Stratified by Nest Classification to run a t-test

Log of Closest Scooter Distribution Stratified by Nest Classification to run a t-test

Throwing Away Features

Using the approach above, I removed ten features that did not display statistically significant results.

Statistically Insignificant Features Removed Before Model Development

Model Development

I trained two models, a random forest classifier and an extreme gradient boosting classifier since tree-based models can handle skewed data, capture important feature interactions, and provide a feature importance calculation. I trained the models on 70% of the data collected for all four cities and reserved the remaining 30% for testing.

After hyper-parameter tuning the models for performance on cross-validation data it was time to run the models on the 30% of test data set aside from the initial data collection.

I also collected additional test data from other cities (Columbus, Fort Lauderdale, San Diego) not involved in training the models. I took this step to ensure the selection of a machine learning model that would generalize well across cities. The performance of each model on the additional test data determined which model would be integrated into the application development.

Performance on Additional Cities Test Data

The Random Forest Classifier displayed superior performance across the board

The Random Forest Classifier displayed superior performance across the board

I opted to move forward with the random forest model because of its superior performance on AUC score and accuracy metrics on the additional cities test data. AUC is the Area under the ROC Curve, and it provides an aggregate measure of model performance across all possible classification thresholds.

AUC Score on Test Data for each Model

AUC Score on Test Data for each Model

Feature Importance

Battery level dominated as the most important feature. Additional important model features were proximity to high level battery scooters, proximity to closest scooter, and average distance to high level battery scooters.

Feature Importance for the Random Forest Classifier

Feature Importance for the Random Forest Classifier

The Trade-off Space

Once I had a working machine learning model for nest classification, I started to build out the application using the Flask web framework written in Python. After spending a few days of writing code for the application and incorporating the trained random forest model, I had enough to test out the basic functionality. I could finally run the application locally to call the Bird API and classify scooter’s into nests in real-time! There was one huge problem, though. It took more than seven minutes to generate the predictions and populate in the application. That just wasn’t going to cut it.

The question remained: will this model deliver in a production grade environment with the goal of making real-time classifications? This is a key trade-off in production grade machine learning applications where on one end of the spectrum we’re optimizing for model performance and on the other end we’re optimizing for low latency application performance.

As I continued to test out the application’s performance, I still faced the challenge of relying on so many APIs for real-time feature generation. Due to rate-limiting constraints and daily request limits across so many external APIs, the current machine learning classifier was not feasible to incorporate into the final application.

Run-Time Compliant Application Model

After going back to the drawing board, I trained a random forest model that relied primarily on scooter-specific features which were generated directly from the Bird API.

Through a process called vectorization, I was able to transform the geolocation distance calculations utilizing NumPy arrays which enabled batch operations on the data without writing any “for” loops. The distance calculations were applied simultaneously on the entire array of geolocations instead of looping through each individual element. The vectorization implementation optimized real-time feature engineering for distance related calculations which improved the application response time by a factor of ten.

Feature Importance for the Run-time Compliant Random Forest Classifier

Feature Importance for the Run-time Compliant Random Forest Classifier

This random forest model generalized well on test-data with an AUC score of 0.95 and an accuracy rate of 91%. The model retained its prediction accuracy compared to the former feature-rich model, but it gained 60x in application performance. This was a necessary trade-off for building a functional application with real-time prediction capabilities.

Geospatial Clustering

Now that I finally had a working machine learning model for classifying nests in a production grade environment, I could generate new nest locations for the non-nest scooters. The goal was to generate geospatial clusters based on the number of non-nest scooters in a given location.

The k-means algorithm is likely the most common clustering algorithm. However, k-means is not an optimal solution for widespread geolocation data because it minimizes variance, not geodetic distance. This can create suboptimal clustering from distortion in distance calculations at latitudes far from the equator. With this in mind, I initially set out to use the DBSCAN algorithm which clusters spatial data based on two parameters: a minimum cluster size and a physical distance from each point. There were a few issues that prevented me from moving forward with the DBSCAN algorithm.

  1. The DBSCAN algorithm does not allow for specifying the number of clusters, which was problematic as the goal was to generate a number of clusters as a function of non-nest scooters.
  2. I was unable to hone in on an optimal physical distance parameter that would dynamically change based on the Bird API data. This led to suboptimal nest locations due to a distortion in how the physical distance point was used in clustering. For example, Santa Monica, where there are ~15,000 scooters, has a higher concentration of scooters in a given area whereas Brookline, MA has a sparser set of scooter locations.

An example of how sparse scooter locations vs. highly concentrated scooter locations for a given Bird API call can create cluster distortion based on a static physical distance parameter in the DBSCAN algorithm. Left:Bird scooters in Brookline, MA. Right:Bird scooters in Santa Monica, CA.

An example of how sparse scooter locations vs. highly concentrated scooter locations for a given Bird API call can create cluster distortion based on a static physical distance parameter in the DBSCAN algorithm. Left:Bird scooters in Brookline, MA. Right:Bird scooters in Santa Monica, CA.

Given the granularity of geolocation scooter data I was working with, geospatial distortion was not an issue and the k-means algorithm would work well for generating clusters. Additionally, the k-means algorithm parameters allowed for dynamically customizing the number of clusters based on the number of non-nest scooters in a given location.

Once clusters were formed with the k-means algorithm, I derived a centroid from all of the observations within a given cluster. In this case, the centroids are the mean latitude and mean longitude for the scooters within a given cluster. The centroids coordinates are then projected as the new nest recommendations.

NestGenerator showcasing non-nest scooters and new nest recommendations utilizing the K-Means algorithm

NestGenerator showcasing non-nest scooters and new nest recommendations utilizing the K-Means algorithm.

NestGenerator Application

After wrapping up the machine learning components, I shifted to building out the remaining functionality of the application. The final iteration of the application is deployed to Heroku’s cloud platform.

In the NestGenerator app, a user specifies a location of their choosing. This will then call the Bird API for scooters within that given location and generate all of the model features for predicting nest classification using the trained random forest model. This forms the foundation for map filtering based on nest classification. In the app, a user has the ability to filter the map based on nest classification.

Drop-Down Map View filtering based on Nest Classification

Drop-Down Map View filtering based on Nest Classification

Nearest Generated Nest

To see the generated nest recommendations, a user selects the “Current Non-Nest Scooters & Predicted Nest Locations” filter which will then populate the application with these nest locations. Based on the user’s specified search location, a table is provided with the proximity of the five closest nests and an address of the Nest location to help inform a Bird charger in their decision-making.

NestGenerator web-layout with nest addresses and proximity to nearest generated nests

NestGenerator web-layout with nest addresses and proximity to nearest generated nests

Conclusion

By accurately predicting nest classification and clustering non-nest scooters, NestGenerator provides an automated recommendation engine for new nest locations. For Bird, this application can help power their nest location generation that runs within their Android and iOS applications. NestGenerator also provides real-time strategic insight for Bird chargers who are enticed to optimize their scooter collection and drop-off route based on scooters and nest locations in their area.

Code

The code for this project can be found on my GitHub

Comments or Questions? Please email me an E-Mail!


Language Detecting with sklearn by determining Letter Frequencies

Of course, there are better and more efficient methods to detect the language of a given text than counting its lettes. On the other hand this is a interesting little example to show the impressing ability of todays machine learning algorithms to detect hidden patterns in a given set of data.

For example take the sentence:

“Ceci est une phrase française.”

It’s not to hard to figure out that this sentence is french. But the (lowercase) letters of the same sentence in a random order look like this:

“eeasrsçneticuaicfhenrpaes”

Still sure it’s french? Regarding the fact that this string contains the letter “ç” some people could have remembered long passed french lessons back in school and though might have guessed right. But beside the fact that the french letter “ç” is also present for example in portuguese, turkish, catalan and a few other languages, this is still a easy example just to explain the problem. Just try to guess which language might have generated this:

“ogldviisnntmeyoiiesettpetorotrcitglloeleiengehorntsnraviedeenltseaecithooheinsnstiofwtoienaoaeefiitaeeauobmeeetdmsflteightnttxipecnlgtetgteyhatncdisaceahrfomseehmsindrlttdthoaranthahdgasaebeaturoehtrnnanftxndaeeiposttmnhgttagtsheitistrrcudf”

While this looks simply confusing to the human eye and it seems practically impossible to determine the language it was generated from, this string still contains as set of hidden but well defined patterns from which the language could be predictet with almost complete (ca. 98-99%) certainty.

First of all, we need a set of texts in the languages our model should be able to recognise. Luckily with the package NLTK there comes a big set of example texts which actually are protocolls of the european parliament and therefor are publicly availible in 11 differen languages:

  •  Danish
  •  Dutch
  •  English
  •  Finnish
  •  French
  •  German
  •  Greek
  •  Italian
  •  Portuguese
  •  Spanish
  •  Swedish

Because the greek version is not written with the latin alphabet, the detection of the language greek would just be too simple, so we stay with the other 10 languages availible. To give you a idea of the used texts, here is a little sample:

“Resumption of the session I declare resumed the session of the European Parliament adjourned on Friday 17 December 1999, and I would like once again to wish you a happy new year in the hope that you enjoyed a pleasant festive period.
Although, as you will have seen, the dreaded ‘millennium bug’ failed to materialise, still the people in a number of countries suffered a series of natural disasters that truly were dreadful.”

Train and Test

The following code imports the nessesary modules and reads the sample texts from a set of text files into a pandas.Dataframe object and prints some statistics about the read texts:

from pathlib import Path
import random
from collections import Counter, defaultdict
import numpy as np
import pandas as pd
from sklearn.neighbors import *
from matplotlib import pyplot as plt
from mpl_toolkits import mplot3d
%matplotlib inline


def read(file):
    '''Returns contents of a file'''
    with open(file, 'r', errors='ignore') as f:
        text = f.read()
    return text

def load_eu_texts():
    '''Read texts snipplets in 10 different languages into pd.Dataframe

    load_eu_texts() -> pd.Dataframe
    
    The text snipplets are taken from the nltk-data corpus.
    '''
    basepath = Path('/home/my_username/nltk_data/corpora/europarl_raw/langs/')
    df = pd.DataFrame(columns=['text', 'lang', 'len'])
    languages = [None]
    for lang in basepath.iterdir():
        languages.append(lang.as_posix())
        t = '\n'.join([read(p) for p in lang.glob('*')])
        d = pd.DataFrame()
        d['text'] = ''
        d['text'] = pd.Series(t.split('\n'))
        d['lang'] = lang.name.title()
        df = df.append(d.copy(), ignore_index=True)
    return df

def clean_eutextdf(df):
    '''Preprocesses the texts by doing a set of cleaning steps
    
    clean_eutextdf(df) -> cleaned_df
    '''
    # Cuts of whitespaces a the beginning and and
    df['text'] = [i.strip() for i in df['text']]
    # Generate a lowercase Version of the text column
    df['ltext'] = [i.lower() for i in df['text']]

    # Determining the length of each text
    df['len'] = [len(i) for i in df['text']]
    # Drops all texts that are not at least 200 chars long
    df = df.loc[df['len'] > 200]
    return df

# Execute the above functions to load the texts
df = clean_eutextdf(load_eu_texts())

# Print a few stats of the read texts
textline = 'Number of text snippplets: ' + str(df.shape[0])
print('\n' + textline + '\n' + ''.join(['_' for i in range(len(textline))]))
c = Counter(df['lang'])
for l in c.most_common():
    print('%-25s' % l[0] + str(l[1]))
df.sample(10)
Number of text snippplets: 56481
________________________________
French                   6466
German                   6401
Italian                  6383
Portuguese               6147
Spanish                  6016
Finnish                  5597
Swedish                  4940
Danish                   4914
Dutch                    4826
English                  4791
lang	len	text	ltext
135233	Finnish	346	Vastustan sitä , toisin kuin tämän parlamentin...	vastustan sitä , toisin kuin tämän parlamentin...
170400	Danish	243	Desuden ødelægger det centraliserede europæisk...	desuden ødelægger det centraliserede europæisk...
85466	Italian	220	In primo luogo , gli accordi di Sharm el-Sheik...	in primo luogo , gli accordi di sharm el-sheik...
15926	French	389	Pour ce qui est concrètement du barrage de Ili...	pour ce qui est concrètement du barrage de ili...
195321	English	204	Discretionary powers for national supervisory ...	discretionary powers for national supervisory ...
160557	Danish	304	Det er de spørgmål , som de lande , der udgør ...	det er de spørgmål , som de lande , der udgør ...
196310	English	355	What remains of the concept of what a company ...	what remains of the concept of what a company ...
110163	Portuguese	327	Actualmente , é do conhecimento dos senhores d...	actualmente , é do conhecimento dos senhores d...
151681	Danish	203	Dette er vigtigt for den tillid , som samfunde...	dette er vigtigt for den tillid , som samfunde...
200540	English	257	Therefore , according to proponents , such as ...	therefore , according to proponents , such as ...

Above you see a sample set of random rows of the created Dataframe. After removing very short text snipplets (less than 200 chars) we are left with 56481 snipplets. The function clean_eutextdf() then creates a lower case representation of the texts in the coloum ‘ltext’ to facilitate counting the chars in the next step.
The following code snipplet now extracs the features – in this case the relative frequency of each letter in every text snipplet – that are used for prediction:

def calc_charratios(df):
    '''Calculating ratio of any (alphabetical) char in any text of df for each lyric
    
    calc_charratios(df) -> list, pd.Dataframe
    '''
    CHARS = ''.join({c for c in ''.join(df['ltext']) if c.isalpha()})
    print('Counting Chars:')
    for c in CHARS:
        print(c, end=' ')
        df[c] = [r.count(c) for r in df['ltext']] / df['len']
    return list(CHARS), df

features, df = calc_charratios(df)

Now that we have calculated the features for every text snipplet in our dataset, we can split our data set in a train and test set:

def split_dataset(df, ratio=0.5):
    '''Split the dataset into a train and a test dataset
    
    split_dataset(featuredf, ratio) -> pd.Dataframe, pd.Dataframe
    '''
    df = df.sample(frac=1).reset_index(drop=True)
    traindf = df[:][:int(df.shape[0] * ratio)]
    testdf = df[:][int(df.shape[0] * ratio):]
    return traindf, testdf

featuredf = pd.DataFrame()
featuredf['lang'] = df['lang']
for feature in features:
    featuredf[feature] = df[feature]
traindf, testdf = split_dataset(featuredf, ratio=0.80)

x = np.array([np.array(row[1:]) for index, row in traindf.iterrows()])
y = np.array([l for l in traindf['lang']])
X = np.array([np.array(row[1:]) for index, row in testdf.iterrows()])
Y = np.array([l for l in testdf['lang']])

After doing that, we can train a k-nearest-neigbours classifier and test it to get the percentage of correctly predicted languages in the test data set. Because we do not know what value for k may be the best choice, we just run the training and testing with different values for k in a for loop:

def train_knn(x, y, k):
    '''Returns the trained k nearest neighbors classifier
    
    train_knn(x, y, k) -> sklearn.neighbors.KNeighborsClassifier
    '''
    clf = KNeighborsClassifier(k)
    clf.fit(x, y)
    return clf

def test_knn(clf, X, Y):
    '''Tests a given classifier with a testset and return result
    
    text_knn(clf, X, Y) -> float
    '''
    predictions = clf.predict(X)
    ratio_correct = len([i for i in range(len(Y)) if Y[i] == predictions[i]]) / len(Y)
    return ratio_correct

print('''k\tPercentage of correctly predicted language
__________________________________________________''')
for i in range(1, 16):
    clf = train_knn(x, y, i)
    ratio_correct = test_knn(clf, X, Y)
    print(str(i) + '\t' + str(round(ratio_correct * 100, 3)) + '%')
k	Percentage of correctly predicted language
__________________________________________________
1	97.548%
2	97.38%
3	98.256%
4	98.132%
5	98.221%
6	98.203%
7	98.327%
8	98.247%
9	98.371%
10	98.345%
11	98.327%
12	98.3%
13	98.256%
14	98.274%
15	98.309%

As you can see in the output the reliability of the language classifier is generally very high: It starts at about 97.5% for k = 1, increases for with increasing values of k until it reaches a maximum level of about 98.5% at k ≈ 10.

Using the Classifier to predict languages of texts

Now that we have trained and tested the classifier we want to use it to predict the language of example texts. To do that we need two more functions, shown in the following piece of code. The first one extracts the nessesary features from the sample text and predict_lang() predicts the language of a the texts:

def extract_features(text, features):
    '''Extracts all alphabetic characters and add their ratios as feature
    
    extract_features(text, features) -> np.array
    '''
    textlen = len(text)
    ratios = []
    text = text.lower()
    for feature in features:
        ratios.append(text.count(feature) / textlen)
    return np.array(ratios)

def predict_lang(text, clf=clf):
    '''Predicts the language of a given text and classifier
    
    predict_lang(text, clf) -> str
    '''
    extracted_features = extract_features(text, features)
    return clf.predict(np.array(np.array([extracted_features])))[0]

text_sample = df.sample(10)['text']

for example_text in text_sample:
    print('%-20s'  % predict_lang(example_text, clf) + '\t' + example_text[:60] + '...')
Italian             	Auspico che i progetti riguardanti i programmi possano contr...
English             	When that time comes , when we have used up all our resource...
Portuguese          	Creio que o Parlamento protesta muitas vezes contra este mét...
Spanish             	Sobre la base de esta posición , me parece que se puede enco...
Dutch               	Ik voel mij daardoor aangemoedigd omdat ik een brede consens...
Spanish             	Señor Presidente , Señorías , antes que nada , quisiera pron...
Italian             	Ricordo altresì , signora Presidente , che durante la preced...
Swedish             	Betänkande ( A5-0107 / 1999 ) av Berend för utskottet för re...
English             	This responsibility cannot only be borne by the Commissioner...
Portuguese          	A nossa leitura comum é que esse partido tem uma posição man...

With this classifier it is now also possible to predict the language of the randomized example snipplet from the introduction (which is acutally created from the first paragraph of this article):

example_text = "ogldviisnntmeyoiiesettpetorotrcitglloeleiengehorntsnraviedeenltseaecithooheinsnstiofwtoienaoaeefiitaeeauobmeeetdmsflteightnttxipecnlgtetgteyhatncdisaceahrfomseehmsindrlttdthoaranthahdgasaebeaturoehtrnnanftxndaeeiposttmnhgttagtsheitistrrcudf"
predict_lang(example_text)
'English'

The KNN classifier of sklearn also offers the possibility to predict the propability with which a given classification is made. While the probability distribution for a specific language is relativly clear for long sample texts it decreases noticeably the shorter the texts are.

def dict_invert(dictionary):
    ''' Inverts keys and values of a dictionary
    
    dict_invert(dictionary) -> collections.defaultdict(list)
    '''
    inverse_dict = defaultdict(list)
    for key, value in dictionary.items():
        inverse_dict[value].append(key)
    return inverse_dict

def get_propabilities(text, features=features):
    '''Prints the probability for every language of a given text
    
    get_propabilities(text, features)
    '''
    results = clf.predict_proba(extract_features(text, features=features).reshape(1, -1))
    for result in zip(clf.classes_, results[0]):
        print('%-20s' % result[0] + '%7s %%' % str(round(float(100 * result[1]), 4)))


example_text = 'ogldviisnntmeyoiiesettpetorotrcitglloeleiengehorntsnraviedeenltseaecithooheinsnstiofwtoienaoaeefiitaeeauobmeeetdmsflteightnttxipecnlgtetgteyhatncdisaceahrfomseehmsindrlttdthoaranthahdgasaebeaturoehtrnnanftxndaeeiposttmnhgttagtsheitistrrcudf'
print(example_text)
get_propabilities(example_text + '\n')
print('\n')
example_text2 = 'Dies ist ein kurzer Beispielsatz.'
print(example_text2)
get_propabilities(example_text2 + '\n')
ogldviisnntmeyoiiesettpetorotrcitglloeleiengehorntsnraviedeenltseaecithooheinsnstiofwtoienaoaeefiitaeeauobmeeetdmsflteightnttxipecnlgtetgteyhatncdisaceahrfomseehmsindrlttdthoaranthahdgasaebeaturoehtrnnanftxndaeeiposttmnhgttagtsheitistrrcudf
Danish                  0.0 %
Dutch                   0.0 %
English               100.0 %
Finnish                 0.0 %
French                  0.0 %
German                  0.0 %
Italian                 0.0 %
Portuguese              0.0 %
Spanish                 0.0 %
Swedish                 0.0 %


Dies ist ein kurzer Beispielsatz.
Danish                  0.0 %
Dutch                   0.0 %
English                 0.0 %
Finnish                 0.0 %
French              18.1818 %
German              72.7273 %
Italian              9.0909 %
Portuguese              0.0 %
Spanish                 0.0 %
Swedish                 0.0 %

Background and Insights

Why does a relative simple model like counting letters acutally work? Every language has a specific pattern of letter frequencies which can be used as a kind of fingerprint: While there are almost no y‘s in the german language this letter is quite common in english. In french the letter k is not very common because it is replaced with q in most cases.

For a better understanding look at the output of the following code snipplet where only three letters already lead to a noticable form of clustering:

projection='3d')
legend = []
X, Y, Z = 'e', 'g', 'h'

def iterlog(ln):
    retvals = []
    for n in ln:
        try:
            retvals.append(np.log(n))
        except:
            retvals.append(None)
    return retvals

for X in ['t']:
    ax = plt.axes(projection='3d')
    ax.xy_viewLim.intervalx = [-3.5, -2]
    legend = []
    for lang in [l for l in df.groupby('lang') if l[0] in {'German', 'English', 'Finnish', 'French', 'Danish'}]:
        sample = lang[1].sample(4000)

        legend.append(lang[0])
        ax.scatter3D(iterlog(sample[X]), iterlog(sample[Y]), iterlog(sample[Z]))

    ax.set_title('log(10) of the Relativ Frequencies of "' + X.upper() + "', '" + Y.upper() + '" and "' + Z.upper() + '"\n\n')
    ax.set_xlabel(X.upper())
    ax.set_ylabel(Y.upper())
    ax.set_zlabel(Z.upper())
    plt.legend(legend)
    plt.show()


Even though every single letter frequency by itself is not a very reliable indicator, the set of frequencies of all present letters in a text is a quite good evidence because it will more or less represent the letter frequency fingerprint of the given language. Since it is quite hard to imagine or visualize the above plot in more than three dimensions, I used a little trick which shows that every language has its own typical fingerprint of letter frequencies:

legend = []
fig = plt.figure(figsize=(15, 10))
plt.axes(yscale='log')
    
langs = defaultdict(list)

for lang in [l for l in df.groupby('lang') if l[0] in set(df['lang'])]:
    for feature in 'abcdefghijklmnopqrstuvwxyz':
        langs[lang[0]].append(lang[1][feature].mean())

mean_frequencies = {feature:df[feature].mean() for feature in 'abcdefghijklmnopqrstuvwxyz'}
for i in langs.items():
    legend.append(i[0])
    j = np.array(i[1]) / np.array([mean_frequencies[c] for c in 'abcdefghijklmnopqrstuvwxyz'])
    plt.plot([c for c in 'abcdefghijklmnopqrstuvwxyz'], j)
plt.title('Log. of relative Frequencies compared to the mean Frequency in all texts')
plt.xlabel('Letters')
plt.ylabel('(log(Lang. Frequencies / Mean Frequency)')
plt.legend(legend)
plt.grid()
plt.show()

What more?

Beside the fact, that letter frequencies alone, allow us to predict the language of every example text (at least in the 10 languages with latin alphabet we trained for) with almost complete certancy there is even more information hidden in the set of sample texts.

As you might know, most languages in europe belong to either the romanian or the indogermanic language family (which is actually because the romans conquered only half of europe). The border between them could be located in belgium, between france and germany and in swiss. West of this border the romanian languages, which originate from latin, are still spoken, like spanish, portouguese and french. In the middle and northern part of europe the indogermanic languages are very common like german, dutch, swedish ect. If we plot the analysed languages with a different colour sheme this border gets quite clear and allows us to take a look back in history that tells us where our languages originate from:

legend = []
fig = plt.figure(figsize=(15, 10))
plt.axes(yscale='linear')
    
langs = defaultdict(list)
for lang in [l for l in df.groupby('lang') if l[0] in {'German', 'English', 'French', 'Spanish', 'Portuguese', 'Dutch', 'Swedish', 'Danish', 'Italian'}]:
    for feature in 'abcdefghijklmnopqrstuvwxyz':
        langs[lang[0]].append(lang[1][feature].mean())

colordict = {l[0]:l[1] for l in zip([lang for lang in langs], ['brown', 'tomato', 'orangered',
                                                               'green', 'red', 'forestgreen', 'limegreen',
                                                               'darkgreen', 'darkred'])}
mean_frequencies = {feature:df[feature].mean() for feature in 'abcdefghijklmnopqrstuvwxyz'}
for i in langs.items():
    legend.append(i[0])
    j = np.array(i[1]) / np.array([mean_frequencies[c] for c in 'abcdefghijklmnopqrstuvwxyz'])
    plt.plot([c for c in 'abcdefghijklmnopqrstuvwxyz'], j, color=colordict[i[0]])
#     plt.plot([c for c in 'abcdefghijklmnopqrstuvwxyz'], i[1], color=colordict[i[0]])
plt.title('Log. of relative Frequencies compared to the mean Frequency in all texts')
plt.xlabel('Letters')
plt.ylabel('(log(Lang. Frequencies / Mean Frequency)')
plt.legend(legend)
plt.grid()
plt.show()

As you can see the more common letters, especially the vocals like a, e, i, o and u have almost the same frequency in all of this languages. Far more interesting are letters like q, k, c and w: While k is quite common in all of the indogermanic languages it is quite rare in romanic languages because the same sound is written with the letters q or c.
As a result it could be said, that even “boring” sets of data (just give it a try and read all the texts of the protocolls of the EU parliament…) could contain quite interesting patterns which – in this case – allows us to predict quite precisely which language a given text sample is written in, without the need of any translation program or to speak the languages. And as an interesting side effect, where certain things in history happend (or not happend): After two thousand years have passed, modern machine learning techniques could easily uncover this history because even though all these different languages developed, they still have a set of hidden but common patterns that since than stayed the same.

How To Remotely Send R and Python Execution to SQL Server from Jupyter Notebooks

Introduction

Did you know that you can execute R and Python code remotely in SQL Server from Jupyter Notebooks or any IDE? Machine Learning Services in SQL Server eliminates the need to move data around. Instead of transferring large and sensitive data over the network or losing accuracy on ML training with sample csv files, you can have your R/Python code execute within your database. You can work in Jupyter Notebooks, RStudio, PyCharm, VSCode, Visual Studio, wherever you want, and then send function execution to SQL Server bringing intelligence to where your data lives.

This tutorial will show you an example of how you can send your python code from Juptyter notebooks to execute within SQL Server. The same principles apply to R and any other IDE as well. If you prefer to learn through videos, this tutorial is also published on YouTube here:


Environment Setup Prerequisites

  1. Install ML Services on SQL Server

In order for R or Python to execute within SQL, you first need the Machine Learning Services feature installed and configured. See this how-to guide.

  1. Install RevoscalePy via Microsoft’s Python Client

In order to send Python execution to SQL from Jupyter Notebooks, you need to use Microsoft’s RevoscalePy package. To get RevoscalePy, download and install Microsoft’s ML Services Python Client. Documentation Page or Direct Download Link (for Windows).

After downloading, open powershell as an administrator and navigate to the download folder. Start the installation with this command (feel free to customize the install folder): .\Install-PyForMLS.ps1 -InstallFolder “C:\Program Files\MicrosoftPythonClient”

Be patient while the installation can take a little while. Once installed navigate to the new path you installed in. Let’s make an empty folder and open Jupyter Notebooks: mkdir JupyterNotebooks; cd JupyterNotebooks; ..\Scripts\jupyter-notebook

Create a new notebook with the Python 3 interpreter:


To test if everything is setup, import revoscalepy in the first cell and execute. If there are no error messages you are ready to move forward.

Database Setup (Required for this tutorial only)

For the rest of the tutorial you can clone this Jupyter Notebook from Github if you don’t want to copy paste all of the code. This database setup is a one time step to ensure you have the same data as this tutorial. You don’t need to perform any of these setup steps to use your own data.

  1. Create a database

Modify the connection string for your server and use pyodbc to create a new database.

import pyodbc  
# creating a new db to load Iris sample in 
new_db_name = "MLRemoteExec" connection_string = "Driver=SQL Server;Server=localhost\MSSQLSERVER2017;Database={0};Trusted_Connection=Yes;" 

cnxn = pyodbc.connect(connection_string.format("master"), autocommit=True) 

cnxn.cursor().execute("IF EXISTS(SELECT * FROM sys.databases WHERE [name] = '{0}') DROP DATABASE {0}".format(new_db_name)) 

cnxn.cursor().execute("CREATE DATABASE " + new_db_name)

cnxn.close()

print("Database created") 
  1. Import Iris sample from SkLearn

Iris is a popular dataset for beginner data science tutorials. It is included by default in sklearn package.

from sklearn import datasetsimport pandas as pd
# SkLearn has the Iris sample dataset built in to the packageiris = datasets.load_iris()
df = pd.DataFrame(iris.data, columns=iris.feature_names)
  1. Use RecoscalePy APIs to create a table and load the Iris data

(You can also do this with pyodbc, sqlalchemy or other packages)

from revoscalepy import RxSqlServerData, rx_data_step
# Example of using RX APIs to load data into SQL table. You can also do this with pyodbc
table_ref = RxSqlServerData(connection_string=connection_string.format(new_db_name), table="Iris")rx_data_step(input_data = df, output_file = table_ref, overwrite = True)print("New Table Created: Iris")
print("Sklearn Iris sample loaded into Iris table")

Define a Function to Send to SQL Server

Write any python code you want to execute in SQL. In this example we are creating a scatter matrix on the iris dataset and only returning the bytestream of the .png back to Jupyter Notebooks to render on our client.

def send_this_func_to_sql():
    from revoscalepy import RxSqlServerData, rx_import
    from pandas.tools.plotting import scatter_matrix
    import matplotlib.pyplot as plt
    import io    
# remember the scope of the variables in this func are within our SQL Server Python Runtime
    connection_string = "Driver=SQL Server;Server=localhost\MSSQLSERVER2017; Database=MLRemoteExec;Trusted_Connection=Yes;"

# specify a query and load into pandas dataframe df
    sql_query = RxSqlServerData(connection_string=connection_string, sql_query = "select * from Iris")

    df = rx_import(sql_query)
    scatter_matrix(df)

# return bytestream of image created by scatter_matrix
    buf = io.BytesIO()
    plt.savefig(buf, format="png")
    buf.seek(0)
    return buf.getvalue()

Send execution to SQL

Now that we are finally set up, check out how easy sending remote execution really is! First, import revoscalepy. Create a sql_compute_context, and then send the execution of any function seamlessly to SQL Server with RxExec. No raw data had to be transferred from SQL to the Jupyter Notebook. All computation happened within the database and only the image file was returned to be displayed.

from IPython import display
import matplotlib.pyplot as plt 
from revoscalepy import RxInSqlServer, rx_exec# create a remote compute context with connection to SQL Server

sql_compute_context = RxInSqlServer(connection_string=connection_string.format(new_db_name))

# use rx_exec to send the function execution to SQL Server

image = rx_exec(send_this_func_to_sql, compute_context=sql_compute_context)[0]

# only an image was returned to my jupyter client. All data remained secure and was manipulated in my db.

display.Image(data=image)

While this example is trivial with the Iris dataset, imagine the additional scale, performance, and security capabilities that you now unlocked. You can use any of the latest open source R/Python packages to build Deep Learning and AI applications on large amounts of data in SQL Server. We also offer leading edge, high-performance algorithms in Microsoft’s RevoScaleR and RevoScalePy APIs. Using these with the latest innovations in the open source world allows you to bring unparalleled selection, performance, and scale to your applications.

Learn More

Check out SQL Machine Learning Services Documentation to learn how you can easily deploy your R/Python code with SQL stored procedures making them accessible in your ETL processes or to any application. Train and store machine learning models in your database bringing intelligence to where your data lives.

Other YouTube Tutorials:

Statistical Relational Learning – Part 2

In the first part of this series onAn Introduction to Statistical Relational Learning”, I touched upon the basic Machine Learning paradigms, some background and intuition of the concepts and concluded with how the MLN template looks like. In this blog, we will dive in to get an in depth knowledge on the MLN template; again with the help of sample examples. I would then conclude by highlighting the various toolkit available and some of its differentiating features.

MLN Template – explained

A Markov logic network can be thought of as a group of formulas incorporating first-order logic and also tied with a weight. But what exactly does this weight signify?

Weight Learning

According to the definition, it is the log odds between a world where F is true and a world where F is false,

and captures the marginal distribution of the corresponding predicate.

Each formula can be associated with some weight value, that is a positive or negative real number. The higher the value of weight, the stronger the constraint represented by the formula. In contrast to classical logic, all worlds (i.e., Herbrand Interpretations) are possible with a certain probability [1]. The main idea behind this is that the probability of a world increases as the number of formulas it violates decreases.

Markov logic networks with its probabilistic approach combined to logic posit that a world is less likely if it violates formulas unlike in pure logic where a world is false if it violates even a single formula. Consider the case when a formula with high weight i.e. more significance is violated implying that it is less likely in occurrence.

Another important concept during the first phase of Weight Learning while applying an MLN template is “Grounding”. Grounding means to replace each variable/function in predicate with constants from the domain.

Weight Learning – An Example

Note: All examples are highlighted in the Alchemy MLN format

Let us consider an example where we want to identify the relationship between 2 different types of verb-noun pairs i.e noun subject and direct object.

The input predicateFormula.mln file contains

  1. The predicates nsubj(verb, subject) and dobj(verb, object) and
  2. Formula of nsubj(+ver, +s) and dobj(+ver, +o)

These predicates or rules are to learn all possible SVO combinations i.e. what is the probability of a Subject-Verb-Object combination. The + sign ensures a cross product between the domains and learns all combinations. The training database consists of the nsubj and dobj tuples i.e. relations is the evidence used to learn the weights.

When we run the above command for this set of rules against the training evidence, we learn the weights as here:

Note that the formula is now grounded by all occurrences of nsubj and dobj tuples from the training database or evidence and the weights are attached to it at the start of each such combination.

But it should be noted that there is no network yet and this is just a set of weighted first-order logic formulas. The MLN template we created so far will generate Markov networks from all of our ground formulas. Internally, it is represented as a factor graph.where each ground formula is a factor and all the ground predicates found in the ground formula are linked to the factor.

Inference

The definition goes as follows:

Estimate probability distribution encoded by a graphical model, for a given data (or observation).

Out of the many Inference algorithms, the two major ones are MAP & Marginal Inference. For example, in a MAP Inference we find the most likely state of world given evidence, where y is the query and x is the evidence.

which is in turn equivalent to this formula.

Another is the Marginal Inference which computes the conditional probability of query predicates, given some evidence. Some advanced inference algorithms are Loopy Belief Propagation, Walk-SAT, MC-SAT, etc.

The probability of a world is given by the weighted sum of all true groundings of a formula i under an exponential function, divided by the partition function Z i.e. equivalent to the sum of the values of all possible assignments. The partition function acts a normalization constant to get the probability values between 0 and 1.

Inference – An Example

Let us draw inference on the the same example as earlier.

After learning the weights we run inference (with or without partial evidence) and query the relations of interest (nsubj here), to get inferred values.

Tool-kits

Let’s look at some of the MLN tool-kits at disposal to do learning and large scale inference. I have tried to make an assorted list of all tools here and tried to highlight some of its main features & problems.

For example, BUGS i.e. Bayesian Logic uses a Swift Compiler but is Not relational! ProbLog has a Python wrapper and is based on Horn clauses but has No Learning feature. These tools were invented in the initial days, much before the present day MLN looks like.

ProbCog developed at Technical University of Munich (TUM) & the AI Lab at Bremen covers not just MLN but also Bayesian Logic Networks (BLNs), Bayesian Networks & ProLog. In fact, it is now GUI based. Thebeast gives a shell to analyze & inspect model feature weights & missing features.

Alchemy from University of Washington (UoW) was the 1st First Order (FO) probabilistic logic toolkit. RockIt from University of Mannheim has an online & rest based interface and uses only Conjunctive Normal Forms (CNF) i.e. And-Or format in its formulas.

Tuffy scales this up by using a Relational Database Management System (RDBMS) whereas Felix allows Large Scale inference! Elementary makes use of secondary storage and Deep Dive is the current state of the art. All of these tools are part of the HAZY project group at Stanford University.

Lastly, LoMRF i.e. Logical Markov Random Field (MRF) is Scala based and has a feature to analyse different hypothesis by comparing the difference in .mln files!


Hope you enjoyed the read. The content starts from basic concepts and ends up highlighting key tools. In the final part of this 3 part blog series I would explain an application scenario and highlight the active research and industry players. Any feedback as a comment below or through a message is more than welcome!

Back to Part I – Statistical Relational Learning

Additional Links:

[1] Knowledge base files in Logical Markov Random Fields (LoMRF)

[2] (still) nothing clever Posts categorized “Machine Learning” – Markov Logic Networks

[3] A gentle introduction to statistical relational learning: maths, code, and examples

Data Science on a large scale – can it be done?

Analytics drives business

In today’s digital world, data has become the crucial success factor for businesses as they seek to maintain a competitive advantage, and there are numerous examples of how companies have found smart ways of monetizing data and deriving value accordingly.

On the one hand, many companies use data analytics to streamline production lines, optimize marketing channels, minimize logistics costs and improve customer retention rates.  These use cases are often described under the umbrella term of operational BI, where decisions are based on data to improve a company’s internal operations, whether that be a company in the manufacturing industry or an e-commerce platform.

On the other hand, over the last few years, a whole range of new service-oriented companies have popped up whose revenue models wholly depend on data analytics.  These Data-Driven Businesses have contributed largely to the ongoing development of new technologies that make it possible to process and analyze large amounts of data to find the right insights.  The better these technologies are leveraged, the better their value-add and the better for their business success.  Indeed, without data and data analytics, they don’t have a business.

Data Science – hype or has it always been around?Druck

In my opinion, there is too much buzz around the new era of data scientists.  Ten years ago, people simply called it data mining, describing similar skills and methods.  What has actually changed is the fact that businesses are now confronted with new types of data sources such as mobile devices and data-driven applications rather than statistical methodologies.  I described that idea in detail in my recent post Let’s replace the Vs of Big Data with a single D.

But, of course, you cannot deny that the importance of these data crunchers has increased significantly. The art of mining data mountains (or perhaps I should say “diving through data lakes”) to find appropriate insights and models and then find the right answers to urgent, business-critical questions has become very popular these days.

The challenge: Data Science with large volumes?

Michael Stonebraker, winner of the Turing Award 2014, has been quoted as saying: “The change will come when business analysts who work with SQL on large amounts of data give way to data EXASOL Pipelinescientists, which will involve more sophisticated analysis, predictive modeling, regressions and Bayesian classification. That stuff at scale doesn’t work well on anyone’s engine right now. If you want to do complex analytics on big data, you have a big problem right now.”

And if you look at the limitations of existing statistical environments out there using R, Python, Java, Julia and other languages, I think he is absolutely right.  Once the data scientists have to handle larger volumes, the tools are just not powerful and scalable enough.  This results in data sampling or aggregation to make statistical algorithms applicable at all.

A new architecture for “Big Data Science”

We at EXASOL have worked hard to develop a smart solution to respond to this challenge.  Imagine that it is possible to use raw data and intelligent statistical models on very large data sets, directly at the place where the data is stored.  Where the data is processed in-memory to achieve optimal performance, all distributed across a powerful MPP cluster of servers, in an environment where you can now “install” the programming language of your choice.

Sounds far-fetched?  If you are not convinced, then I highly recommend you have a look at our brand-new in-database analytic programming platform, which is deeply integrated in our parallel in-memory engine and extensible through using nearly any programming language and statistical library.

For further information on our approach to big data science, go ahead and download a copy of our technical whitepaper:  Big Data Science – The future of analytics.