Web Scraping Using R..!

In this blog, I’ll show you, How to Web Scrape using R..?

What is R..?

R is a programming language and its environment built for statistical analysis, graphical representation & reporting. R programming is mostly preferred by statisticians, data miners, and software programmers who want to develop statistical software.

R is also available as Free Software under the terms of the Free Software Foundation’s GNU General Public License in source code form.

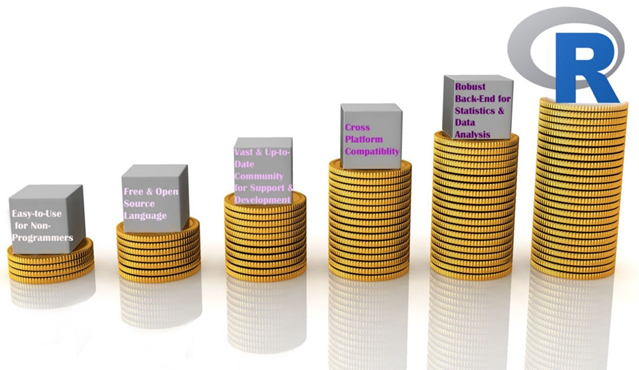
Reasons to choose R

Reasons to choose R

Let’s begin our topic of Web Scraping using R.

Step 1- Select the website & the data you want to scrape.

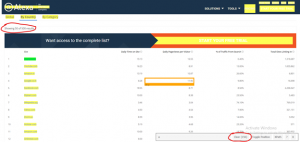
I picked this website “https://www.alexa.com/topsites/countries/IN” and want to scrape data of Top 50 sites in India.

Data we want to scrape

Data we want to scrape

Step 2- Get to know the HTML tags using SelectorGadget.

In my previous blog, I already discussed how to inspect & find the proper HTML tags. So, now I’ll explain an easier way to get the HTML tags.

You have to go to Google chrome extension (chrome://extensions) & search SelectorGadget. Add it to your browser, it’s a quite good CSS selector.

Step 3- R Code

Evoking Important Libraries or Packages

I’m using RVEST package to scrape the data from the webpage; it is inspired by libraries like Beautiful Soup. If you didn’t install the package yet, then follow the code in the snippet below.

Step 4- Set the url of the website

Step 5- Find the HTML tags using SelectorGadget

It’s quite easy to find the proper HTML tags in which your data is present.

Firstly, I have to click on data using SelectorGadget which I want to scrape, it automatically selects the data which are similar to selected HTML tags. Before going forward, cross-check the selected values, are they correct or some junk data is also gets selected..? If you noticed our page has only 50 values, but you can see 156 values are selected.

Selection by SelectorGadget

Selection by SelectorGadget

So I need to remove unwanted values who get selected, once you click on them to deselect it, it turns red and others will turn yellow except our primary selection which turn to green. Now you can see only 50 values are selected as per our primary requirement but it’s not enough. I have to again cross-check that some required values are not exchanged with junk values.

If we satisfy with our selection then copy the HTML tag & include it into the code, else repeat this exercise.

Modified Selection by SelectorGadget

Step 6- Include the tag in our Code

After including the tags, our code is like this.

Code Snippet

If I run the code, values in each list object will be 50.

Data Stored in List Objects

Step 7- Creating DataFrame

Now, we create a dataframe with our list-objects. So for creating a dataframe, we always need to remember one thumb rule that is the number of rows (length of all the lists) should be equal, else we get an error.

Error appears when number of rows differs

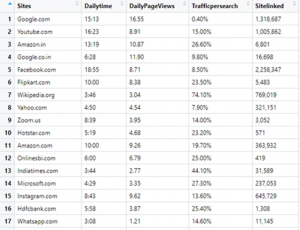
Finally, Our DataFrame will look like this:

Our Final Data

Step 8- Writing our DataFrame to CSV file

We need our scraped data to be available locally for further analysis & model building or other purposes.

Our final piece of code to write it in CSV file is:

Writing to CSV file

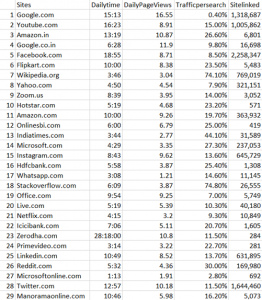
Step 9- Check the CSV file

Data written in CSV file

Conclusion-

I tried to explain Web Scraping using R in a simple way, Hope this will help you in understanding it better.

Find full code on

https://github.com/vgyaan/Alexa/blob/master/webscrap.R

If you have any questions about the code or web scraping in general, reach out to me on LinkedIn!

Okay, we will meet again with the new exposer.

Till then,

Happy Coding..!

Determining Your Data Pipeline Architecture and Its Efficacy

Data analytics has become a central part of how many businesses operate. If you hope to stay competitive in today’s market, you need to take advantage of all your available data. For that, you’ll need an efficient data pipeline, which is often easier said than done.

If your pipeline is too slow, your data will be all but useless by the time it’s usable. Successful analytics require an optimized pipeline, and that looks different for every company. No matter your specific circumstances, though, a traditional approach will result in inefficiencies.

Creating the most efficient pipeline architecture will require you to change how you look at the process. By understanding each stage’s role and how they serve your goals, you can optimize your data analytics.

Understanding Your Data Needs

You can’t build an optimal data pipeline if you don’t know what you need from your data. If you spend too much time collecting and organizing information you won’t use, you’ll take time away from what you need. Similarly, if you only work to meet one team’s needs, you’ll have to go back and start over to help others.

Data analytics involves multiple stakeholders, all with individual needs and expectations that you should consider. Your data engineers need your pipeline to be accessible and scalable, while analysts require visual, relevant datasets. If you consider these aspects from the beginning, you can build a pipeline that works for everyone.

Start at the earliest stage — collection. You may be collecting data from every channel you can, which could result in an information overload. Focus instead on gathering things from the most relevant sources. At the same time, ensure you can add more channels if necessary in the future.

As you reorganize your pipeline, remember that analytics are only as good as your datasets. If you put more effort into organizing and scrubbing data, helpful analytics will follow. Focus on preparing data well, and the last few stages will be smoother.

Creating a Collaborative Pipeline

When structuring your pipeline, it’s easy to focus too much on the individual stages. While seeing things as rigid steps can help you visualize them, you need something more fluid in practice. If you want the process to run as smoothly as possible, it needs to be collaborative.

Look at the software development practice of DevOps, which doubles a team’s likelihood of exceeding productivity goals. This strategy focuses on collaboration across separate teams instead of passing things back and forth between them. You can do the same thing with your data pipeline.

Instead of dividing steps between engineers and analysts, make it a single, cohesive process. Teams will still focus on different areas according to their expertise, but they’ll reduce disruption by working together instead of independently. If workers can collaborate along every step, they don’t have to go back and forth.

Simultaneously, everyone should have clearly defined responsibilities. Collaboration doesn’t mean overstepping your areas of expertise. The goal here isn’t to make everyone handle everything but to ensure they understand each other’s needs.

Eliminating the time between steps also applies to your platform. Look for or build software that integrates both refinement and data preparation. If you have to export data to various programs, it will cause unnecessary bottlenecks.

Enabling Continuous Improvement

Finally, understand that restructuring your data pipeline isn’t a one-and-done job. Another principle you can adopt from DevOps is continuous development across all sides of the process. Your engineers should keep looking for better ways to structure data as your analysts search for new applications for this information.

Make sure you always measure your throughput and efficiency. If you tweak something and you notice the process starts to slow, revert to the older method. If your changes improve the pipeline, try something similar in another area.

Optimize Your Data Pipeline

Remember to start slow when optimizing your data pipeline. Changing too much at once can cause more disruptions than it avoids, so start small with an emphasis on scalability.

The specifics of your pipeline will vary depending on your needs and circumstances. No matter what these are, though, you can benefit from collaboration and continuous development. When you start breaking down barriers between different steps and teams, you unclog your pipeline.

New Era of Data Science in Today’s World

In today’s digital world, most organizations are flooded with data, both structured and unstructured. Data is a commodity now, and organizations should know how to monetize that data and derive a profit from the deluge. And valuing data is one of the best ways enterprises can become successful in distinguishing themselves in the marketplace.

Data is the new oil

Indeed, data itself has become a commodity, and the mere possession of abundant amounts of data is not enough. But the ability to monetize data effectively (and not merely hoard it) can undoubtedly be a source of competitive advantage in the digital economy. However, we need to refine this data. And refinement of this “new oil” will take a reasonable amount of time. In my opinion, we are still not there. As a result, “data refinement” remains a key factor for successful advanced analytics.

If we talk about the level of activity in data and analytics space in the last two years, most advanced analytics evolved around three categories:

  • Descriptive, or what has happened
  • Predictive, or what could happen, and
  • Prescriptive, or what we should do.

Descriptive analytics has been the core analytics for many years. In the past, we could only describe what has happened to historical data (such as that found in a data warehouse), with dashboard reporting, using traditional analytics. But with the advent of advanced analytics, machine learning (ML), and deep learning and artificial intelligence (AI), our focus has changed to real-time analytics. In the last two years, much work has been done in predictive analytics, and as we move forward into our analytics journey, data-centric organizations will now focus on prescriptive analytics. The use of prescriptive analytics, along with predictive analytics, is very important for any organization to be successful in the future.

Current and recent trends in data and analytics

The analytics trends revolve around AI and ML. The Analytics-as-a-Service model is an essential model for any smart, data-driven organization. We can make an impact on society and try to make a better place to live with the use of advanced analytics. At NTT DATA, we strive to solve these problems to improve the quality, safety and advancement of humanity. From a business perspective, we use data analytics and predictive modeling to help companies increase their sales and revenue.

Let me give you some examples. We have been involved with several technology partners in a project for the Smart City. This project involved the use of predictive analytics for the validation of critical alerts to help reduce the time and amount of data required to be processed. It used Internet of Things (IoT) devices, high-definition video cameras, and sound sensors, as well as video and sound data captured from specific locations. Eventually, the solution also integrated with available data from data sources such as crime, weather and social media. The overall objective of the Smart City project was to use and apply advanced analytics with cognitive computing to facilitate safety decision-making, and for a responder to respond earlier based on real-time data.

Another example is the Smart ICU System developed by NTT DATA for predictive detection of threats for seriously ill patients in an ICU, based on the data. This data was consolidated from various medical devices in the ICU into one platform. From that data, we developed a model that predicts the risk of complications that might occur within the next couple of hours or so of a medical event. We have also used advanced analytics provided by weather data forecasting and used predictive models to predict natural disasters.

Data and analytics strategy

A strategy is an essential aspect of any data-driven organization. It should cover data strategy for AI, ML, statistical modeling and other data science disciplines, such as predictive and prescriptive analytics. In general, advanced analytics is more predictive and actionable than retrospective. Smart organizations see positive results when they place a strategy for data and analytics in the hands of employees who are well-positioned to make decisions, such as those who interact with customers, oversee product development, or run production processes. With data-based insight and clear decision rules, employees can deliver more meaningful services, better assess and address customer demands, and optimize production.

Smart organizations must take time to clean and update their underlying modern data architecture — along with their data governance process, for a cleaner data and analytics strategy. A modern data architecture, combined with a good governance process, can leverage AI and ML to help organizations stay ahead of their competitors.

Data analytics innovation

Machine and Deep Learning, along with AI, are all very popular, but I would like to reiterate that advanced technologies like AI and machine learning will continue to transform data analytics. The next innovation could be the use of automated analytics, which machine learning tools can use to identify hidden patterns in data. For example, customer retention issues, customer default on loans, or predicting customers who are prone to auto accidents. Also, predictive analytics and prescriptive analytics are going to be the key for any future innovations in AI and ML.

We must make targeted investments in traditional business innovation tools, along with emerging data analytics tools to derive benefits from data-driven business initiatives. We need to invest in cloud and underlying IT infrastructure to support these analytics and business initiatives. Most importantly, we also need to invest in people — cross training skilled resources and empowering the people who work closely with clients to make the right decisions for analytics.

Bias and Variance in Machine Learning

Machine learning continues to be an ever more vital component of our lives and ecosystem, whether we’re applying the techniques to answer research or business problems or in some cases even predicting the future. Machine learning models need to give accurate predictions in order to create real value for a given industry or domain.

While training a model is one of the key steps in the Data Science Project Life Cycle, how the model generalizes on unseen data is an equally important aspect that should be considered in every Data Science Project Life Cycle. We need to know whether it works and, consequently, if we can trust its predictions. Could the model be merely memorizing the data it is fed with, and therefore unable to make good predictions on future samples, or samples that it hasn’t seen before?

Let’s know the importance of evaluation with a simple example, There are two student’s Ramesh and Suresh preparing for the CAT exam to get into top IIMs (Indian Institute of Management). They both are quite good friends and stayed in the room during preparation and put an equal amount of hard work while solving numerical problems.

They both prepared for almost the same number of hours for the entire year and appeared in the final CAT exam. Surprisingly, Ramesh cleared, but Suresh did not. When asked, we got to know that there was one difference in their strategy of preparation between them, Ramesh had joined a Test Series course where he used to test his knowledge and understanding by giving mock exams and then further evaluating on which portions he is lagging and making necessary adjustments to he is preparation cycle in order to do well in those areas. But Suresh was confident, and he just kept training himself without testing on the preparation he had done.

Like the above situation we can train a Machine Learning Algorithm extensively with many parameters and new techniques, but if you are skipping its evaluation step, you cannot trust your model to perform well on the unseen data. In this article, we explain the importance of Bias, Variance and the trade-off between them in order to know how well a machine learning model generalizes to new, previously unseen data.

Training of Supervised Machine Learning

Bias

Bias is the difference between the Predicted Value and the Expected Value or how far are the predicted values from the actual values. During the training process the model makes certain assumptions on the training data provided. After Training, when it is introduced to the testing/validation data or unseen data, these assumptions may not always be correct.

If we use a large number of nearest neighbors in the K-Nearest Neighbors Algorithm, the model can totally decide that some parameters are not important at all for the modelling.  For example, it can just consider that only two predictor variables are enough to classify the data point though we have more than 10 variables.

This type of model will make very strong assumptions about the other parameters not affecting the outcome at all. You can take it as a model predicting or understanding only the simple relationship when the data points clearly indicate a more complex relationship.

When the model has high bias error, it results in a very simplistic model that does not consider the complexity of the data very well leading to Underfitting.

Variance

Variance occurs when the model performs well on the trained dataset but does not do well on an unseen data set, it is when the model considers the fluctuations or i.e. the noise as in the data as well. The model will still consider the variance as something to learn from because it learns too much from the noise inside the trained data set that it fails to perform as expected on the unseen data.

Based on the above example from Bias, if the model learns that all the ten predictor variables are important to classify a given data point then it tends to have high variance. You can take it as the model is trying to understand every minute detail making it more complex and failing to perform well on the unseen data.

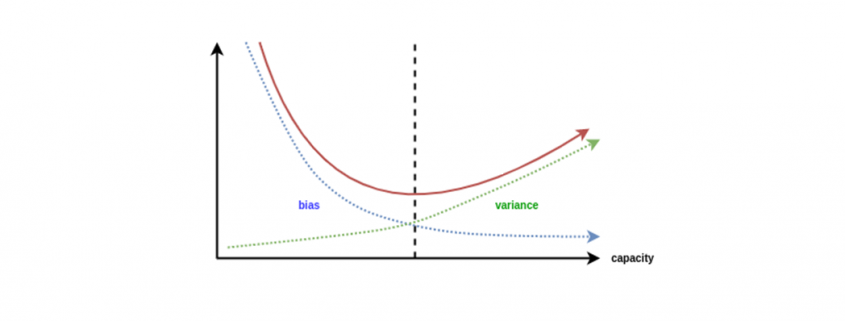
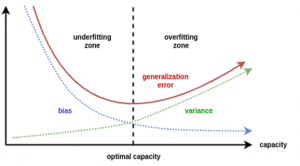
When a model has High Bias error, it underfits the data and makes very simplistic assumptions on it. When a model has High Variance error, it overfits the data and learns too much from it. When a model has balanced Bias and Variance errors, it performs well on the unseen data.

Bias-Variance Trade-off

Based on the definitions of bias and variance, there is clear trade-off between bias and variance when it comes to the performance of the model. A model will have a high error if it has very high bias and low variance and have a high error if it has high variance and low bias.

A model that strikes a balance between the bias and variance can minimize the error better than those that live on extreme ends.

We can find whether the model has High Bias using the below steps:

  1. We tend to get high training errors.
  2. The validation error or test error will be similar to the training error.

We can find whether the model has High Bias using the below steps:

  1. We tend to get low training error
  2. The validation error or test error will be very high.

We can fix the High Bias using below steps:

  1. We need to gather more input features or can even try to create few using the feature engineering techniques.
  2. We can even add few polynomial features in order to increase the complexity.
  3. If we are using any regularization terms in our model, we can try to minimize it.

We can fix the High Variance using below steps:

  1. We can gather more training data so that the model can learn more on the patterns rather than the noise.
  2. We can even try to reduce the input features or do feature selection.
  3.  If we are using any regularization terms in our model we can try to maximize it.

Conclusion

In this article, we got to know the importance of the evaluation step in the Data Science Project Life Cycle, definitions of Bias and Variance, the trade-off between them and the steps we can take to fix the Underfitting and Overfitting of a Machine Learning Model.