Process Mining Camp 2022

Pack your bags, get your provisions, and plan your trip — Just a few more weeks until we get together at this year’s Process Mining Camp on Thursday, 23 June in Eindhoven, the Netherlands.

You can find the camp website with the detailed program here. And of course you should register now to get one of our limited early bird tickets!

While we are in the final stretches of preparing this year’s camp, here is what you can expect.

Practice talks: Listen and learn

Our honest and relatable practice talks are the heart and soul of Process Mining Camp. Here are the speakers who will share their experiences at this this year’s camp.

Get to know your fellow process miners

In the afternoon, we get interactive — Join us for a discussion roundtable and connect to the community on a deeper level.

In small groups of up to eight people, you will talk about process mining topics such as customer journeys, auditing, Lean Six Sigma, the business case for process mining, data transformations, and security, privacy and ethics.

The goal is not to solve all the world’s problems but to share openly and learn from each other. In the interaction with other process miners who have similar backgrounds as you, you can discuss challenges and ideas that deserve further attention.

At the end of the roundtable, each group will share their main insights with the rest of the community, so that we can all benefit.

Talk to us

Lieke Vermeulen – © Lieke.net

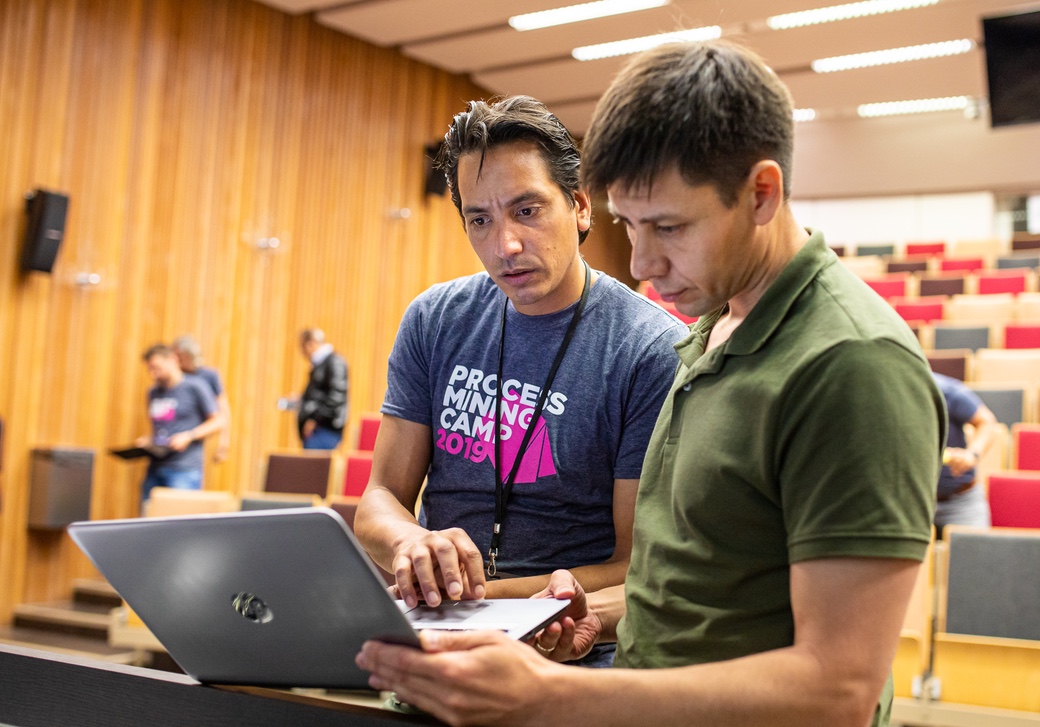
For the very first time at camp, Rudi and Anne will run a process mining clinic. Do you have a data set that defies all your efforts? Questions that you always wanted to get answered? Process mining problems that leave you scratching your head?

Bring your laptop and show them to us! We will unpack the issue together and dig into our experiences to give you expert advice.

The clinic will be available during all the breaks as well as in parallel to the discussion roundtables.

Join the community and sign up now!

Dive into process mining for a whole day, and find out what others in the community are up to. We take care of food and drinks during camp. And if you sign up before Friday 3 June 12:00 CEST, not only can you benefit from our early bird rate — you’ll also get your very own camp t-shirt!

All the breaks, lunch, dinner, and coffee will be outside. Other parts of the camp program will also take place outdoors (learn more about our Corona measures here). We expect this year to be the most summer-campy camp ever. We will even have a sort-of campfire in the form of a BBQ at the end of the day.

Don’t miss Process Mining Camp 2022, and sign up now!

We can’t wait to see you in Eindhoven on 23 June.

— Your friends from Fluxicon

How Do Various Actor-Critic Based Deep Reinforcement Learning Algorithms Perform on Stock Trading?

Deep Reinforcement Learning for Automated Stock Trading: An Ensemble Strategy

Abstract

Deep Reinforcement Learning (DRL) is a blooming field famous for addressing a wide scope of complex decision-making tasks. This article would introduce and summarize the paper “Deep Reinforcement Learning for Automated Stock Trading: An Ensemble Strategy”, and discuss how these actor-critic based DRL learning algorithms, Proximal Policy Optimization (PPO), Advantage Actor Critic (A2C), and Deep Deterministic Policy Gradient (DDPG), act to accomplish automated stock trading by boosting investment return.

1 Motivation and Related Technology

It has long been challenging to design a comprehensive strategy for capital allocation optimization in a complex and dynamic stock market. With development of Artificial Intelligence, machine learning coupled with fundamentals analysis and alternative data has been in trend and provides better performance than conventional methodologies. Reinforcement Learning (RL) as a branch of it, is able to learn from interactions with environment, during which the agent continuously absorbs information, takes actions, and learns to improve its policy regarding rewards or losses obtained. On top of that, DRL utilizes neural networks as function approximators to approximate the Q-value (the expected reward of each action) in RL, which in return adjusts RL for large-scale data learning.

In DRL, the critic-only approach is capable for solving discrete action space problems, calculating Q-value to learn the optimal action-selection policy. On the other side, the actor-only approach, used in continuous action space environments, directly learns the optimal policy itself. Combining both, the actor-critic algorithm simultaneously updates the actor network representing the policy, and critic network representing the value function. The critic estimates the value function, while the actor updates the policy guided by the critic with policy gradients.

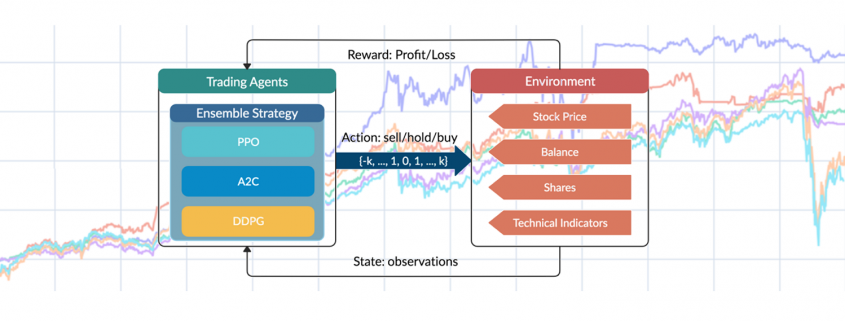
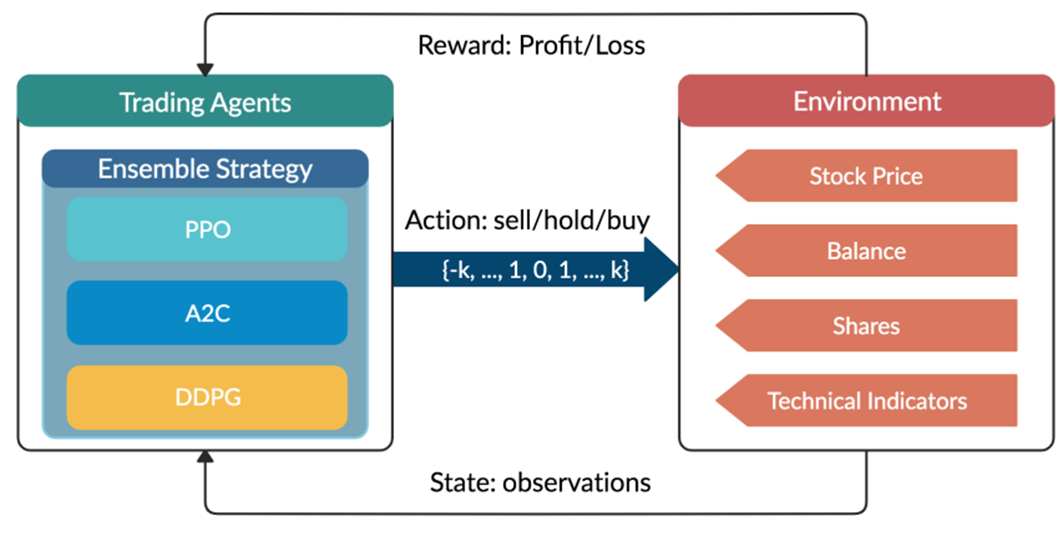
Overview of reinforcement learning-based stock theory.

Figure 1: Overview of reinforcement learning-based stock theory.

2 Mathematical Modeling

2.1 Stock Trading Simulation

Given the stochastic nature of stock market, the trading process is modeled as a Markov Decision Process (MDP) as follows:

  • State s = [p, h, b]: a vector describing the current state of the portfolio consists of D stocks, includes stock prices vector p, the stock shares vector h, and the remaining balance b.
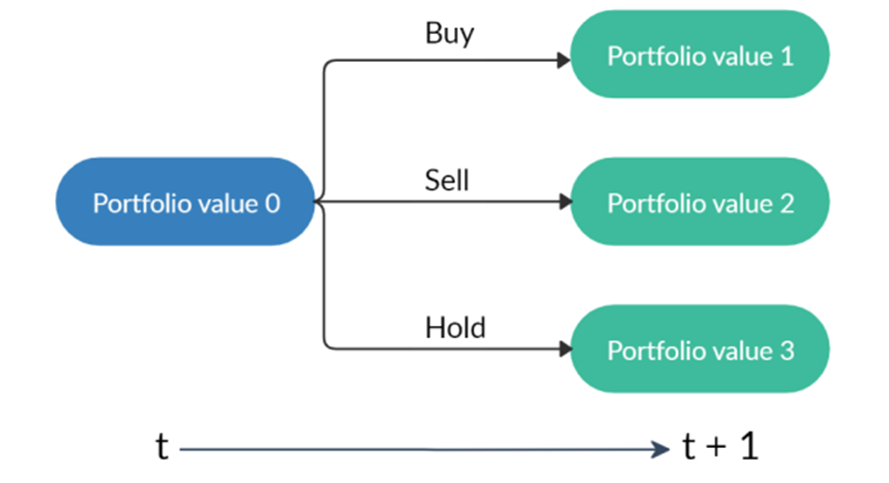
  • Action a: a vector of actions which are selling, buying, or holding (Fig.2), resulting in decreasing, increasing, and no change of shares h, respectively. The number of shares been transacted is recorded as k.
  • Reward r(s, a, s’): the reward of taking action a at state s and arriving at the new state s’.
  • Policy π(s): the trading strategy at state s, which is the probability distribution of actions.
  • Q-value : the expected reward of taking action a at state s following policy π.
A starting portfolio value with three actions result in three possible portfolios.

A starting portfolio value with three actions result in three possible portfolios. Note that “hold” may lead to different portfolio values due to the changing stock prices.

Besides, several assumptions and constraints are proposed for practice:

  • Market liquidity: the orders are rapidly executed at close prices.
  • Nonnegative balance: the balance at time t+1 after taking actions at t, equals to the original balance plus the proceeds of selling minus the spendings of buying:
  • Transaction cost: assume the transaction costs to be 0.1% of the value of each trade:
  • Risk-aversion: to control the risk of stock market crash caused by major emergencies, the financial turbulence index that measures extreme asset price movements is introduced:

    where  denotes the stock returns, µ and Σ are respectively the average and covariance of historical returns. When  exceeds a threshold, buying will be halted and the agent sells all shares. Trading will be resumed once  returns to normal level.

2.2 Trading Goal: Return Maximation

The goal is to design a trading strategy that raises agent’s total cumulative compensation given by the reward function:

and then considering the transition of the shares and the balance defined as:

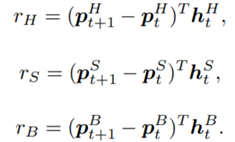
the reward can be further decomposed:

where:

At inception, h and Q_{\pi}(s,a) are initialized to 0, while the policy π(s) is uniformly distributed among all actions. Afterwards, everything is updated through interacting with the stock market environment. By the Bellman Equation, Q_{\pi}(s_t, a_t) is the expectation of the sum of direct reward r(s_t,a_t,s_{t+1} and the future reqard Q_{\pi}(s{t+1}, a_{a+1}) at the next state discounted by a factor γ, resulting in the state-action value function:

2.3 Environment for Multiple Stocks

OpenAI gym is used to implement the multiple stocks trading environment and to train the agent.

  1. State Space: a vector [b_t, p_t, h_t, M_t, R_t, C_t, X_t] storing information about
    b_t: Portfolio balance
    p_t: Adjusted close prices
    h_t: Shares owned of each stock
    M_t: Moving Average Convergence Divergence
    R_t: Relative Strength Index
    C_t: Commodity Channel Index
    X_t: Average Directional Index
  2. Action Space: {−k, …, −1, 0, 1, …, k} for a single stock, whose elements representing the number of shares to buy or sell. The action space is then normalized to [−1, 1], since A2C and PPO are defined directly on a Gaussian distribution.
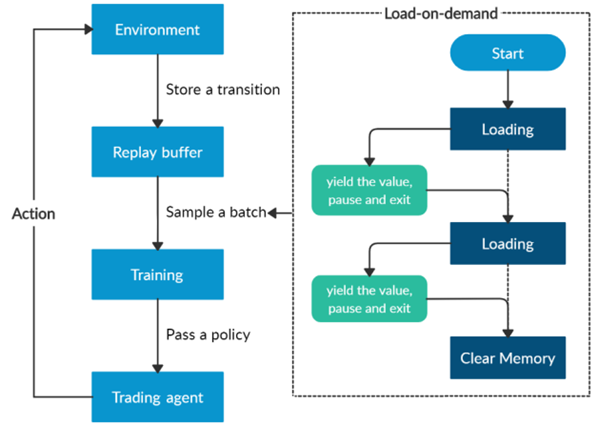
Overview of the load-on-demand technique.

Overview of the load-on-demand technique.

Furthermore, a load-on-demand technique is applied for efficient use of memory as shown above.

  1. Algorithms Selection

This paper mainly uses the following three actor-critic algorithms:

  • A2C: uses parallel copies of the same agent to update gradients for different data samples, and a coordinator to pass the average gradients over all agents to a global network, which can update the actor and the critic network, with the objective function:
  • where \pi_{\theta}(a_t|s_t) is the policy network, and A(S_t|a_t) is the advantage function to reduce the high variance of it:
  • V(S_t)is the value function of state S_t, regardless of actions. DDPG: combines the frameworks of Q-learning and policy gradients and uses neural networks as function approximators; it learns directly from the observations through policy gradient and deterministically map states to actions. The Q-value is updated by:
    Critic network is then updated by minimizing the loss function:
  • PPO: controls the policy gradient update to ensure that the new policy does not differ too much from the previous policy, with the estimated advantage function and a probability ratio:

    The clipped surrogate objective function:

    takes the minimum of the clipped and normal objective to restrict the policy update at each step and improve the stability of the policy.

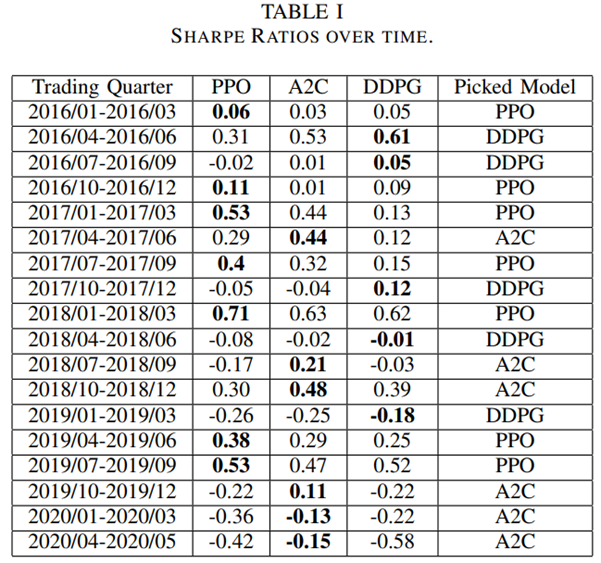
An ensemble strategy is finally proposed to combine the three agents together to build a robust trading strategy. After training and testing the three agents concurrently, in the trading stage, the agent with the highest Sharpe ratio in one period will be automatically selected to use in the next period.

  1. Implementation: Training and Validation

The historical daily trading data comes from the 30 DJIA constituent stocks.

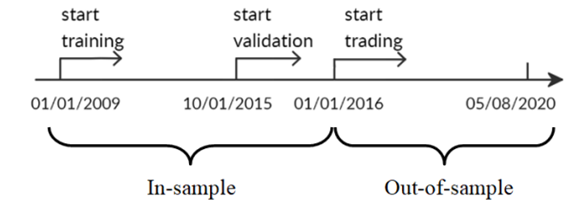
Stock data splitting in-sample and out-of-sample

Stock data splitting in-sample and out-of-sample.

  • In-sample training stage: data from 01/01/2009 – 09/30/2015 used to train 3 agents using PPO, A2C, and DDPG;
  • In-sample validation stage: data from 10/01/2015 – 12/31/2015 used to validate the 3 agents by 5 metrics: cumulative return, annualized return, annualized volatility, Sharpe ratio, and max drawdown; tune key parameters like learning rate and number of episodes;
  • Out-of-sample trading stage: unseen data from 01/01/2016 – 05/08/2020 to evaluate the profitability of algorithms while continuing training. In each quarter, the agent with the highest Sharpe ratio is selected to act in the next quarter, as shown below.

    Table 1 - Sharpe Ratios over time.

    Table 1 – Sharpe Ratios over time.

  1. Results Analysis and Conclusion

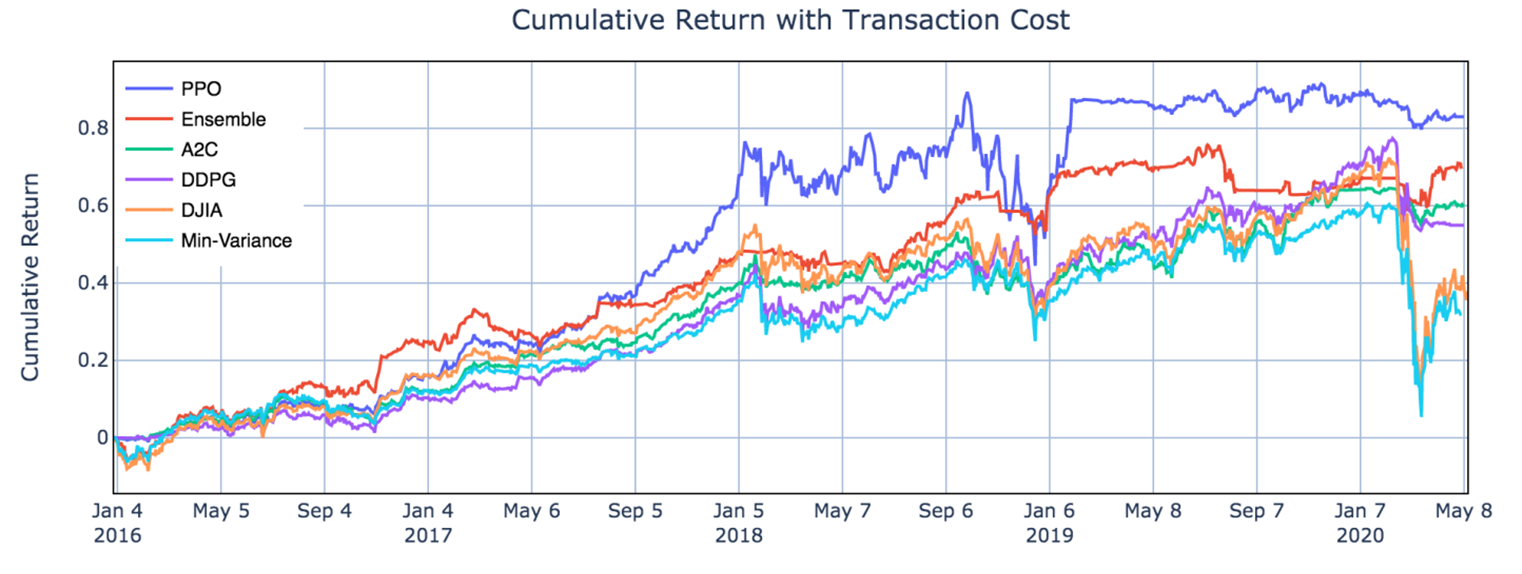
From Table II and Fig.5, one can notice that PPO agent is good at following trend and performs well in chasing for returns, with the highest cumulative return 83.0% and annual return 15.0% among the three agents, indicating its appropriateness in a bullish market. A2C agent is more adaptive to handle risk, with the lowest annual volatility 10.4% and max drawdown −10.2%, suggesting its capability in a bearish market. DDPG generates the lowest return among the three, but works fine under risk, with lower annual volatility and max drawdown than PPO. Apparently all three agents outperform the two benchmarks.

Table 2 - Performance Evaluation Comparison.

Table 2 – Performance Evaluation Comparison.

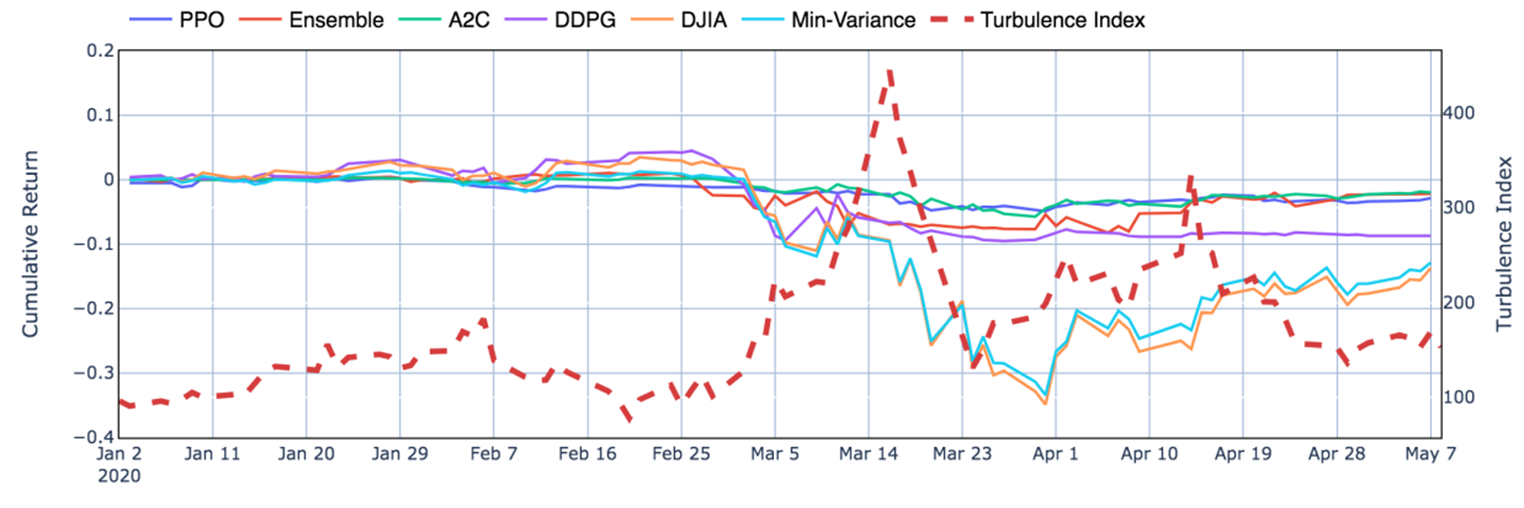
Moreover, it is obvious in Fig.6 that the ensemble strategy and the three agents act well during the 2020 stock market crash, when the agents successfully stops trading, thus cutting losses.

Performance during the stock market crash in the first quarter of 2020.

Performance during the stock market crash in the first quarter of 2020.

From the results, the ensemble strategy demonstrates satisfactory returns and lowest volatilities. Although its cumulative returns are lower than PPO, it has achieved the highest Sharpe ratio 1.30 among all strategies. It is reasonable that the ensemble strategy indeed performs better than the individual algorithms and baselines, since it works in a way each elemental algorithm is supplementary to others while balancing risk and return.

For further improvement, it will be inspiring to explore more models such as Asynchronous Advantage Actor-Critic (A3C) or Twin Delayed DDPG (TD3), and to take more fundamental analysis indicators or ESG factors into consideration. While more sophisticated models and larger datasets are adopted, improvement of efficiency may also be a challenge.

Generative Adversarial Networks GANs

Generative Adversarial Networks

After Deep Autoregressive Models, Deep Generative Modelling and Variational Autoencoders we now continue the discussion with Generative Adversarial Networks (GANs).

Introduction

So far, in the series of deep generative modellings (DGMs [Yad22a]), we have covered autoregressive modelling, which estimates the exact log likelihood defined by the model and variational autoencoders, which was variational approximations for lower bound optimization. Both of these modelling techniques were explicitly defining density functions and optimizing the likelihood of the training data. However, in this blog, we are going to discuss generative adversarial networks (GANs), which are likelihood-free models and do not define density functions explicitly. GANs follow a game-theoretic approach and learn to generate from the training distribution through a set up of a two-player game.
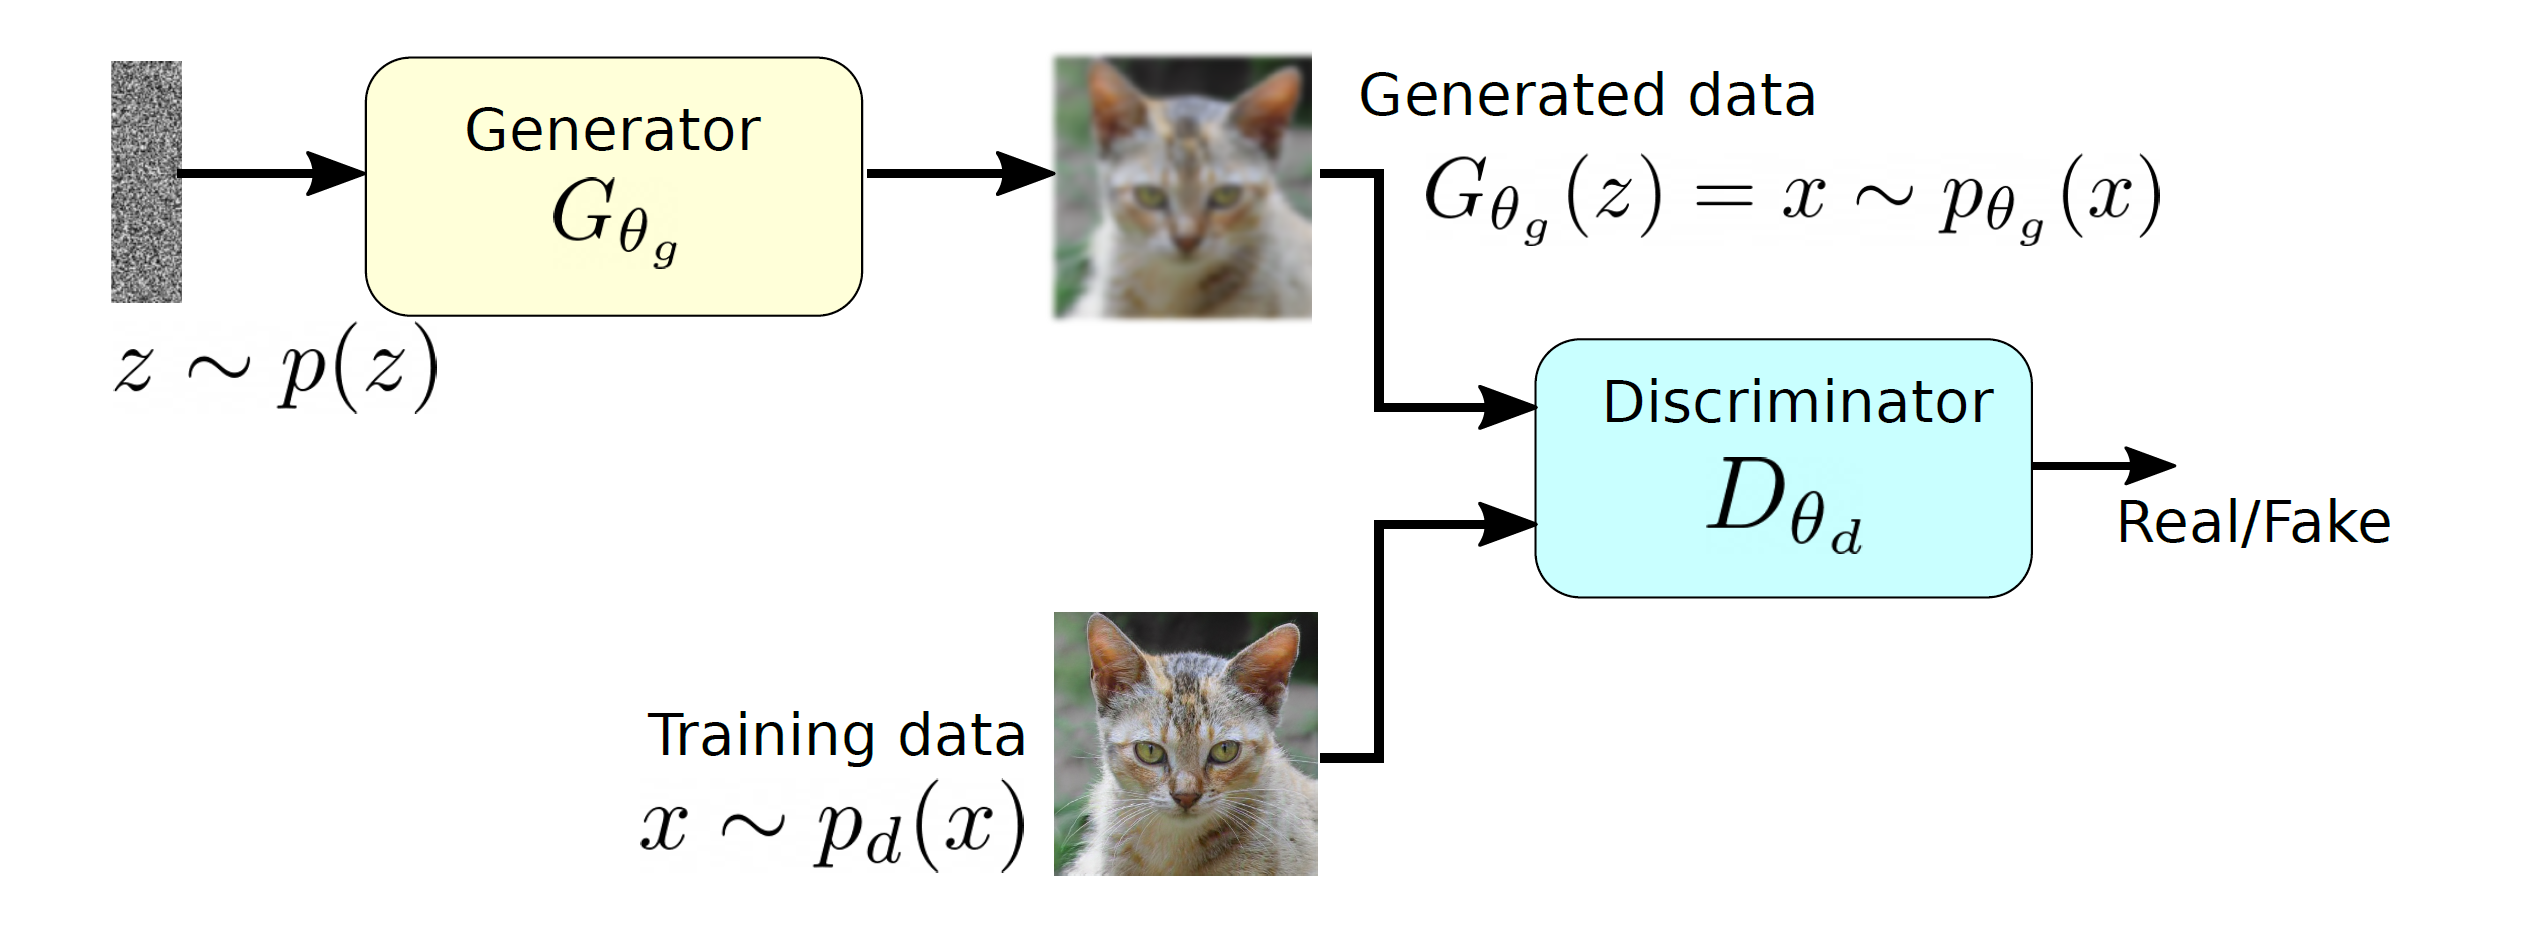
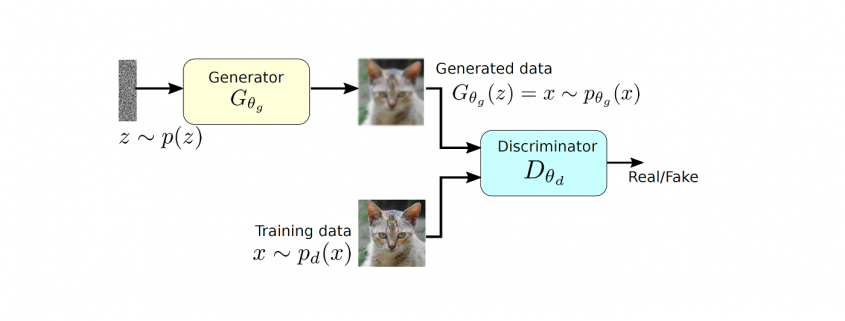
A two player model of GAN along with the generator and discriminators.

A two player model of GAN along with the generator and discriminators.

GAN tries to learn the distribution of high dimensional training data and generates high-quality synthetic data which has a similar distribution to training data. However, learning the training distribution is a highly complex task therefore GAN utilizes a two-player game approach to overcome the high dimensional complexity problem. GAN has two different neural networks (as shown in Figure ??) the generator and the discriminator. The generator takes a random input z\sim p(z) and produces a sample that has a similar distribution as p_d. To train this network efficiently, there is the other network that is utilized as the second player and known as the discriminator. The generator network (player one) tries to fool the discriminator by generating real looking images. Moreover, the discriminator network tries to distinguish between real (training data x\sim p_d(x)) and fake images effectively. Our main aim is to have an efficiently trained discriminator to be able to distinguish between real and fake images (the generator’s output) and on the other hand, we would like to have a generator, which can easily fool the discriminator by generating real-looking images.

Objective function and training

Objective function

Simultaneous training of these two networks is one of the main challenges in GANs and a minimax loss function is defined for this purpose. To understand this minimax function, firstly, we would like to discuss the concept of two sample testing by Aditya grover [Gro20]. Two sample testing is a method to compute the discrepancy between the training data distribution and the generated data distribution:

(1)   \begin{equation*} \min_{p_{\theta_g}}\: \max_{D_{\theta_d}\in F} \: \mathbb{E}_{x\sim p_d}[D_{\theta_d}(x)] - \mathbb{E}_{x\sim p_{\theta_g}} [D_{\theta_d}(G_{\theta_g}(x))], \end{equation*}


where p_{\theta_g} and p_d are the distribution functions of generated and training data respectively. The term F is a set of functions. The \textit{max} part is computing the discrepancies between two distribution using a function D_{\theta_d} \in F and this part is very similar to the term d (discrepancy measure) from our first article (Deep Generative Modelling) and KL-divergence is applied to compute this measure in second article (Deep Autoregressive Models) and third articles (Variational Autoencoders). However, in GANs, for a given set of functions F, we would like compute the distribution p_{\theta_g}, which minimizes the overall discrepancy even for a worse function D_{\theta_d}\in F. The above mentioned objective function does not use any likelihood function and utilizing two different data samples from training and generated data respectively.

By combining Figure ?? and Equation 1, the first term \mathbb{E}_{x\sim p_d}[D_{\theta_d}(x)] corresponds to the discriminator, which has direct access to the training data and the second term \mathbb{E}_{x\sim p_{\theta_g}}[D_{\theta_d}(G_{\theta_g}(x))] represents the generator part as it relies only on the latent space and produces synthetic data. Therefore, Equation 1 can be rewritten in the form of GAN’s two players as:

(2)   \begin{equation*} \min_{p_{\theta_g}}\: \max_{D_{\theta_d}\in F} \: \mathbb{E}_{x\sim p_d}[D_{\theta_d}(x)] - \mathbb{E}_{z\sim p_z}[D_{\theta_d}(G_{\theta_g}(z))], \end{equation*}


The above equation can be rearranged in the form of log loss:

(3)   \begin{equation*} \min_{\theta_g}\: \max_{\theta_d} \: (\mathbb{E}_{x\sim p_d} [log \: D_{\theta_d} (x)] + \mathbb{E}_{z\sim p_z}[log(1 - D_{\theta_d}(G_{\theta_g}(z))]), \end{equation*}

In the above equation, the arguments are modified from p_{\theta_g} and D_{\theta_d} in F to \theta_g and  \theta_d respectively as we would like to approximate the network parameters, which are represented by \theta_g and \theta_d for the both generator and discriminator respectively. The discriminator wants to maximize the above objective for \theta_d such that D_{\theta_d}(x) \approx 1, which indicates that the outcome is close to the real data. Furthermore, D_{\theta_d}(G_{\theta_g}(z)) should be close to zero as it is fake data, therefore, the maximization of the above objective function for \theta_d will ensure that the discriminator is performing efficiently in terms of separating real and fake data. From the generator point of view, we would like to minimize this objective function for \theta_g such that D_{\theta_d}(G_{\theta_g}(z)) \approx 1. If the minimization of the objective function happens effectively for \theta_g then the discriminator will classify a fake data into a real data that means that the generator is producing almost real-looking samples.

Training

The training procedure of GAN can be explained by using the following visualization from Goodfellow et al. [GPAM+14]. In Figure 2(a), z is a random input vector to the generator to produce a synthetic outcome x\sim p_{\theta_g} (green curve). The generated data distribution is not close to the original data distribution p_d (dotted black curve). Therefore, the discriminator classifies this image as a fake image and forces generator to learn the training data distribution (Figure 2(b) and (c)). Finally, the generator produces the image which could not detected as a fake data by discriminator(Figure 2(d)).
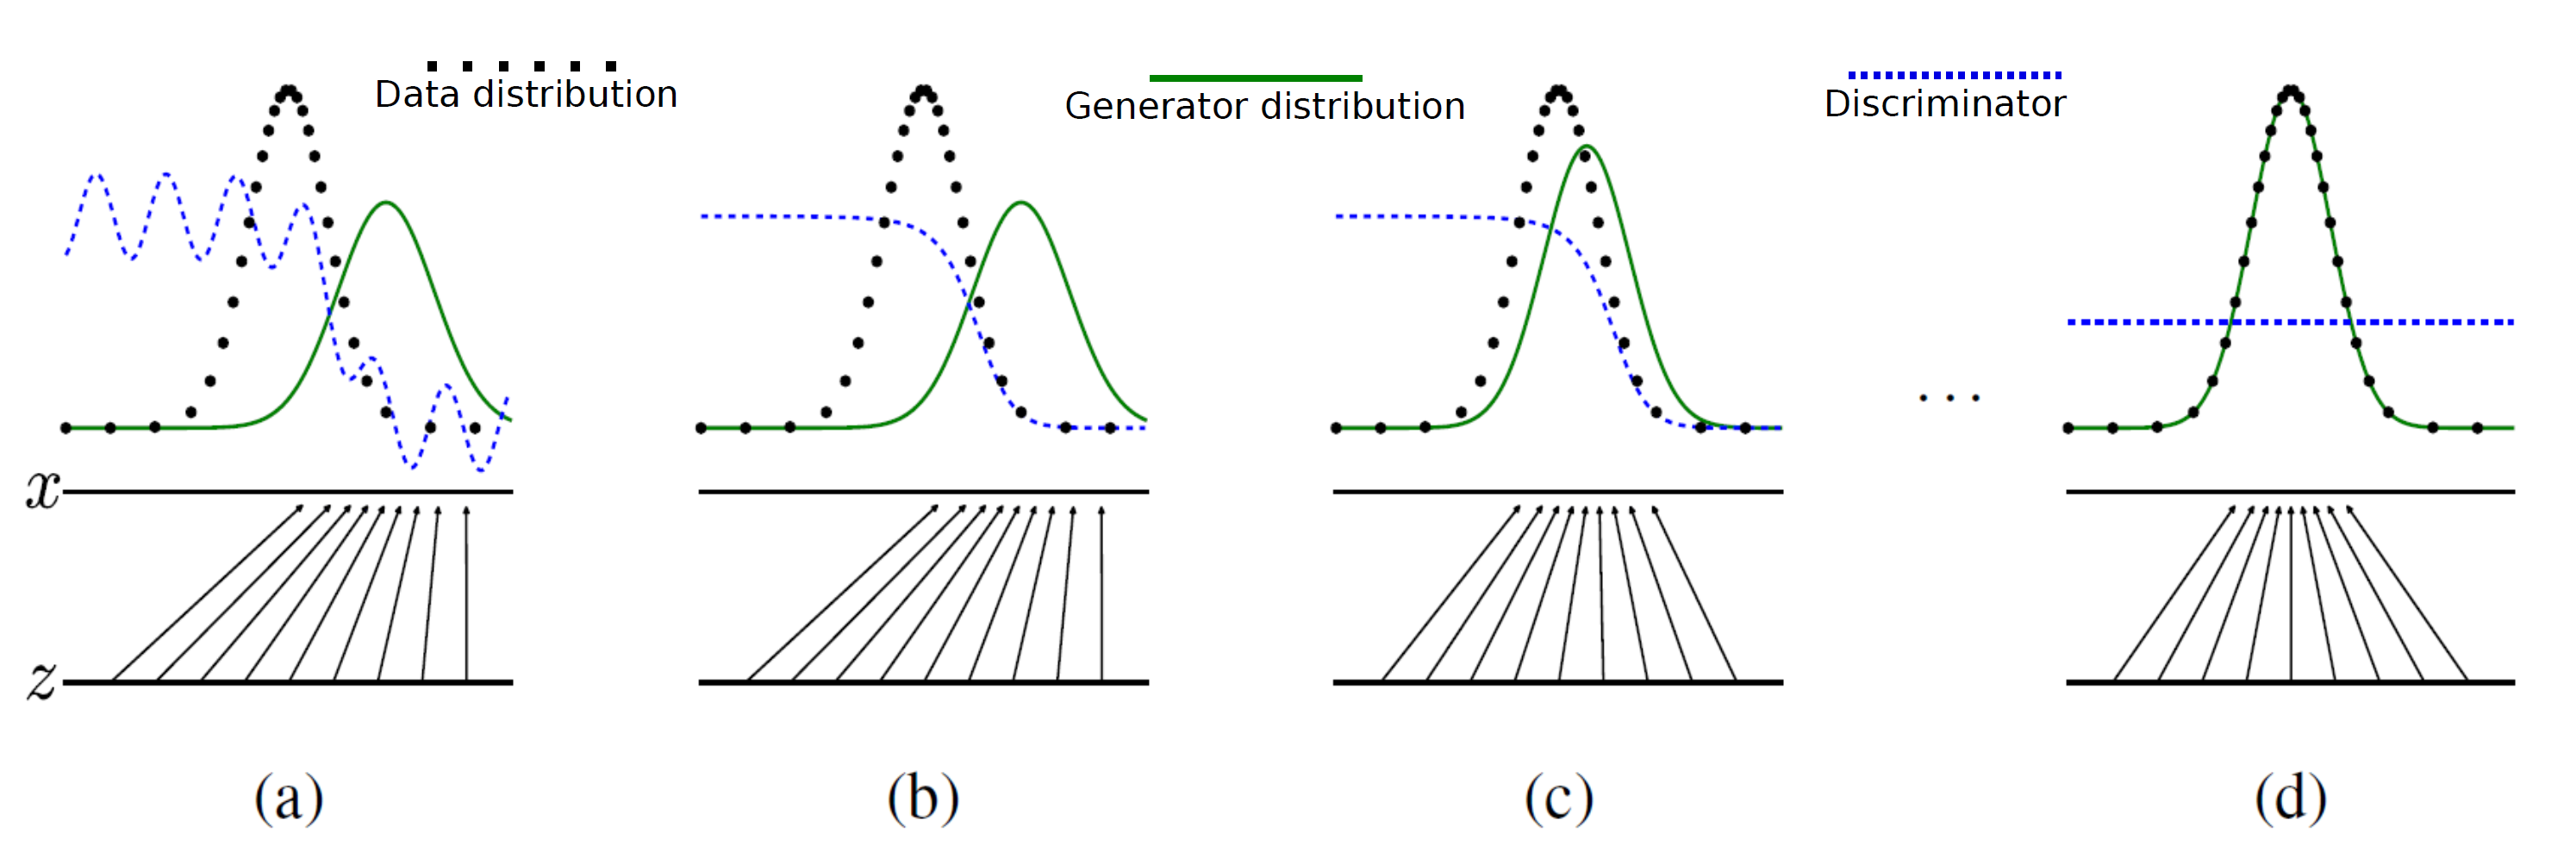
GAN’s training visualization: the dotted black, solid green lines represents pd and pθ respectively. The discriminator distribution is shown in dotted blue. This image taken from Goodfellow et al.

GAN’s training visualization: the dotted black, solid green lines represents pd and pθ
respectively. The discriminator distribution is shown in dotted blue. This image taken from Goodfellow
et al. [GPAM+14].

The optimization of the objective function mentioned in Equation 3 is performed in th following two steps repeatedly:
\begin{enumerate}
\item Firstly, the gradient ascent is utilized to maximize the objective function for \theta_d for discriminator.

(4)   \begin{equation*} \max_{\theta_d} \: (\mathbb{E}_{x\sim p_d} [log \: D_{\theta_d}(x)] + \mathbb{E}_{z\sim p_z}[log(1 - D_{\theta_d}(G_{\theta_g}(z))]) \end{equation*}


\item In the second step, the following function is minimized for the generator using gradient descent.

(5)   \begin{equation*} \min_{\theta_g} \: ( \mathbb{E}_{z\sim p_z}[log(1 - D_{\theta_d}(G_{\theta_g}(z))]) \end{equation*}


\end{enumerate}

However, in practice the minimization for the generator does now work well because when D_{\theta_d}(G_{\theta_g}(z) \approx 1 then the term log \: (1-D_{\theta_d}(G_{\theta_g}(z))) has the dominant gradient and vice versa.

However, we would like to have the gradient behaviour completely opposite because D_{\theta_d}(G_{\theta_g}(z) \approx 1 means the generator is well trained and does not require dominant gradient values. However, in case of D_{\theta_d}(G_{\theta_g}(z) \approx 0, the generator is not well trained and producing low quality outputs therefore, it requires a dominant gradient for an efficient training. To fix this problem, the gradient ascent method is applied to maximize the modified generator’s objective:
In the second step, the following function is minimized for the generator using gradient descent alternatively.

(6)   \begin{equation*} \max_{\theta_g} \: \mathbb{E}_{z\sim p_z}[log \: (D_{\theta_d}(G_{\theta_g}(z))] \end{equation*}


therefore, during the training, Equation 4 and 6 will be maximized using the gradient ascent algorithm until the convergence.

Results

The quality of the generated images using GANs depends on several factors. Firstly, the joint training of GANs is not a stable procedure and that could severely decrease the quality of the outcome. Furthermore, the different neural network architecture will modify the quality of images based on the sophistication of the used network. For example, the vanilla GAN [GPAM+14] uses a fully connected deep neural network and generates a quite decent result. Furthermore, DCGAN [RMC15] utilized deep convolutional networks and enhanced the quality of outcome significantly. Furthermore, different types of loss functions are applied to stabilize the training procedure of GAN and to produce high-quality outcomes. As shown in Figure 3, StyleGAN [KLA19] utilized Wasserstein metric [Yad22b] to generate high-resolution face images. As it can be seen from Figure 3, the quality of the generated images are enhancing with time by applying more sophisticated training techniques and network architectures.

GAN timeline with different variations in terms of network architecture and loss functions.

GAN timeline with different variations in terms of network architecture and loss functions.

Summary

This article covered the basics and mathematical concepts of GANs. However, the training of two different networks simultaneously could be complex and unstable. Therefore, researchers are continuously working to create a better and more stable version of GANs, for example, WGAN. Furthermore, different types of network architectures are introduced to improve the quality of outcomes. We will discuss this further in the upcoming blog about these variations.

References

[GPAM+14] Ian Goodfellow, Jean Pouget-Abadie, Mehdi Mirza, Bing Xu, DavidWarde-Farley, Sherjil
Ozair, Aaron Courville, and Yoshua Bengio. Generative adversarial nets. Advances in
neural information processing systems, 27, 2014.

[Gro20] Aditya Grover. Generative adversarial networks.
https://deepgenerativemodels.github.io/notes/gan/, 2020.

[KLA19] Tero Karras, Samuli Laine, and Timo Aila. A style-based generator architecture for
generative adversarial networks. In Proceedings of the IEEE/CVF conference on computer
vision and pattern recognition, pages 4401–4410, 2019.

[RMC15] Alec Radford, Luke Metz, and Soumith Chintala. Unsupervised representation
learning with deep convolutional generative adversarial networks. arXiv preprint
arXiv:1511.06434, 2015.

[Yad22a] Sunil Yadav. Deep generative modelling. https://data-scienceblog.
com/blog/2022/02/19/deep-generative-modelling/, 2022.

[Yad22b] Sunil Yadav. Necessary probability concepts for deep learning: Part 2.
https://medium.com/@sunil7545/kl-divergence-js-divergence-and-wasserstein-metricin-
deep-learning-995560752a53, 2022.

CCNA vs. CCNP vs. CCIE Security Certification

As more companies turn to cloud-based software and other advanced solutions, demand for expert IT professionals in the field increases. One popular vendor, Cisco Systems, Inc., makes underlying software and hardware businesses will use for their networks.

If you’re interested in pursuing a career in the data security industry, you may want to consider earning a Cisco security certification. However, there are many types of certificates available, and each one will deliver unique benefits to you and your job marketability.

Learn more about Cisco certifications and learn the difference between CCNA, CCNP and CCIE certifications to help you choose which path is right for you.

Why Earn Cisco Certifications?

The main reason why Cisco provides these security certifications is so IT professionals can fine-tune their skills and build upon their knowledge. When IT professionals earn a Cisco certification, they can use Cisco products and services more easily, help guide customers and troubleshoot customer problems.

A future employer may perceive candidates with certifications as more qualified, productive and someone with a “go-getter” attitude. According to Cisco’s website, 81% of employers associate certifications holders with higher quality and value of work contribution.

However, it’s important to research the various Cisco certifications to learn which ones are most suitable for you and what job you’re interested in. For example, Cisco offers different levels of certifications, ranging from entry-level to expert.

Below are three certifications from Cisco that may be a good fit for you.

CCNA — Cisco Certified Network Associate

A CCNA certification is highly sought after. This certification demonstrates a professional’s ability to install, configure, operate and troubleshoot networks, both routed and switched. No prerequisites are necessary for the CCNA certification. It’s considered an associate-level certification and is available in a few prominent areas, including:

  • Cloud
  • Collaboration
  • Industrial/IoT
  • Security
  • Routing and Switching
  • Service Provider
  • Wireless

One challenge in the data industry is the increased reliance on cloud environments. Using only one cloud provider is a business risk some companies are concerned about. Uptime Institute cites the concentration risk of cloud computing as a major challenge for data centers in 2022.

Earning a CCNA cloud certification may help you get hired for an entry-level position at a company and allow you to support a senior cloud engineer.

Common jobs that you can earn with a CCNA are an IT network engineer, associate networking engineer, network system administrator and cloud architecture and security professional.

CCNP — Cisco Certified Network Professional

The Cisco CCNP certification is a more advanced professional-level certification than the CCNA certification. With the CCNP, you should be able to implement higher-level networking solutions for a company. It will cover the fundamentals of LAN and WAN infrastructures. Here are some of the different areas you can earn a CCNP in:

  • Enterprise
  • Security
  • Service Provider
  • Collaboration
  • Data Center

You must pass some core exams before earning the CCNP certification. Someone looking for the CCNP certification must also qualify for Cisco’s IP switched network and IP routing technologies. This will help determine the candidate’s readiness for the CCNP certification.

Some jobs you may get with a CCNP certification are senior security/network engineer, network architecture, network manager and troubleshooting assistant.

CCIE — Cisco Certified Internetwork Expert

IT professionals who’ve secured the knowledge and technical skills to design, implement and configure security for Cisco solutions and IT resources would be ready to earn the CCIE certification. According to Cisco, an expert-level certification is accepted worldwide as the most prestigious certification in the tech industry. Here are some of the CCIE certifications:

  • Enterprise Infrastructure
  • Collaboration
  • Enterprise Wireless
  • Data Center
  • Security
  • Service Provider

CCIE certifications can open up a range of job opportunities, but it’s a challenging certification to earn. Earning a CCIE means that your end-to-end IT lifecycle skills are valid. You know exactly what you’re talking about regarding networking, LAN/WAN, IPv4 and IPv6 protocols, switches and routers, general information and installation and configuration of various network types.

Jobs you can earn with a CCIE certificate include network security architect, network security specialist, infrastructure consulting practitioner and cloud engineer/architect.

Where to Earn Cisco Certifications

Because Cisco certifications are in such high demand and can open up job opportunities, you may want to know how you can earn them. You earn certificates directly from Cisco’s website. Under Cisco’s Learn tab, there’s plenty of information about certifications, training, events, webinars, support and other services.

There are many online training programs that you can complete to help you prepare for the Cisco certification exams. Here are some websites that offer programs you may want to explore based on the certification you’d like to earn:

For CCNA

  • Udemy
  • ICOHS College
  • Pluralsight
  • Cybrary

For CCNP

  • Udemy
  • INE
  • Global Knowledge
  • Varsity Tutors

For CCIE

  • Udemy
  • Skillshare
  • PluralSight
  • Network Lessons
  • Koenig solutions

These examples are only a few, as other online training programs and resources can set you up for success.

Additionally, Cisco offers several resources on its website to help individuals prepare for certification exams. These include guided study groups and a free Cisco Networking Academy program.

Earning Cisco Certifications

Because many companies, especially large ones, will use Cisco products for their technology infrastructure. Potential IT candidates who list certifications on their resume or job application will have a competitive advantage in the hiring process.

Depending on your current skill level and knowledge, you should be able to determine which Cisco certification is right for you. Cisco’s website has extensive information on each certificate and what topics you’ll learn about. Consider earning a Cisco certification, whether it’s CCNA vs. CCNP vs. CCIE, to bolster your skills and improve your marketability.

Automated product quality monitoring using artificial intelligence deep learning

How to maintain product quality with deep learning

Deep Learning helps companies to automate operative processes in many areas. Industrial companies in particular also benefit from product quality assurance by automated failure and defect detection. Computer Vision enables automation to identify scratches and cracks on product item surfaces. You will find more information about how this works in the following infografic from DATANOMIQ and pixolution you can download using the link below.

How to maintain product quality with automatic defect detection - Infographic

How to maintain product quality with automatic defect detection – Infographic

Understanding Linear Regression with all Statistical Terms

Linear Regression Model – This article is about understanding the linear regression with all the statistical terms.

What is Regression Analysis?

regression is an attempt to determine the relationship between one dependent and a series of other independent variables.

Regression analysis is a form of predictive modelling technique which investigates the relationship between a dependent (target) and independent variable (s) (predictor). This technique is used for forecasting, time series modelling and finding the causal effect relationship between the variables. For example, relationship between rash driving and number of road accidents by a driver is best studied through regression.

Why do we use Regression Analysis?

As mentioned above, regression analysis estimates the relationship between two or more variables. Let’s understand this with an easy example:

Let’s say, you want to estimate growth in sales of a company based on current economic conditions. You have the recent company data which indicates that the growth in sales is around two and a half times the growth in the economy. Using this insight, we can predict future sales of the company based on current & past information.

There are multiple benefits of using regression analysis. They are as follows:

It indicates the significant relationships between dependent variable and independent variable. It indicates the strength of impact of multiple independent variables on a dependent variable. Regression analysis also allows us to compare the effects of variables measured on different scales, such as the effect of price changes and the number of promotional activities. These benefits help market researchers / data analysts / data scientists to eliminate and evaluate the best set of variables to be used for building predictive models.

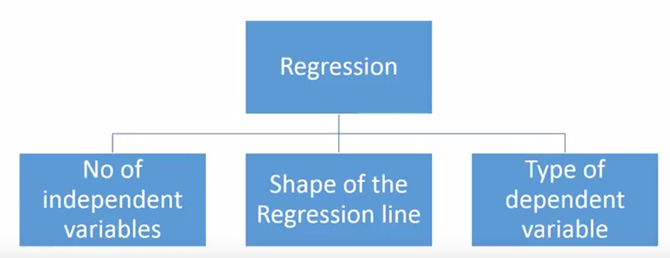
There are various kinds of regression techniques available to make predictions. These techniques are mostly driven by three metrics (number of independent variables, type of dependent variables and shape of regression line).

Number of independent variables, shape of regression line and type of dependent variable.

Number of independent variables, shape of regression line and type of dependent variable.

What is Linear Regression?

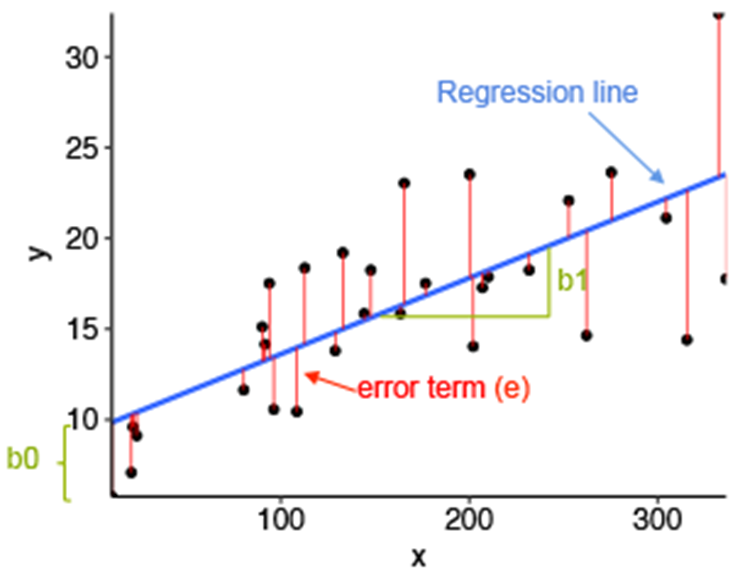
Linear Regression is the supervised Machine Learning model in which the model finds the best fit linear line between the independent and dependent variable i.e it finds the linear relationship between the dependent and independent variable.

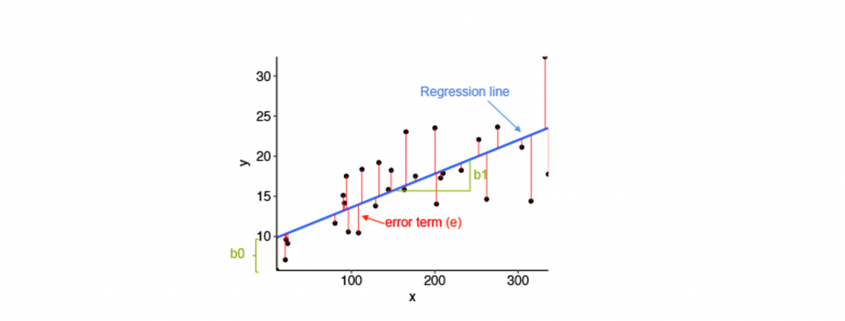
  • Equation of Simple Linear Regression, where bo is the intercept, b1 is coefficient or slope, x is the independent variable and y is the dependent variable.

Equation of Multiple Linear Regression, where bo is the intercept, b1,b2,b3,b4…,bn are coefficients or slopes of the independent variables x1,x2,x3,x4…,xn and y is the y=b_0+b_1x_1+b_2x_2+…+b_nx_n dependent variable.

Linear regression and its error termin per value

Linear regression and its error termin per value

Mathematical Approach:

Residual/Error = Actual values – Predicted Values
Sum of Residuals/Errors = Sum(Actual- Predicted Values)
Square of Sum of Residuals/Errors = (Sum(Actual- Predicted Values))^2

\sum(e_i^2)=\sum(y_i-\hat{y_i})^2

Application of Linear Regression:

Real-world examples of linear regression models
  1. Businesses often use linear regression to understand the relationship between advertising spending and revenue.
  2. Medical researchers often use linear regression to understand the relationship between drug dosage and blood pressure of patients.
  3. Agricultural scientists often use linear regression to measure the effect of fertilizer and water on crop yields.
  4. Data scientists for professional sports teams often use linear regression to measure the effect that different training regimens have on player performance.
  5. Stock predictions: A lot of businesses use linear regression models to predict how stocks will perform in the future. This is done by analyzing past data on stock prices and trends to identify patterns.
  6. Predicting consumer behavior: Businesses can use linear regression to predict things like how much a customer is likely to spend. Regression models can also be used to predict consumer behavior. This can be helpful for things like targeted marketing and product development. For example, Walmart uses linear regression to predict what products will be popular in different regions of the country.

Assumptions of Linear Regression:

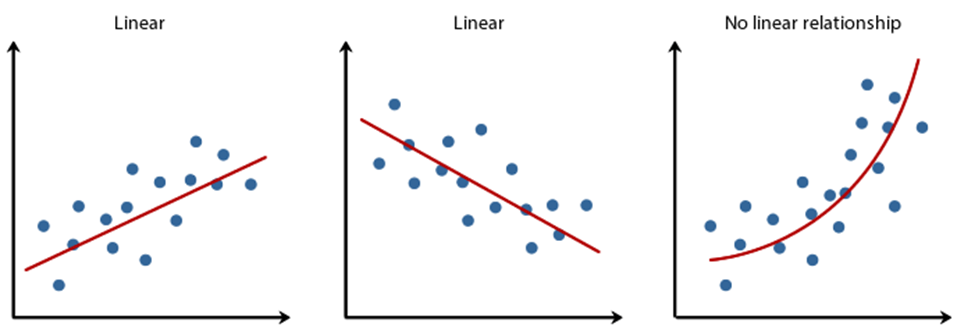
Linearity: It states that the dependent variable Y should be linearly related to independent variables. This assumption can be checked by plotting a scatter plot between both variables.

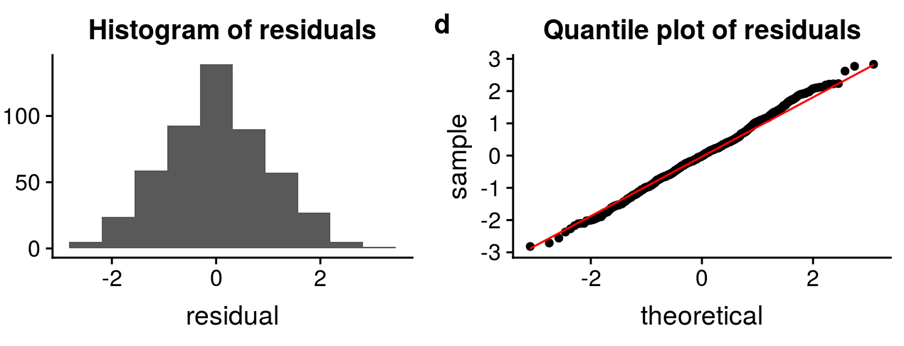
Normality: The X and Y variables should be normally distributed. Histograms, KDE plots, Q-Q plots can be used to check the Normality assumption.

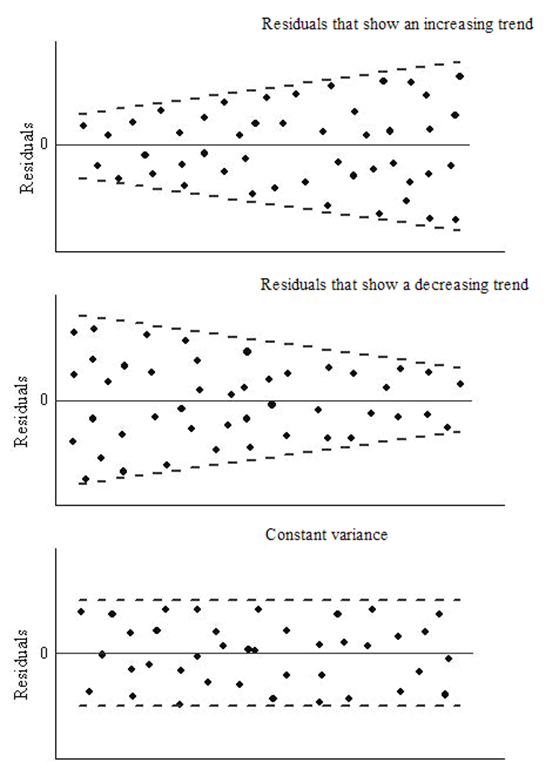
Homoscedasticity: The variance of the error terms should be constant i.e the spread of residuals should be constant for all values of X. This assumption can be checked by plotting a residual plot. If the assumption is violated then the points will form a funnel shape otherwise they will be constant.

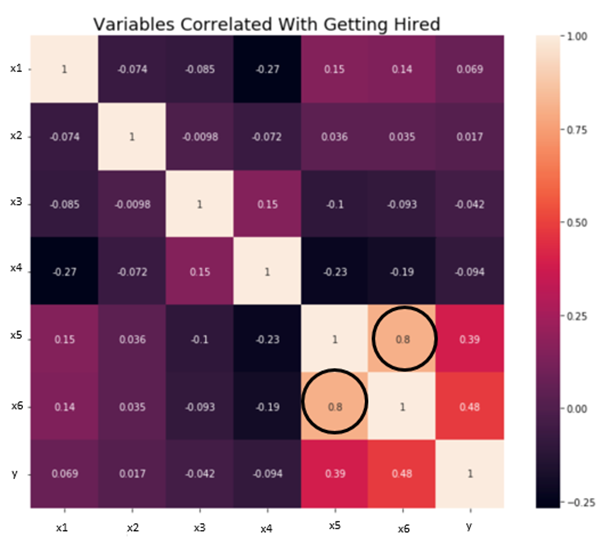
Independence/No Multicollinearity: The variables should be independent of each other i.e no correlation should be there between the independent variables. To check the assumption, we can use a correlation matrix or VIF score. If the VIF score is greater than 5 then the variables are highly correlated.

The error terms should be normally distributed. Q-Q plots and Histograms can be used to check the distribution of error terms.

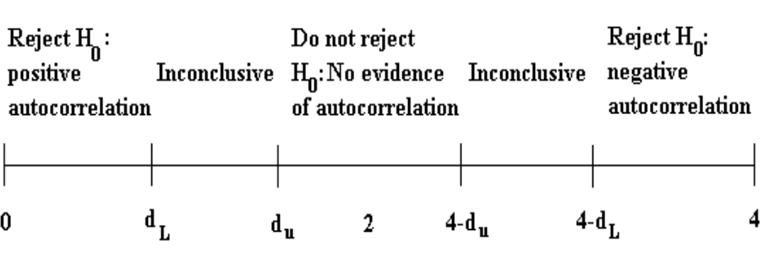
No Autocorrelation: The error terms should be independent of each other. Autocorrelation can be tested using the Durbin Watson test. The null hypothesis assumes that there is no autocorrelation. The value of the test lies between 0 to 4. If the value of the test is 2 then there is no autocorrelation.