
Understanding Linear Regression with all Statistical Terms
Linear Regression Model – This article is about understanding the linear regression with all the statistical terms.
What is Regression Analysis?
regression is an attempt to determine the relationship between one dependent and a series of other independent variables.
Regression analysis is a form of predictive modelling technique which investigates the relationship between a dependent (target) and independent variable (s) (predictor). This technique is used for forecasting, time series modelling and finding the causal effect relationship between the variables. For example, relationship between rash driving and number of road accidents by a driver is best studied through regression.
Why do we use Regression Analysis?
As mentioned above, regression analysis estimates the relationship between two or more variables. Let’s understand this with an easy example:
Let’s say, you want to estimate growth in sales of a company based on current economic conditions. You have the recent company data which indicates that the growth in sales is around two and a half times the growth in the economy. Using this insight, we can predict future sales of the company based on current & past information.
There are multiple benefits of using regression analysis. They are as follows:
It indicates the significant relationships between dependent variable and independent variable. It indicates the strength of impact of multiple independent variables on a dependent variable. Regression analysis also allows us to compare the effects of variables measured on different scales, such as the effect of price changes and the number of promotional activities. These benefits help market researchers / data analysts / data scientists to eliminate and evaluate the best set of variables to be used for building predictive models.
There are various kinds of regression techniques available to make predictions. These techniques are mostly driven by three metrics (number of independent variables, type of dependent variables and shape of regression line).
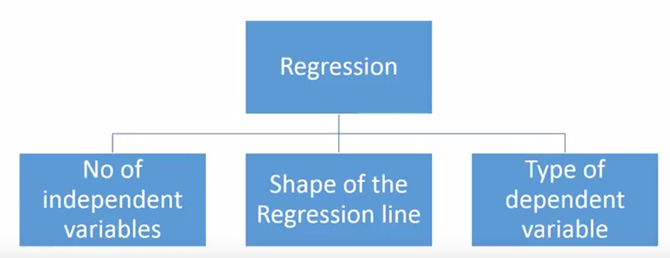
Number of independent variables, shape of regression line and type of dependent variable.
What is Linear Regression?
Linear Regression is the supervised Machine Learning model in which the model finds the best fit linear line between the independent and dependent variable i.e it finds the linear relationship between the dependent and independent variable.
- Equation of Simple Linear Regression, where bo is the intercept, b1 is coefficient or slope, x is the independent variable and y is the dependent variable.
Equation of Multiple Linear Regression, where bo is the intercept, b1,b2,b3,b4…,bn are coefficients or slopes of the independent variables x1,x2,x3,x4…,xn and y is the  dependent variable.
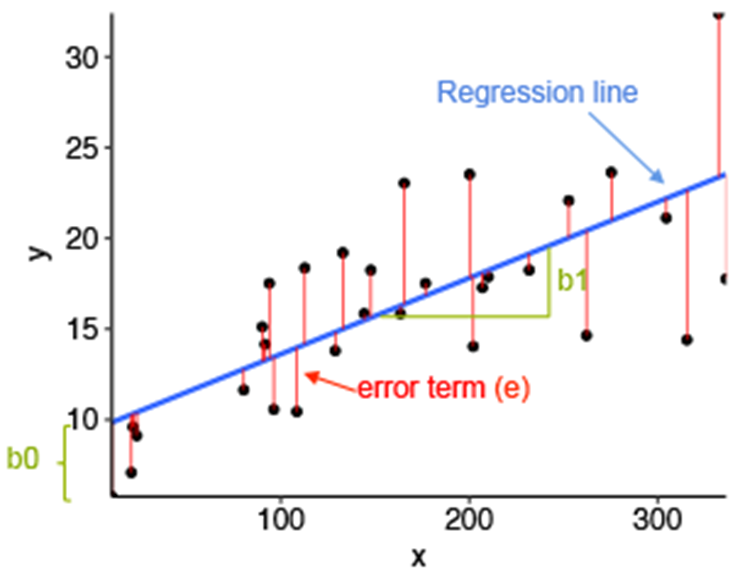
Linear regression and its error termin per value
Mathematical Approach:
Residual/Error = Actual values – Predicted Values
Sum of Residuals/Errors = Sum(Actual- Predicted Values)
Square of Sum of Residuals/Errors = (Sum(Actual- Predicted Values))^2

Application of Linear Regression:
Real-world examples of linear regression models
- Businesses often use linear regression to understand the relationship between advertising spending and revenue.
- Medical researchers often use linear regression to understand the relationship between drug dosage and blood pressure of patients.
- Agricultural scientists often use linear regression to measure the effect of fertilizer and water on crop yields.
- Data scientists for professional sports teams often use linear regression to measure the effect that different training regimens have on player performance.
- Stock predictions: A lot of businesses use linear regression models to predict how stocks will perform in the future. This is done by analyzing past data on stock prices and trends to identify patterns.
- Predicting consumer behavior: Businesses can use linear regression to predict things like how much a customer is likely to spend. Regression models can also be used to predict consumer behavior. This can be helpful for things like targeted marketing and product development. For example, Walmart uses linear regression to predict what products will be popular in different regions of the country.
Assumptions of Linear Regression:
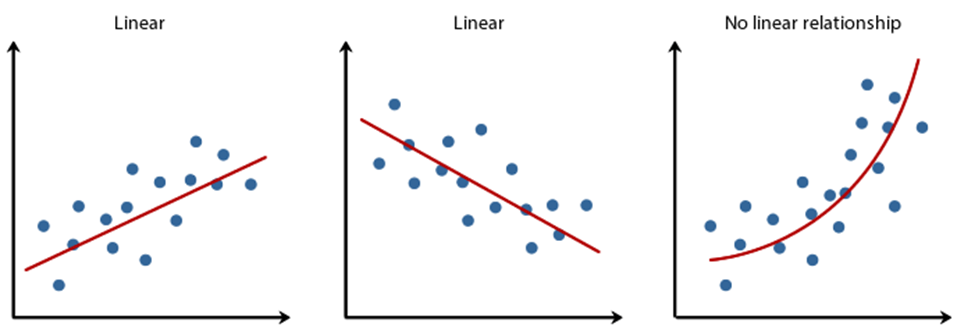
Linearity: It states that the dependent variable Y should be linearly related to independent variables. This assumption can be checked by plotting a scatter plot between both variables.
Normality: The X and Y variables should be normally distributed. Histograms, KDE plots, Q-Q plots can be used to check the Normality assumption.
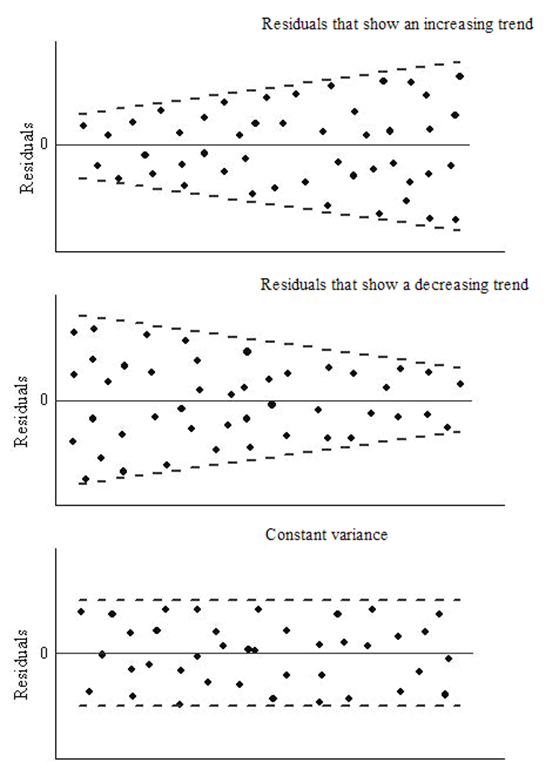
Homoscedasticity: The variance of the error terms should be constant i.e the spread of residuals should be constant for all values of X. This assumption can be checked by plotting a residual plot. If the assumption is violated then the points will form a funnel shape otherwise they will be constant.
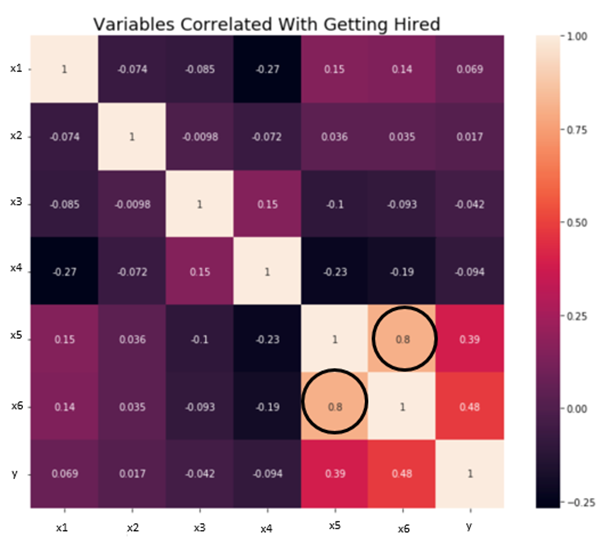
Independence/No Multicollinearity: The variables should be independent of each other i.e no correlation should be there between the independent variables. To check the assumption, we can use a correlation matrix or VIF score. If the VIF score is greater than 5 then the variables are highly correlated.
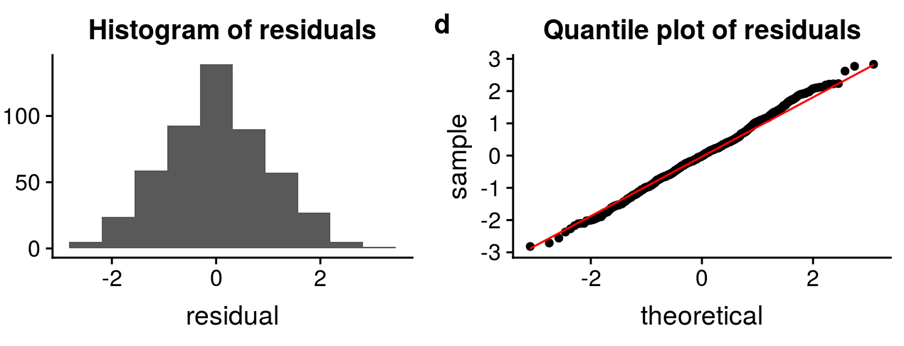
The error terms should be normally distributed. Q-Q plots and Histograms can be used to check the distribution of error terms.
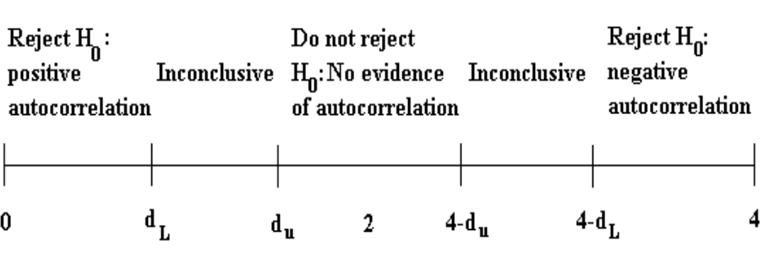
No Autocorrelation: The error terms should be independent of each other. Autocorrelation can be tested using the Durbin Watson test. The null hypothesis assumes that there is no autocorrelation. The value of the test lies between 0 to 4. If the value of the test is 2 then there is no autocorrelation.


Leave a Reply
Want to join the discussion?Feel free to contribute!