How Do Various Actor-Critic Based Deep Reinforcement Learning Algorithms Perform on Stock Trading?

Deep Reinforcement Learning for Automated Stock Trading: An Ensemble Strategy

Abstract

Deep Reinforcement Learning (DRL) is a blooming field famous for addressing a wide scope of complex decision-making tasks. This article would introduce and summarize the paper “Deep Reinforcement Learning for Automated Stock Trading: An Ensemble Strategy”, and discuss how these actor-critic based DRL learning algorithms, Proximal Policy Optimization (PPO), Advantage Actor Critic (A2C), and Deep Deterministic Policy Gradient (DDPG), act to accomplish automated stock trading by boosting investment return.

1 Motivation and Related Technology

It has long been challenging to design a comprehensive strategy for capital allocation optimization in a complex and dynamic stock market. With development of Artificial Intelligence, machine learning coupled with fundamentals analysis and alternative data has been in trend and provides better performance than conventional methodologies. Reinforcement Learning (RL) as a branch of it, is able to learn from interactions with environment, during which the agent continuously absorbs information, takes actions, and learns to improve its policy regarding rewards or losses obtained. On top of that, DRL utilizes neural networks as function approximators to approximate the Q-value (the expected reward of each action) in RL, which in return adjusts RL for large-scale data learning.

In DRL, the critic-only approach is capable for solving discrete action space problems, calculating Q-value to learn the optimal action-selection policy. On the other side, the actor-only approach, used in continuous action space environments, directly learns the optimal policy itself. Combining both, the actor-critic algorithm simultaneously updates the actor network representing the policy, and critic network representing the value function. The critic estimates the value function, while the actor updates the policy guided by the critic with policy gradients.

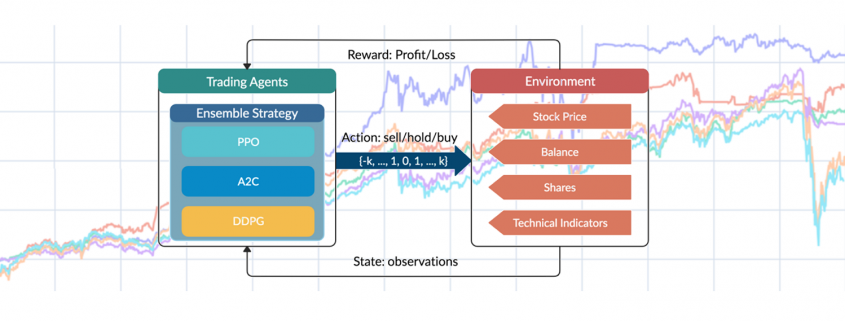
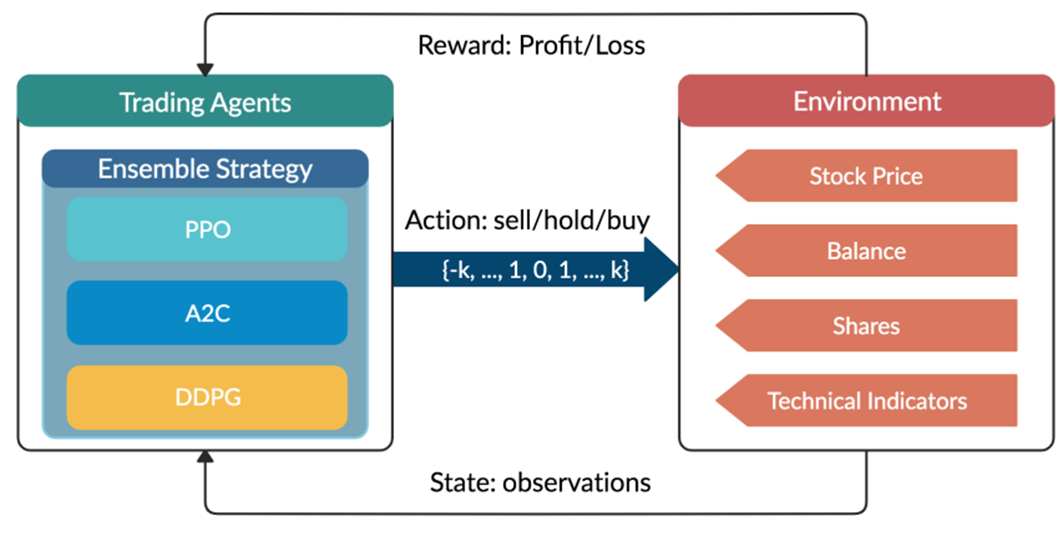
Overview of reinforcement learning-based stock theory.

Figure 1: Overview of reinforcement learning-based stock theory.

2 Mathematical Modeling

2.1 Stock Trading Simulation

Given the stochastic nature of stock market, the trading process is modeled as a Markov Decision Process (MDP) as follows:

  • State s = [p, h, b]: a vector describing the current state of the portfolio consists of D stocks, includes stock prices vector p, the stock shares vector h, and the remaining balance b.
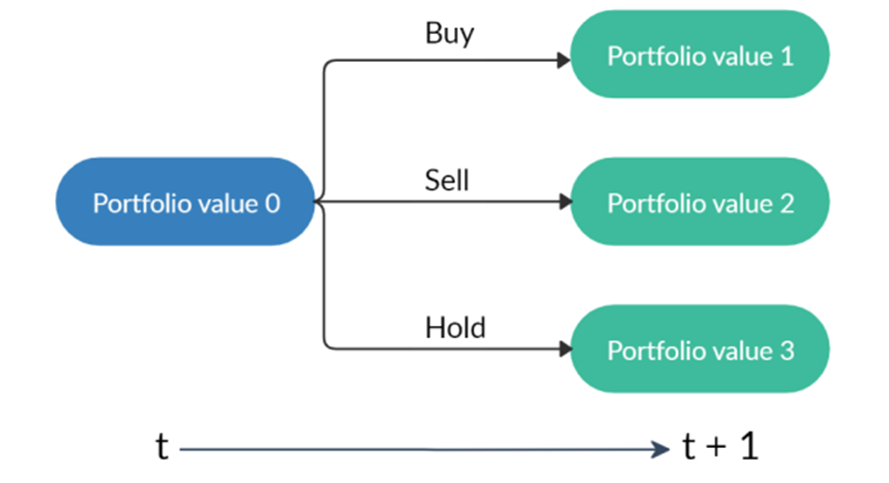
  • Action a: a vector of actions which are selling, buying, or holding (Fig.2), resulting in decreasing, increasing, and no change of shares h, respectively. The number of shares been transacted is recorded as k.
  • Reward r(s, a, s’): the reward of taking action a at state s and arriving at the new state s’.
  • Policy π(s): the trading strategy at state s, which is the probability distribution of actions.
  • Q-value : the expected reward of taking action a at state s following policy π.
A starting portfolio value with three actions result in three possible portfolios.

A starting portfolio value with three actions result in three possible portfolios. Note that “hold” may lead to different portfolio values due to the changing stock prices.

Besides, several assumptions and constraints are proposed for practice:

  • Market liquidity: the orders are rapidly executed at close prices.
  • Nonnegative balance: the balance at time t+1 after taking actions at t, equals to the original balance plus the proceeds of selling minus the spendings of buying:
  • Transaction cost: assume the transaction costs to be 0.1% of the value of each trade:
  • Risk-aversion: to control the risk of stock market crash caused by major emergencies, the financial turbulence index that measures extreme asset price movements is introduced:

    where  denotes the stock returns, µ and Σ are respectively the average and covariance of historical returns. When  exceeds a threshold, buying will be halted and the agent sells all shares. Trading will be resumed once  returns to normal level.

2.2 Trading Goal: Return Maximation

The goal is to design a trading strategy that raises agent’s total cumulative compensation given by the reward function:

and then considering the transition of the shares and the balance defined as:

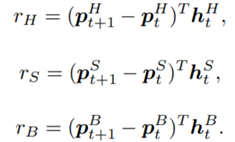
the reward can be further decomposed:

where:

At inception, h and Q_{\pi}(s,a) are initialized to 0, while the policy π(s) is uniformly distributed among all actions. Afterwards, everything is updated through interacting with the stock market environment. By the Bellman Equation, Q_{\pi}(s_t, a_t) is the expectation of the sum of direct reward r(s_t,a_t,s_{t+1} and the future reqard Q_{\pi}(s{t+1}, a_{a+1}) at the next state discounted by a factor γ, resulting in the state-action value function:

2.3 Environment for Multiple Stocks

OpenAI gym is used to implement the multiple stocks trading environment and to train the agent.

  1. State Space: a vector [b_t, p_t, h_t, M_t, R_t, C_t, X_t] storing information about
    b_t: Portfolio balance
    p_t: Adjusted close prices
    h_t: Shares owned of each stock
    M_t: Moving Average Convergence Divergence
    R_t: Relative Strength Index
    C_t: Commodity Channel Index
    X_t: Average Directional Index
  2. Action Space: {−k, …, −1, 0, 1, …, k} for a single stock, whose elements representing the number of shares to buy or sell. The action space is then normalized to [−1, 1], since A2C and PPO are defined directly on a Gaussian distribution.
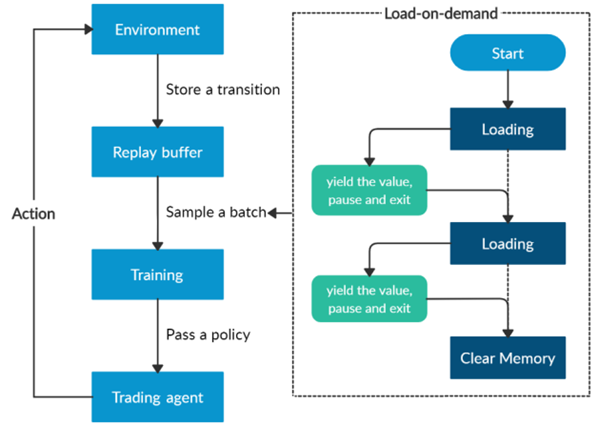
Overview of the load-on-demand technique.

Overview of the load-on-demand technique.

Furthermore, a load-on-demand technique is applied for efficient use of memory as shown above.

  1. Algorithms Selection

This paper mainly uses the following three actor-critic algorithms:

  • A2C: uses parallel copies of the same agent to update gradients for different data samples, and a coordinator to pass the average gradients over all agents to a global network, which can update the actor and the critic network, with the objective function:
  • where \pi_{\theta}(a_t|s_t) is the policy network, and A(S_t|a_t) is the advantage function to reduce the high variance of it:
  • V(S_t)is the value function of state S_t, regardless of actions. DDPG: combines the frameworks of Q-learning and policy gradients and uses neural networks as function approximators; it learns directly from the observations through policy gradient and deterministically map states to actions. The Q-value is updated by:
    Critic network is then updated by minimizing the loss function:
  • PPO: controls the policy gradient update to ensure that the new policy does not differ too much from the previous policy, with the estimated advantage function and a probability ratio:

    The clipped surrogate objective function:

    takes the minimum of the clipped and normal objective to restrict the policy update at each step and improve the stability of the policy.

An ensemble strategy is finally proposed to combine the three agents together to build a robust trading strategy. After training and testing the three agents concurrently, in the trading stage, the agent with the highest Sharpe ratio in one period will be automatically selected to use in the next period.

  1. Implementation: Training and Validation

The historical daily trading data comes from the 30 DJIA constituent stocks.

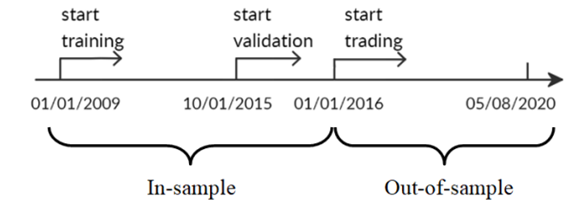
Stock data splitting in-sample and out-of-sample

Stock data splitting in-sample and out-of-sample.

  • In-sample training stage: data from 01/01/2009 – 09/30/2015 used to train 3 agents using PPO, A2C, and DDPG;
  • In-sample validation stage: data from 10/01/2015 – 12/31/2015 used to validate the 3 agents by 5 metrics: cumulative return, annualized return, annualized volatility, Sharpe ratio, and max drawdown; tune key parameters like learning rate and number of episodes;
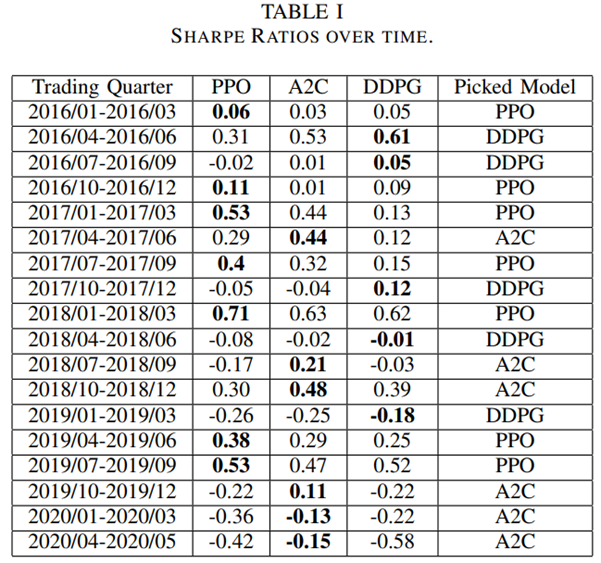
  • Out-of-sample trading stage: unseen data from 01/01/2016 – 05/08/2020 to evaluate the profitability of algorithms while continuing training. In each quarter, the agent with the highest Sharpe ratio is selected to act in the next quarter, as shown below.

    Table 1 - Sharpe Ratios over time.

    Table 1 – Sharpe Ratios over time.

  1. Results Analysis and Conclusion

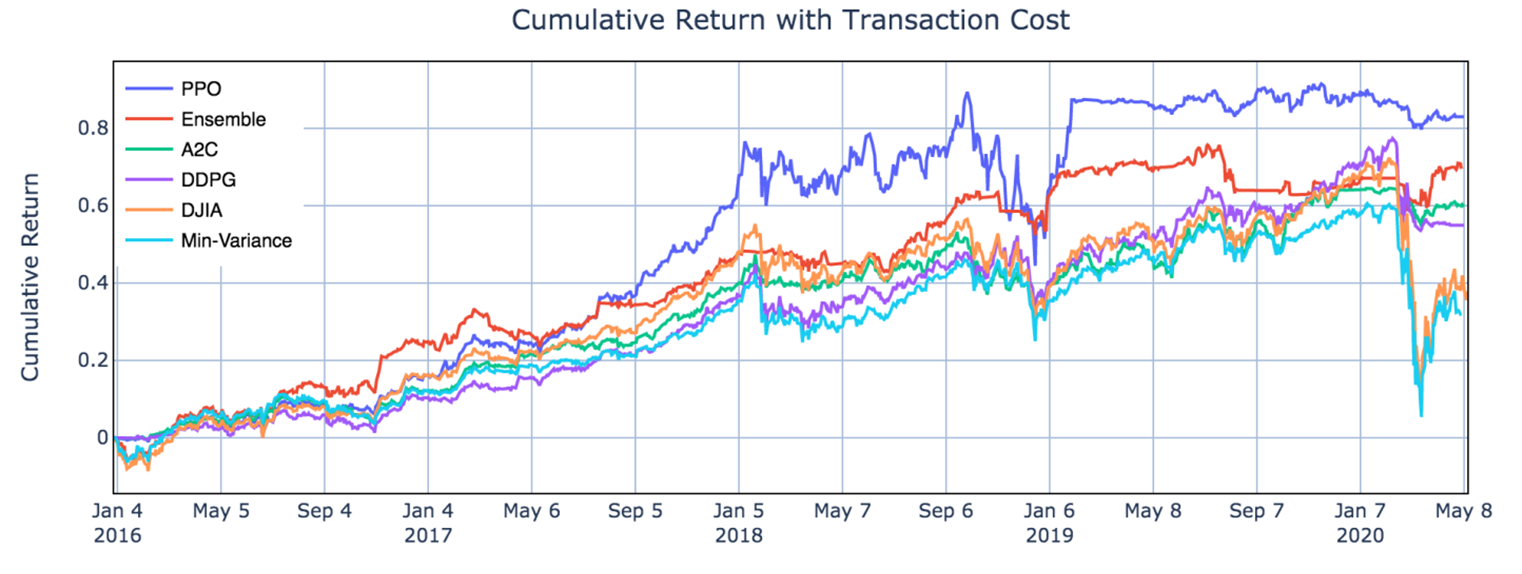
From Table II and Fig.5, one can notice that PPO agent is good at following trend and performs well in chasing for returns, with the highest cumulative return 83.0% and annual return 15.0% among the three agents, indicating its appropriateness in a bullish market. A2C agent is more adaptive to handle risk, with the lowest annual volatility 10.4% and max drawdown −10.2%, suggesting its capability in a bearish market. DDPG generates the lowest return among the three, but works fine under risk, with lower annual volatility and max drawdown than PPO. Apparently all three agents outperform the two benchmarks.

Table 2 - Performance Evaluation Comparison.

Table 2 – Performance Evaluation Comparison.

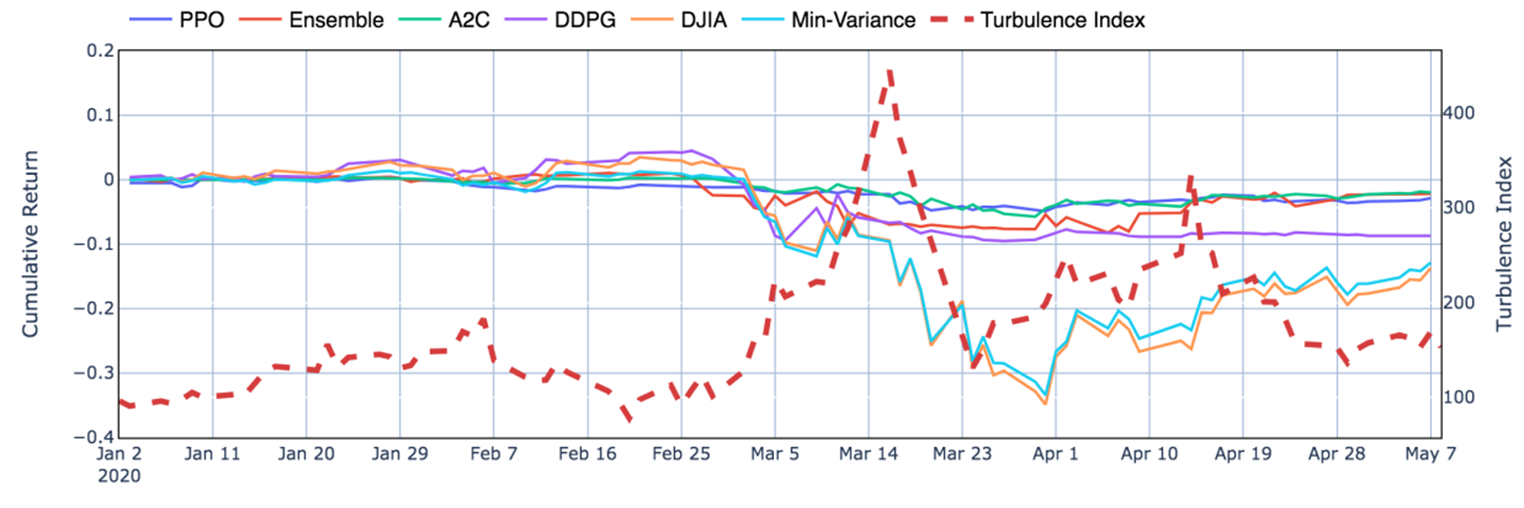
Moreover, it is obvious in Fig.6 that the ensemble strategy and the three agents act well during the 2020 stock market crash, when the agents successfully stops trading, thus cutting losses.

Performance during the stock market crash in the first quarter of 2020.

Performance during the stock market crash in the first quarter of 2020.

From the results, the ensemble strategy demonstrates satisfactory returns and lowest volatilities. Although its cumulative returns are lower than PPO, it has achieved the highest Sharpe ratio 1.30 among all strategies. It is reasonable that the ensemble strategy indeed performs better than the individual algorithms and baselines, since it works in a way each elemental algorithm is supplementary to others while balancing risk and return.

For further improvement, it will be inspiring to explore more models such as Asynchronous Advantage Actor-Critic (A3C) or Twin Delayed DDPG (TD3), and to take more fundamental analysis indicators or ESG factors into consideration. While more sophisticated models and larger datasets are adopted, improvement of efficiency may also be a challenge.

Automated product quality monitoring using artificial intelligence deep learning

How to maintain product quality with deep learning

Deep Learning helps companies to automate operative processes in many areas. Industrial companies in particular also benefit from product quality assurance by automated failure and defect detection. Computer Vision enables automation to identify scratches and cracks on product item surfaces. You will find more information about how this works in the following infografic from DATANOMIQ and pixolution you can download using the link below.

How to maintain product quality with automatic defect detection - Infographic

How to maintain product quality with automatic defect detection – Infographic

Leveraging Data Science for Vaccine Access and Administration

As people across the world become eligible for receiving their doses, governments and pharmaceutical companies must act efficiently to provide those vaccines. Alongside distribution, people need more information about these newer vaccines. As a solution for both of these obstacles, data science is a useful tool for vaccine development, distribution, and access throughout the COVID-19 pandemic.

From the initial stages of social distancing and vaccine development to broadening access to the vaccines, data science uses information from countless resources to provide evidence-based, actionable recommendations. Governments and health care providers then act upon this data to help the public and move towards the global goal of eliminating the virus.

Vaccine Development

Since the pandemic began, vaccines have been a sign of hope and a return to a new normalcy. However, getting to effective vaccine distribution first required using data science to develop the doses themselves.

The COVID-19 vaccines have been some of the fastest-developed inoculations in history, which is partly because of the efforts of data scientists. Using machine learning, researchers were able to analyze the sequences of strains of the virus and establish what parts a vaccine would best respond to. Specifically, the sequences had to be those that would be less likely to mutate in the future and less likely to cause an adverse reaction in humans with an injection.

Machine learning helped scientists predict and theorize about which proteins would be the best to work within the SARS-CoV-2 strains. From there, they proceeded with creating vaccines that are now in use all over the world, like Pfizer’s or Moderna’s.

Then, as vaccines become more available, governments again rely on data science to dictate eligibility. Data analytics systems take into account exposure risk, demographics, jobs, and health conditions, which have helped countries break up eligibility into phases.

Supply and Demand

Vaccine supply chains had rocky beginnings throughout the world. In Germany, residents faced shortages of doses, where demand far outweighed the available vials. This type of shortage is especially dangerous, as it can lead to an increase in cases or a full-on spike.

To avoid these uneven dynamics, data science can provide more accurate projections of how many vaccines regions will need on a weekly basis. Data science systems that use machine learning can account for the population that’s eligible and historical COVID-19 vaccination numbers. Then, as eligibility opens up, these systems predict how many vaccines a facility or county will need in the future.

Vaccine administrative organizations can then communicate better with the government to request the doses they will properly handle and use weekly.

In the United States, West Virginia is working with data science dashboards to identify who is most at risk of contracting the virus. Then, they can request the right amount of vials each week and give them to the people who need them the most.

Information Access

As new vaccines and government mandates come into play, residents all over the world need more information to feel safe and to know what they should do. Vaccine scams, for example, have increased with distribution. These scams will ask for personal information like a Social Security number or a form of payment.

To avoid these scams and learn about the vaccine options available, the public needs more access to information. Data science is again helpful to distribute this information.

Google has become a leader in information access with its Intelligence Vaccine Impact initiative. With this program, Google uses machine learning and artificial intelligence (AI) to process data regarding government policy changes, vaccine availability, eligibility, and demographics. That way, people know when they can receive a vaccine, the research and information that supports the vaccines, and what scams to avoid along the way.

Then, based on the vaccine information Google gathers, data scientists can provide a clearer trajectory of the pandemic globally and locally as vaccines help cases go down.

A Data-Driven Path Forward

Data science provides solutions for vaccine access, distribution, and administration. With these powerful dynamics in place, it’s clear that data will lead the world towards a healthier future. Based on evidence from the pandemic, data helps governments and health care providers offer the best solutions for eliminating the virus and protecting people everywhere.

5 AI Tricks to Grow Your Online Sales

The way people shop is currently changing. This only means that online stores need optimization to stay competitive and answer to the needs of customers. In this post, we’ll bring up the five ways in which you can use artificial intelligence technology in an online store to grow your revenues. Let’s begin!

1. Personalization with AI

Opening the list of AI trends that are certainly worth covering deals with a step up in personalization. Did you know that according to the results of a survey that was held by Accenture, more than 90% of shoppers are likelier to buy things from those stores and brands that propose suitable product recommendations?

This is exactly where artificial intelligence can give you a big hand. Such progressive technology analyzes the behavior of your consumers individually, keeping in mind their browsing and purchasing history. After collecting all the data, AI draws the necessary conclusions and offers those product recommendations that the user might like.

Look at the example below with the block has a carousel of neat product options. Obviously, this “move” can give a big boost to the average cart sizes.

Screenshot taken on the official Reebok website

Screenshot taken on the official Reebok website

2. Smarter Search Options

With the rise of the popularity of AI voice assistants and the leap in technology in general, the way people look for things on the web has changed. Everything is moving towards saving time and getting faster better results.

One of such trends deals with embracing the text to speech and image search technology. Did you notice how many search bars have “microphone icons” for talking out your request?

On a similar note, numerous sites have made a big jump forward after incorporating search by picture. In this case, uploaded photos get analyzed by artificial intelligence technology. The system studies what’s depicted on the image and cross-checks it with the products sold in the store. In several seconds the user is provided with a selection of similar products.

Without any doubt, this greatly helps users find what they were looking for faster. As you might have guessed, this is a time-saving feature. In essence, this omits the necessity to open dozens of product pages on multiple sites when seeking out a liked item that they’ve taken a screenshot or photo of.

Check out how such a feature works on the official Amazon website by taking a look at the screenshots of StyleSnap provided below.

Screenshot taken on the official Amazon StyleSnap website

Screenshot taken on the official Amazon StyleSnap website

3. Assisting Clients via Chatbots

The next point on the list is devoted to AI chatbots. This feature can be a real magic wand with client support which is also beneficial for online sales.

Real customer support specialists usually aren’t available 24/7. And keeping in mind that most requests are on repetitive topics, having a chatbot instantly handle many of the questions is a neat way to “unload” the work of humans.

Such chatbots use machine learning to get better at understanding and processing client queries. How do they work? They’re “taught” via scripts and scenario schemes. Therefore, the more data you supply them with, the more matters they’ll be able to cover.

Case in point, there’s such a chat available on the official Victoria’s Secret website. If the user launches the Digital Assistant, the messenger bot starts the conversation. Based on the selected topic the user selects from the options, the bot defines what will be discussed.

Screenshot taken on the official Victoria’s Secret website

Screenshot taken on the official Victoria’s Secret website

4. Determining Top-Selling Product Combos

A similar AI use case for boosting online revenues to the one mentioned in the first point, it becomes much easier to cross-sell products when artificial intelligence “cracks” the actual top matches. Based on the findings by Sumo, you can boost your revenues by 10 to 30% if you upsell wisely!

The product database of online stores gets larger by the month, making it harder to know for good which items go well together and complement each other. With AI on your analytics team, you don’t have to scratch your head guessing which products people are likely to additionally buy along with the item they’re browsing at the moment. This work on singling out data can be done for you.

As seen on the screenshot from the official MAC Cosmetics website, the upselling section on the product page presents supplement items in a carousel. Thus, the chance of these products getting added to the shopping cart increases (if you compare it to the situation when the client would search the site and find these products by himself).

Screenshot taken on the official MAC Cosmetics website

Screenshot taken on the official MAC Cosmetics website

5. “Try It On” with a Camera

The fifth AI technology in this list is virtual try on that borrowed the power of augmented reality technology in the world of sales.

Especially for fields like cosmetics or accessories, it is important to find ways to help clients to make up their minds and encourage them to buy an item without testing it physically. If you want, you can play around with such real-time functionality and put on makeup using your camera on the official Maybelline New York site.

Consumers, ultimately, become happier because this solution omits frustration and unneeded doubts. With everything evident and clear, people don’t have the need to take a shot in the dark what will be a good match, they can see it.

Screenshot taken on the official Maybelline New York website

Screenshot taken on the official Maybelline New York website

In Closing

To conclude everything stated in this article, artificial intelligence is a big crunch point. Incorporating various AI-powered features into an online retail store can be a neat advancement leading to a visible growth in conversions.

Multi-head attention mechanism: “queries”, “keys”, and “values,” over and over again

This is the third article of my article series named “Instructions on Transformer for people outside NLP field, but with examples of NLP.”

In the last article, I explained how attention mechanism works in simple seq2seq models with RNNs, and it basically calculates correspondences of the hidden state at every time step, with all the outputs of the encoder. However I would say the attention mechanisms of RNN seq2seq models use only one standard for comparing them. Using only one standard is not enough for understanding languages, especially when you learn a foreign language. You would sometimes find it difficult to explain how to translate a word in your language to another language. Even if a pair of languages are very similar to each other, translating them cannot be simple switching of vocabulary. Usually a single token in one language is related to several tokens in the other language, and vice versa. How they correspond to each other depends on several criteria, for example “what”, “who”, “when”, “where”, “why”, and “how”. It is easy to imagine that you should compare tokens with several criteria.

Transformer model was first introduced in the original paper named “Attention Is All You Need,” and from the title you can easily see that attention mechanism plays important roles in this model. When you learn about Transformer model, you will see the figure below, which is used in the original paper on Transformer.  This is the simplified overall structure of one layer of Transformer model, and you stack this layer N times. In one layer of Transformer, there are three multi-head attention, which are displayed as boxes in orange. These are the very parts which compare the tokens on several standards. I made the head article of this article series inspired by this multi-head attention mechanism.
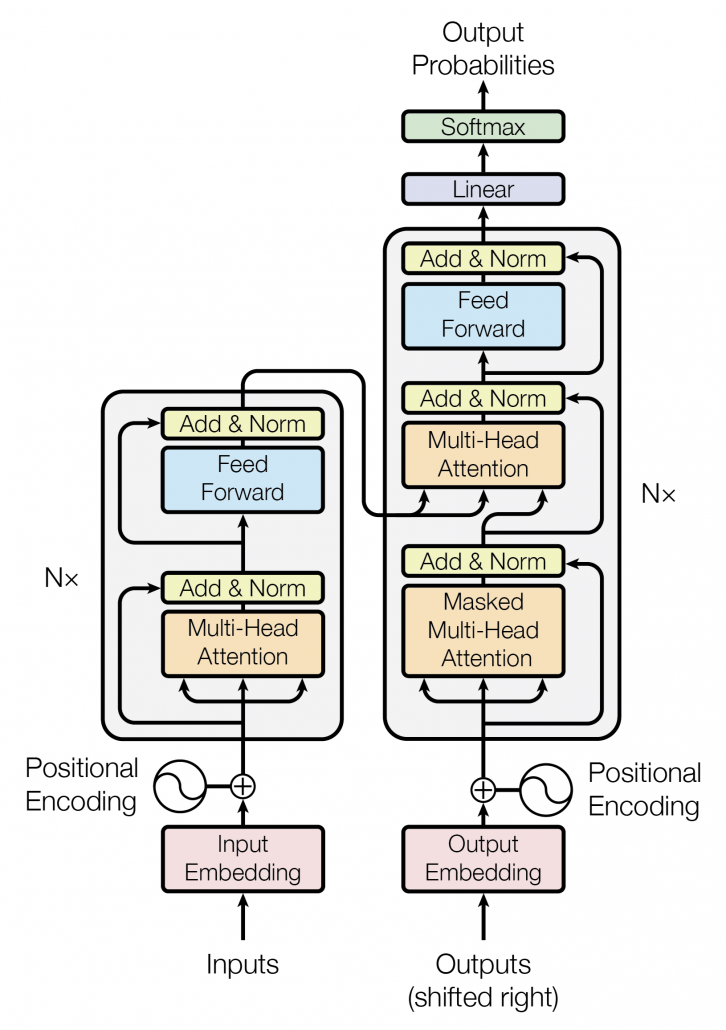
The figure below is also from the original paper on Transfromer. If you can understand how multi-head attention mechanism works with the explanations in the paper, and if you have no troubles understanding the codes in the official Tensorflow tutorial, I have to say this article is not for you. However I bet that is not true of majority of people, and at least I need one article to clearly explain how multi-head attention works. Please keep it in mind that this article covers only the architectures of the two figures below. However multi-head attention mechanisms are crucial components of Transformer model, and throughout this article, you would not only see how they work but also get a little control over it at an implementation level.
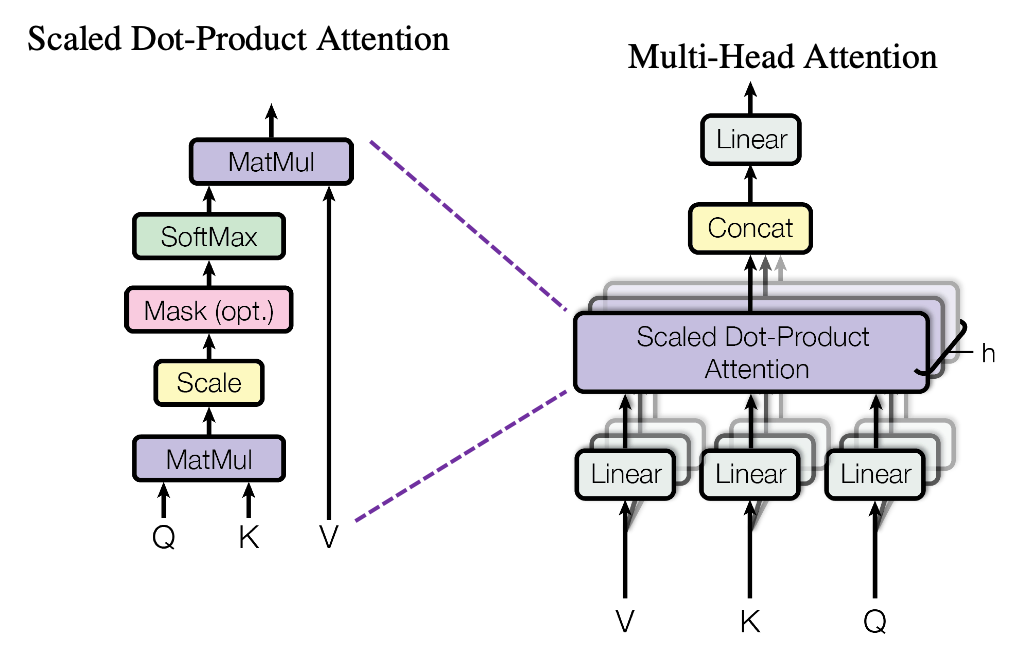
1 Multi-head attention mechanism

When you learn Transformer model, I recommend you first to pay attention to multi-head attention. And when you learn multi-head attentions, before seeing what scaled dot-product attention is, you should understand the whole structure of multi-head attention, which is at the right side of the figure above. In order to calculate attentions with a “query”, as I said in the last article, “you compare the ‘query’ with the ‘keys’ and get scores/weights for the ‘values.’ Each score/weight is in short the relevance between the ‘query’ and each ‘key’. And you reweight the ‘values’ with the scores/weights, and take the summation of the reweighted ‘values’.” Sooner or later, you will notice I would be just repeating these phrases over and over again throughout this article, in several ways.

*Even if you are not sure what “reweighting” means in this context, please keep reading. I think you would little by little see what it means especially in the next section.

The overall process of calculating multi-head attention, displayed in the figure above, is as follows (Please just keep reading. Please do not think too much.): first you split the V: “values”, K: “keys”, and Q: “queries”, and second you transform those divided “values”, “keys”, and “queries” with densely connected layers (“Linear” in the figure). Next you calculate attention weights and reweight the “values” and take the summation of the reiweighted “values”, and you concatenate the resulting summations. At the end you pass the concatenated “values” through another densely connected layers. The mechanism of scaled dot-product attention is just a matter of how to concretely calculate those attentions and reweight the “values”.
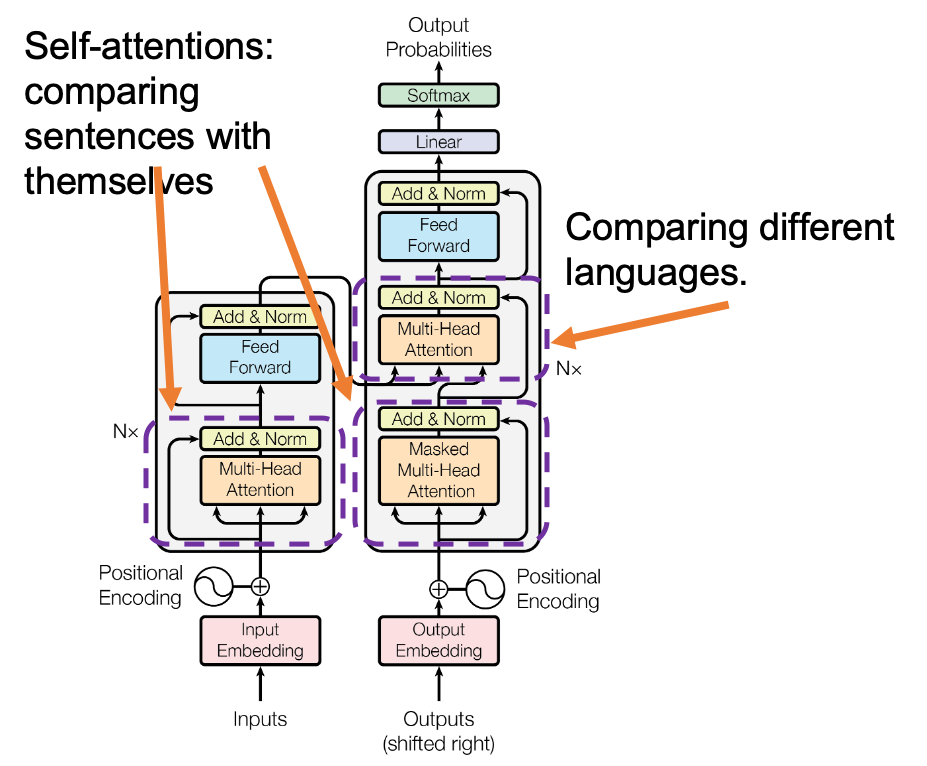
*In the last article I briefly mentioned that “keys” and “queries” can be in the same language. They can even be the same sentence in the same language, and in this case the resulting attentions are called self-attentions, which we are mainly going to see. I think most people calculate “self-attentions” unconsciously when they speak. You constantly care about what “she”, “it” , “the”, or “that” refers to in you own sentence, and we can say self-attention is how these everyday processes is implemented.

Let’s see the whole process of calculating multi-head attention at a little abstract level. From now on, we consider an example of calculating multi-head self-attentions, where the input is a sentence “Anthony Hopkins admired Michael Bay as a great director.” In this example, the number of tokens is 9, and each token is encoded as a 512-dimensional embedding vector. And the number of heads is 8. In this case, as you can see in the figure below, the input sentence “Anthony Hopkins admired Michael Bay as a great director.” is implemented as a 9\times 512 matrix. You first split each token into 512/8=64 dimensional, 8 vectors in total, as I colored in the figure below. In other words, the input matrix is divided into 8 colored chunks, which are all 9\times 64 matrices, but each colored matrix expresses the same sentence. And you calculate self-attentions of the input sentence independently in the 8 heads, and you reweight the “values” according to the attentions/weights. After this, you stack the sum of the reweighted “values”  in each colored head, and you concatenate the stacked tokens of each colored head. The size of each colored chunk does not change even after reweighting the tokens. According to Ashish Vaswani, who invented Transformer model, each head compare “queries” and “keys” on each standard. If the a Transformer model has 4 layers with 8-head multi-head attention , at least its encoder has 4\times 8 = 32 heads, so the encoder learn the relations of tokens of the input on 32 different standards.
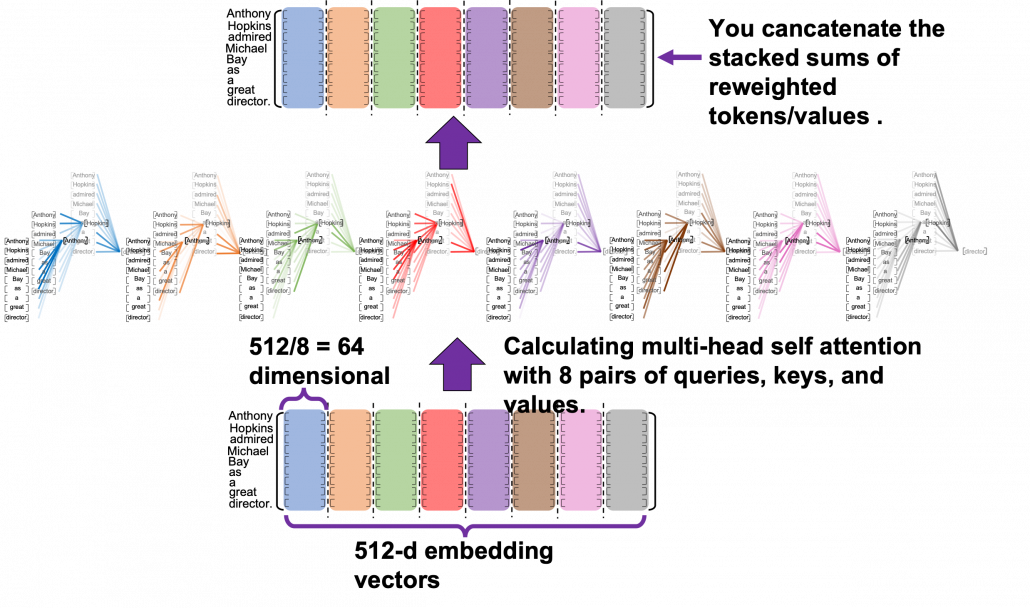
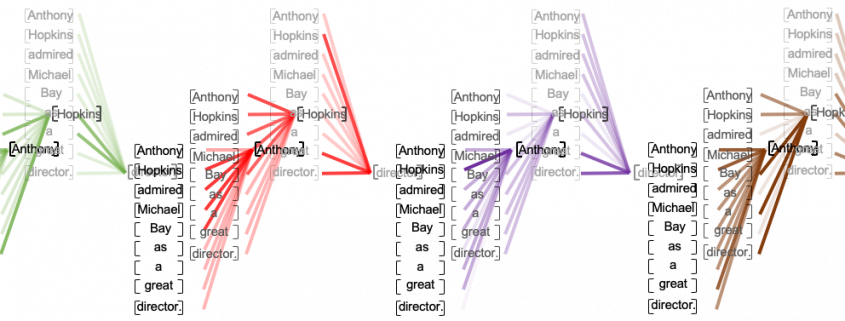
I think you now have rough insight into how you calculate multi-head attentions. In the next section I am going to explain the process of reweighting the tokens, that is, I am finally going to explain what those colorful lines in the head image of this article series are.

*Each head is randomly initialized, so they learn to compare tokens with different criteria. The standards might be straightforward like “what” or “who”, or maybe much more complicated. In attention mechanisms in deep learning, you do not need feature engineering for setting such standards.

2 Calculating attentions and reweighting “values”

If you have read the last article or if you understand attention mechanism to some extent, you should already know that attention mechanism calculates attentions, or relevance between “queries” and “keys.” In the last article, I showed the idea of weights as a histogram, and in that case the “query” was the hidden state of the decoder at every time step, whereas the “keys” were the outputs of the encoder. In this section, I am going to explain attention mechanism in a more abstract way, and we consider comparing more general “tokens”, rather than concrete outputs of certain networks. In this section each [ \cdots ] denotes a token, which is usually an embedding vector in practice.

Please remember this mantra of attention mechanism: “you compare the ‘query’ with the ‘keys’ and get scores/weights for the ‘values.’ Each score/weight is in short the relevance between the ‘query’ and each ‘key’. And you reweight the ‘values’ with the scores/weights, and take the summation of the reweighted ‘values’.” The figure below shows an overview of a case where “Michael” is a query. In this case you compare the query with the “keys”, that is, the input sentence “Anthony Hopkins admired Michael Bay as a great director.” and you get the histogram of attentions/weights. Importantly the sum of the weights 1. With the attentions you have just calculated, you can reweight the “values,” which also denote the same input sentence. After that you can finally take a summation of the reweighted values. And you use this summation.
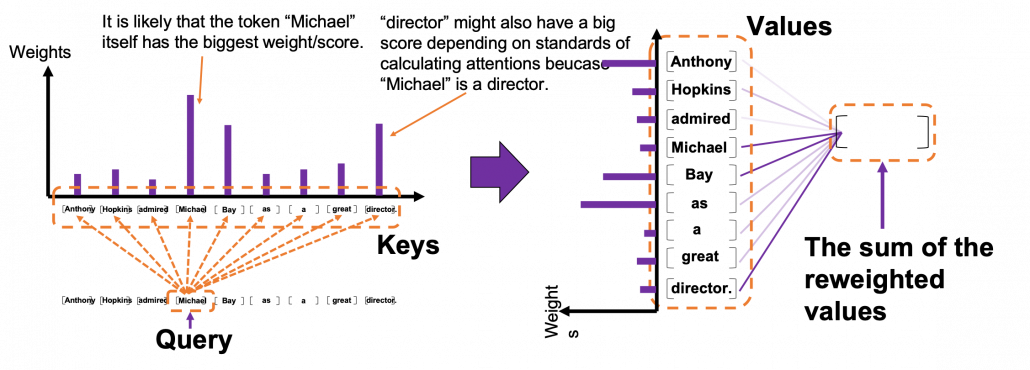
*I have been repeating the phrase “reweighting ‘values’  with attentions,”  but you in practice calculate the sum of those reweighted “values.”

Assume that compared to the “query”  token “Michael”, the weights of the “key” tokens “Anthony”, “Hopkins”, “admired”, “Michael”, “Bay”, “as”, “a”, “great”, and “director.” are respectively 0.06, 0.09, 0.05, 0.25, 0.18, 0.06, 0.09, 0.06, 0.15. In this case the sum of the reweighted token is 0.06″Anthony” + 0.09″Hopkins” + 0.05″admired” + 0.25″Michael” + 0.18″Bay” + 0.06″as” + 0.09″a” + 0.06″great” 0.15″director.”, and this sum is the what wee actually use.

*Of course the tokens are embedding vectors in practice. You calculate the reweighted vector in actual implementation.

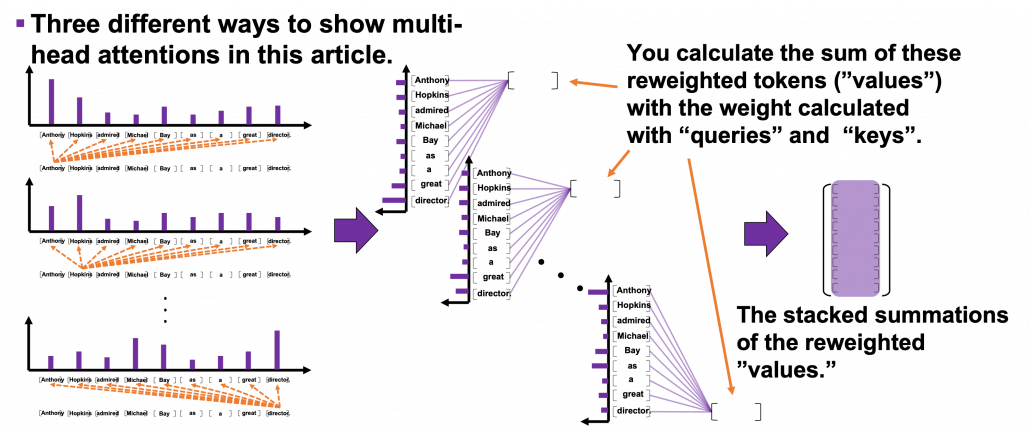
You repeat this process for all the “queries.”  As you can see in the figure below, you get summations of 9 pairs of reweighted “values” because you use every token of the input sentence “Anthony Hopkins admired Michael Bay as a great director.” as a “query.” You stack the sum of reweighted “values” like the matrix in purple in the figure below, and this is the output of a one head multi-head attention.
3 Scaled-dot product

This section is a only a matter of linear algebra. Maybe this is not even so sophisticated as linear algebra. You just have to do lots of Excel-like operations. A tutorial on Transformer by Jay Alammar is also a very nice study material to understand this topic with simpler examples. I tried my best so that you can clearly understand multi-head attention at a more mathematical level, and all you need to know in order to read this section is how to calculate products of matrices or vectors, which you would see in the first some pages of textbooks on linear algebra.

We have seen that in order to calculate multi-head attentions, we prepare 8 pairs of “queries”, “keys” , and “values”, which I showed in 8 different colors in the figure in the first section. We calculate attentions and reweight “values” independently in 8 different heads, and in each head the reweighted “values” are calculated with this very simple formula of scaled dot-product: Attention(\boldsymbol{Q}, \boldsymbol{K}, \boldsymbol{V}) =softmax(\frac{\boldsymbol{Q} \boldsymbol{K} ^T}{\sqrt{d}_k})\boldsymbol{V}. Let’s take an example of calculating a scaled dot-product in the blue head.

At the left side of the figure below is a figure from the original paper on Transformer, which explains one-head of multi-head attention. If you have read through this article so far, the figure at the right side would be more straightforward to understand. You divide the input sentence into 8 chunks of matrices, and you independently put those chunks into eight head. In one head, you convert the input matrix by three different fully connected layers, which is “Linear” in the figure below, and prepare three matrices Q, K, V, which are “queries”, “keys”, and “values” respectively.

*Whichever color attention heads are in, the processes are all the same.

*You divide \frac{\boldsymbol{Q} \boldsymbol{K}} ^T by \sqrt{d}_k in the formula. According to the original paper, it is known that re-scaling \frac{\boldsymbol{Q} \boldsymbol{K}} ^T by \sqrt{d}_k is found to be effective. I am not going to discuss why in this article.
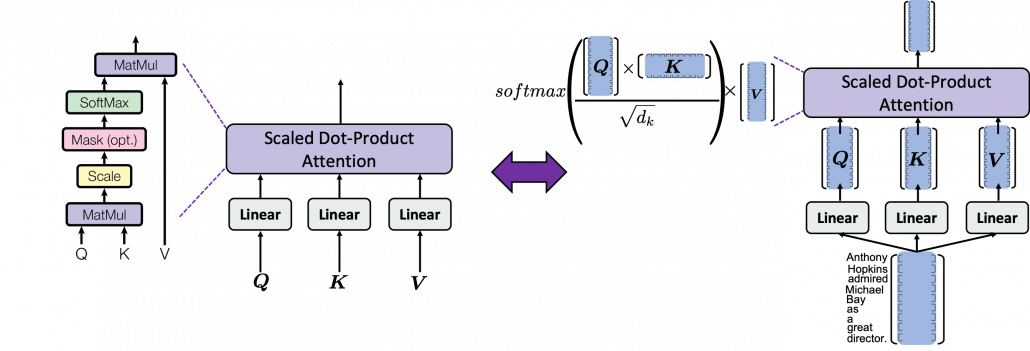
As you can see in the figure below, calculating Attention(\boldsymbol{Q}, \boldsymbol{K}, \boldsymbol{V}) is virtually just multiplying three matrices with the same size (Only K is transposed though). The resulting 9\times 64 matrix is the output of the head.

softmax(\frac{\boldsymbol{Q} \boldsymbol{K} ^T}{\sqrt{d}_k}) is calculated like in the figure below. The softmax function regularize each row of the re-scaled product \frac{\boldsymbol{Q} \boldsymbol{K} ^T}{\sqrt{d}_k}, and the resulting 9\times 9 matrix is a kind a heat map of self-attentions.

The process of comparing one “query” with “keys” is done with simple multiplication of a vector and a matrix, as you can see in the figure below. You can get a histogram of attentions for each query, and the resulting 9 dimensional vector is a list of attentions/weights, which is a list of blue circles in the figure below. That means, in Transformer model, you can compare a “query” and a “key” only by calculating an inner product. After re-scaling the vectors by dividing them with \sqrt{d_k} and regularizing them with a softmax function, you stack those vectors, and the stacked vectors is the heat map of attentions.

You can reweight “values” with the heat map of self-attentions, with simple multiplication. It would be more straightforward if you consider a transposed scaled dot-product \boldsymbol{V}^T \cdot softmax(\frac{\boldsymbol{Q} \boldsymbol{K} ^T}{\sqrt{d}_k})^T. This also should be easy to understand if you know basics of linear algebra.

One column of the resulting matrix (\boldsymbol{V}^T \cdot softmax(\frac{\boldsymbol{Q} \boldsymbol{K} ^T}{\sqrt{d}_k})^T) can be calculated with a simple multiplication of a matrix and a vector, as you can see in the figure below. This corresponds to the process or “taking a summation of reweighted ‘values’,” which I have been repeating. And I would like you to remember that you got those weights (blue) circles by comparing a “query” with “keys.”

Again and again, let’s repeat the mantra of attention mechanism together: “you compare the ‘query’ with the ‘keys’ and get scores/weights for the ‘values.’ Each score/weight is in short the relevance between the ‘query’ and each ‘key’. And you reweight the ‘values’ with the scores/weights, and take the summation of the reweighted ‘values’.” If you have been patient enough to follow my explanations, I bet you have got a clear view on how multi-head attention mechanism works.

We have been seeing the case of the blue head, but you can do exactly the same procedures in every head, at the same time, and this is what enables parallelization of multi-head attention mechanism. You concatenate the outputs of all the heads, and you put the concatenated matrix through a fully connected layers.
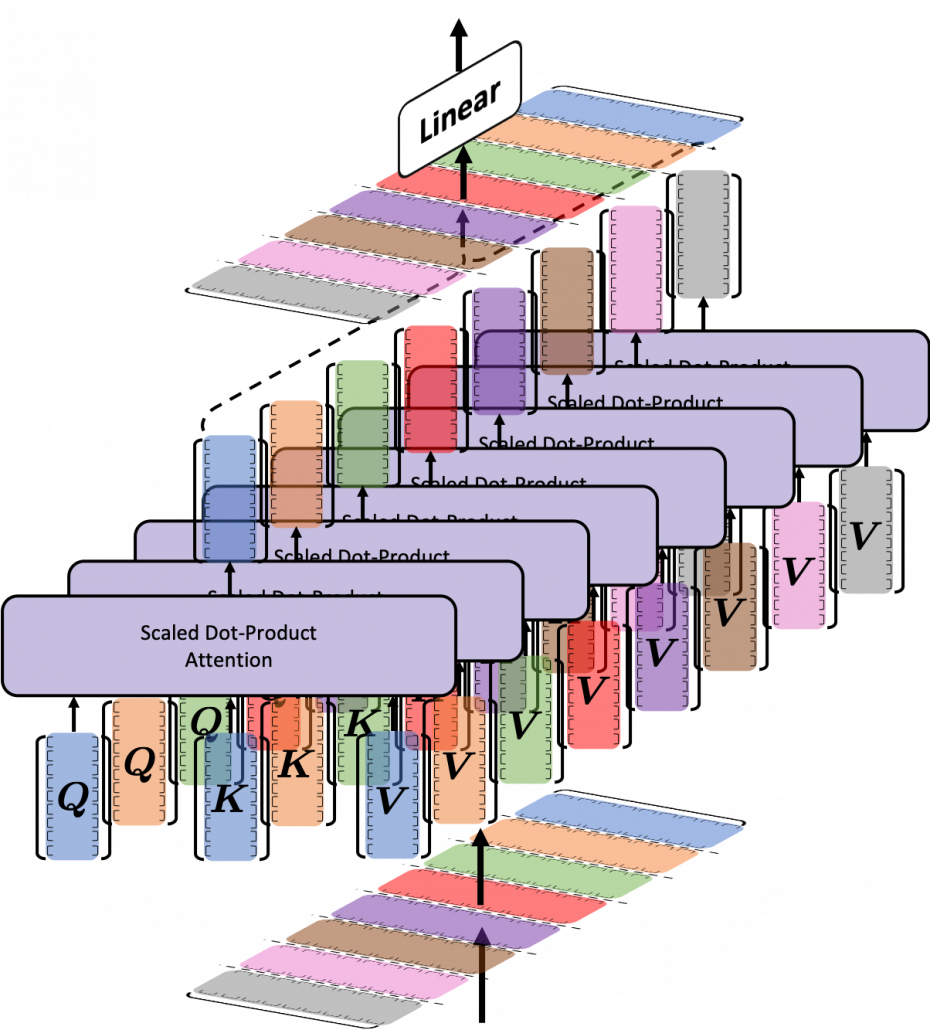
If you are reading this article from the beginning, I think this section is also showing the same idea which I have repeated, and I bet more or less you no have clearer views on how multi-head attention mechanism works. In the next section we are going to see how this is implemented.

4 Tensorflow implementation of multi-head attention

Let’s see how multi-head attention is implemented in the Tensorflow official tutorial. If you have read through this article so far, this should not be so difficult. I also added codes for displaying heat maps of self attentions. With the codes in this Github page, you can display self-attention heat maps for any input sentences in English.

The multi-head attention mechanism is implemented as below. If you understand Python codes and Tensorflow to some extent, I think this part is relatively easy.  The multi-head attention part is implemented as a class because you need to train weights of some fully connected layers. Whereas, scaled dot-product is just a function.

*I am going to explain the create_padding_mask() and create_look_ahead_mask() functions in upcoming articles. You do not need them this time.

Let’s see a case of using multi-head attention mechanism on a (1, 9, 512) sized input tensor, just as we have been considering in throughout this article. The first axis of (1, 9, 512) corresponds to the batch size, so this tensor is virtually a (9, 512) sized tensor, and this means the input is composed of 9 512-dimensional vectors. In the results below, you can see how the shape of input tensor changes after each procedure of calculating multi-head attention. Also you can see that the output of the multi-head attention is the same as the input, and you get a 9\times 9 matrix of attention heat maps of each attention head.

I guess the most complicated part of this implementation above is the split_head() function, especially if you do not understand tensor arithmetic. This part corresponds to splitting the input tensor to 8 different colored matrices as in one of the figures above. If you cannot understand what is going on in the function, I recommend you to prepare a sample tensor as below.

This is just a simple (1, 9, 512) sized tensor with sequential integer elements. The first row (1, 2, …., 512) corresponds to the first input token, and (4097, 4098, … , 4608) to the last one. You should try converting this sample tensor to see how multi-head attention is implemented. For example you can try the operations below.

These operations correspond to splitting the input into 8 heads, whose sizes are all (9, 64). And the second axis of the resulting (1, 8, 9, 64) tensor corresponds to the index of the heads. Thus sample_sentence[0][0] corresponds to the first head, the blue 9\times 64 matrix. Some Tensorflow functions enable linear calculations in each attention head, independently as in the codes below.

Very importantly, we have been only considering the cases of calculating self attentions, where all “queries”, “keys”, and “values” come from the same sentence in the same language. However, as I showed in the last article, usually “queries” are in a different language from “keys” and “values” in translation tasks, and “keys” and “values” are in the same language. And as you can imagine, usualy “queries” have different number of tokens from “keys” or “values.” You also need to understand this case, which is not calculating self-attentions. If you have followed this article so far, this case is not that hard to you. Let’s briefly see an example where the input sentence in the source language is composed 9 tokens, on the other hand the output is composed 12 tokens.

As I mentioned, one of the outputs of each multi-head attention class is 9\times 9 matrix of attention heat maps, which I displayed as a matrix composed of blue circles in the last section. The the implementation in the Tensorflow official tutorial, I have added codes to display actual heat maps of any input sentences in English.

*If you want to try displaying them by yourself, download or just copy and paste codes in this Github page. Please maker “datasets” directory in the same directory as the code. Please download “spa-eng.zip” from this page, and unzip it. After that please put “spa.txt” on the “datasets” directory. Also, please download the “checkpoints_en_es” folder from this link, and place the folder in the same directory as the file in the Github page. In the upcoming articles, you would need similar processes to run my codes.

After running codes in the Github page, you can display heat maps of self attentions. Let’s input the sentence “Anthony Hopkins admired Michael Bay as a great director.” You would get a heat maps like this.
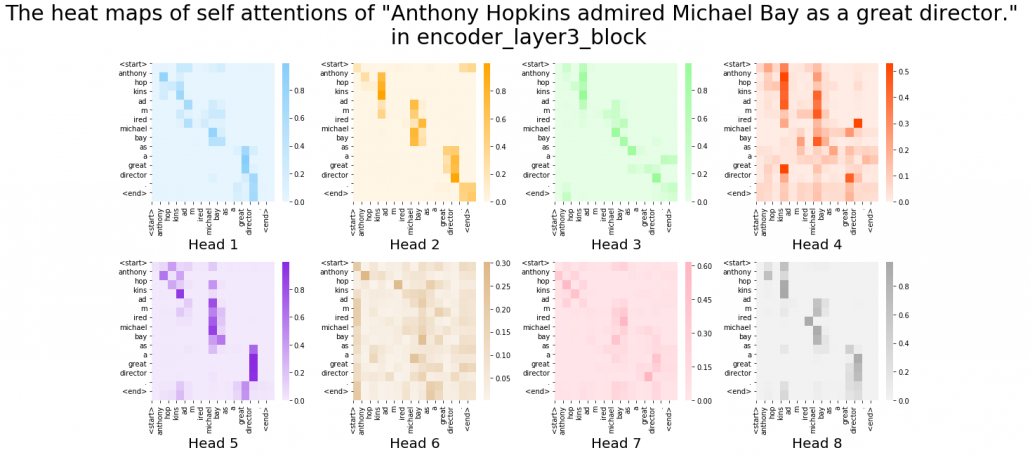
In fact, my toy implementation cannot handle proper nouns such as “Anthony” or “Michael.” Then let’s consider a simple input sentence “He admired her as a great director.” In each layer, you respectively get 8 self-attention heat maps.

I think we can see some tendencies in those heat maps. The heat maps in the early layers, which are close to the input, are blurry. And the distributions of the heat maps come to concentrate more or less diagonally. At the end, presumably they learn to pay attention to the start and the end of sentences.

You have finally finished reading this article. Congratulations.

You should be proud of having been patient, and you passed the most tiresome part of learning Transformer model. You must be ready for making a toy English-German translator in the upcoming articles. Also I am sure you have understood that Michael Bay is a great director, no matter what people say.

*Hannibal Lecter, I mean Athony Hopkins, also wrote a letter to the staff of “Breaking Bad,” and he told them the tv show let him regain his passion. He is a kind of admiring around, and I am a little worried that he might be getting senile. He played a role of a father forgetting his daughter in his new film “The Father.” I must see it to check if that is really an acting, or not.

[References]

[1] Ashish Vaswani, Noam Shazeer, Niki Parmar, Jakob Uszkoreit, Llion Jones, Aidan N. Gomez, Lukasz Kaiser, Illia Polosukhin, “Attention Is All You Need” (2017)

[2] “Transformer model for language understanding,” Tensorflow Core
https://www.tensorflow.org/overview

[3] “Neural machine translation with attention,” Tensorflow Core
https://www.tensorflow.org/tutorials/text/nmt_with_attention

[4] Jay Alammar, “The Illustrated Transformer,”
http://jalammar.github.io/illustrated-transformer/

[5] “Stanford CS224N: NLP with Deep Learning | Winter 2019 | Lecture 14 – Transformers and Self-Attention,” stanfordonline, (2019)
https://www.youtube.com/watch?v=5vcj8kSwBCY

[6]Tsuboi Yuuta, Unno Yuuya, Suzuki Jun, “Machine Learning Professional Series: Natural Language Processing with Deep Learning,” (2017), pp. 91-94
坪井祐太、海野裕也、鈴木潤 著, 「機械学習プロフェッショナルシリーズ 深層学習による自然言語処理」, (2017), pp. 191-193

[7]”Stanford CS224N: NLP with Deep Learning | Winter 2019 | Lecture 8 – Translation, Seq2Seq, Attention”, stanfordonline, (2019)
https://www.youtube.com/watch?v=XXtpJxZBa2c

[8]Rosemary Rossi, “Anthony Hopkins Compares ‘Genius’ Michael Bay to Spielberg, Scorsese,” yahoo! entertainment, (2017)
https://www.yahoo.com/entertainment/anthony-hopkins-transformers-director-michael-bay-guy-genius-010058439.html

* I make study materials on machine learning, sponsored by DATANOMIQ. I do my best to make my content as straightforward but as precise as possible. I include all of my reference sources. If you notice any mistakes in my materials, including grammatical errors, please let me know (email: yasuto.tamura@datanomiq.de). And if you have any advice for making my materials more understandable to learners, I would appreciate hearing it.
Data Science in Engineering Process - Product Lifecycle Management

How to develop digital products and solutions for industrial environments?

The Data Science and Engineering Process in PLM.

Huge opportunities for digital products are accompanied by huge risks

Digitalization is about to profoundly change the way we live and work. The increasing availability of data combined with growing storage capacities and computing power make it possible to create data-based products, services, and customer specific solutions to create insight with value for the business. Successful implementation requires systematic procedures for managing and analyzing data, but today such procedures are not covered in the PLM processes.

From our experience in industrial settings, organizations start processing the data that happens to be available. This data often does not fully cover the situation of interest, typically has poor quality, and in turn the results of data analysis are misleading. In industrial environments, the reliability and accuracy of results are crucial. Therefore, an enormous responsibility comes with the development of digital products and solutions. Unless there are systematic procedures in place to guide data management and data analysis in the development lifecycle, many promising digital products will not meet expectations.

Various methodologies exist but no comprehensive framework

Over the last decades, various methodologies focusing on specific aspects of how to deal with data were promoted across industries and academia. Examples are Six Sigma, CRISP-DM, JDM standard, DMM model, and KDD process. These methodologies aim at introducing principles for systematic data management and data analysis. Each methodology makes an important contribution to the overall picture of how to deal with data, but none provides a comprehensive framework covering all the necessary tasks and activities for the development of digital products. We should take these approaches as valuable input and integrate their strengths into a comprehensive Data Science and Engineering framework.

In fact, we believe it is time to establish an independent discipline to address the specific challenges of developing digital products, services and customer specific solutions. We need the same kind of professionalism in dealing with data that has been achieved in the established branches of engineering.

Data Science and Engineering as new discipline

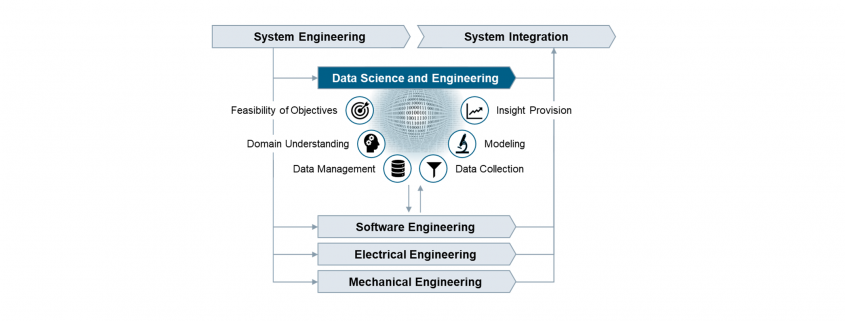
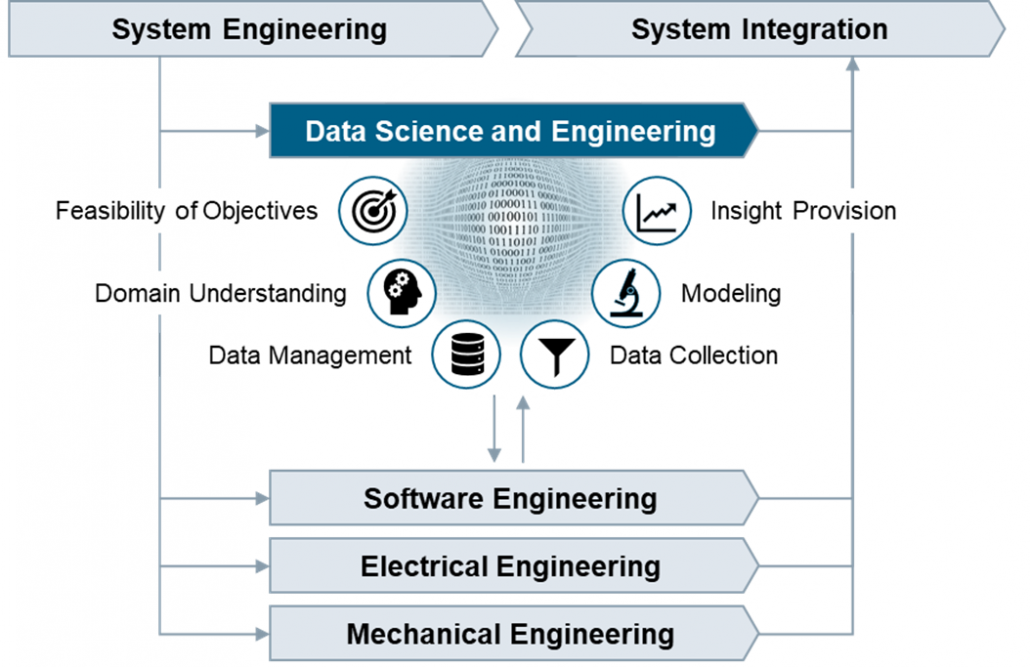
Whereas the implementation of software algorithms is adequately guided by software engineering practices, there is currently no established engineering discipline covering the important tasks that focus on the data and how to develop causal models that capture the real world. We believe the development of industrial grade digital products and services requires an additional process area comprising best practices for data management and data analysis. This process area addresses the specific roles, skills, tasks, methods, tools, and management that are needed to succeed.

Figure: Data Science and Engineering as new engineering discipline

More than in other engineering disciplines, the outputs of Data Science and Engineering are created in repetitions of tasks in iterative cycles. The tasks are therefore organized into workflows with distinct objectives that clearly overlap along the phases of the PLM process.

Feasibility of Objectives
  Understand the business situation, confirm the feasibility of the product idea, clarify the data infrastructure needs, and create transparency on opportunities and risks related to the product idea from the data perspective.
Domain Understanding
  Establish an understanding of the causal context of the application domain, identify the influencing factors with impact on the outcomes in the operational scenarios where the digital product or service is going to be used.
Data Management
  Develop the data management strategy, define policies on data lifecycle management, design the specific solution architecture, and validate the technical solution after implementation.
Data Collection
  Define, implement and execute operational procedures for selecting, pre-processing, and transforming data as basis for further analysis. Ensure data quality by performing measurement system analysis and data integrity checks.
Modeling
  Select suitable modeling techniques and create a calibrated prediction model, which includes fitting the parameters or training the model and verifying the accuracy and precision of the prediction model.
Insight Provision
  Incorporate the prediction model into a digital product or solution, provide suitable visualizations to address the information needs, evaluate the accuracy of the prediction results, and establish feedback loops.

Real business value will be generated only if the prediction model at the core of the digital product reliably and accurately reflects the real world, and the results allow to derive not only correct but also helpful conclusions. Now is the time to embrace the unique chances by establishing professionalism in data science and engineering.

Authors

Peter Louis                               

Peter Louis is working at Siemens Advanta Consulting as Senior Key Expert. He has 25 years’ experience in Project Management, Quality Management, Software Engineering, Statistical Process Control, and various process frameworks (Lean, Agile, CMMI). He is an expert on SPC, KPI systems, data analytics, prediction modelling, and Six Sigma Black Belt.


Ralf Russ    

Ralf Russ works as a Principal Key Expert at Siemens Advanta Consulting. He has more than two decades experience rolling out frameworks for development of industrial-grade high quality products, services, and solutions. He is Six Sigma Master Black Belt and passionate about process transparency, optimization, anomaly detection, and prediction modelling using statistics and data analytics.4


How Data Science Can Benefit Nonprofits

Image Source: https://pixabay.com/vectors/pixel-cells-pixel-creative-commons-3704068/

Data science is the poster child of the 21st century and for good reason. Data-based decisions have streamlined, automated, and made businesses more efficient than ever before, and there are practically no industries that haven’t recognized its immense potential. But when you think of data science application, sectors like marketing, finance, technology, SMEs, and even education are the first that come to mind. There’s one more sector that’s proving to be an untapped market for data—the social sector. At first, one might question why non-profit organizations even need complex data applications, but that’s just it—they don’t. What they really need is data tools that are simple and reliable, because if anything, accountability is the most important component of the way non-profits run.

Challenges for Non-profits and Data Science

If you’re wondering why many non-profits haven’t already hopped onto the data bandwagon, its because in most cases they lack one big thing—quality data.

One reason is that effective data application requires clean data, and heaps of it, something non-profits struggle with. Most don’t sell products or services, and their success is reliant on broad, long-term (sometimes decades) results and changes, which means their outcomes are highly unmeasurable. Metrics and data seem out of place when appealing to donors, who are persuaded more by emotional campaigns. Data collection is also rare, perhaps only being recorded when someone signs up to the program or leaves, and hardly any tracking in between. The result is data that’s too little and unreliable to make effective change.

Perhaps the most important phase, data collection relies heavily on accurate and organized processes. For non-profits that don’t have the resources for accurate and manual record-keeping, clean, and quality data collection is a huge pain point. However, that is an issue now easily avoidable. For instance, avoiding duplicate files, adopting record-keeping methods like off-site and cloud storage, digital retention, and of course back-up plans—are all processes that could save non-profits time, effort, and risk. On the other hand, poor record management has its consequences, namely on things like fund allocation, payroll, budgeting, and taxes. It could lead to financial risk, legal trouble, and data loss — all added worries for already under-resourced non-profit organizations.

But now, as non-governmental organizations (NGOs) and non-profits catch up and invest more in data collection processes, there’s room for data science to make its impact. A growing global movement, ‘Data For Good’ represents individuals, companies, and organizations volunteering to create or use data to help further social causes ad support non-profit organizations. This ‘Data For Good’ movement includes tools for data work that are donated or subsidized, as well as educational programs that serve marginalized communities. As the movement gains momentum, non-profits are seeing data seep into their structures and turn processes around.

How Can Data Do Social Good?

With data science set to take the non-profit sector by storm, let’s look at some of the ways data can do social good:

  1. Improving communication with donors: Knowing when to reach out to your donors is key. In between a meeting? You’re unlikely to see much enthusiasm. Once they’re at home with their families? You may see wonderful results, as pointed out in this Forbes article. The article opines that data can help non-profits understand and communicate with their donors better.
  2. Donor targetting: Cold calls are a hit and miss, and with data on their side, non-profits can discover and define their ideal donor and adapt their messaging to reach out to them for better results.
  3. Improving cost efficiency: Costs are a major priority for non-profits and every penny counts. Data can help decrease costs and streamline financial planning
  4. Increasing new member sign-ups and renewals: Through data, non-profits can reach out to the right people they want on-board, strengthen recruitment processes and keep track of volunteers reaching out to them for future events or recruitment drives.
  5. Modeling and forecasting performance: With predictive modeling tools, non-profits can make data-based decisions on where they should allocate time and money for the future, rather than go on gut instinct.
  6. Measuring return on investment: For a long time, the outcomes of social campaigns have been perceived as intangible and immeasurable—it’s hard to measure empowerment or change. With data, non-profits can measure everything from the amount a fundraiser raised against a goal, the cost of every lead in a lead generation campaign, etc
  7. Streamlining operations: Finally, non-profits can use data tools to streamline their business processes internally and invest their efforts into resources that need it.

It’s true, measuring good and having social change down to a science is a long way off — but data application is a leap forward into a more efficient future for the social sector. With mission-aligned processes, data-driven non-profits can realize their potential, redirect their focus from trivial tasks, and onto the bigger picture to drive true change.

Introduction to Recommendation Engines

This is the second article of article series Getting started with the top eCommerce use cases. If you are interested in reading the first article you can find it here.

What are Recommendation Engines?

Recommendation engines are the automated systems which helps select out similar things whenever a user selects something online. Be it Netflix, Amazon, Spotify, Facebook or YouTube etc. All of these companies are now using some sort of recommendation engine to improve their user experience. A recommendation engine not only helps to predict if a user prefers an item or not but also helps to increase sales, ,helps to understand customer behavior, increase number of registered users and helps a user to do better time management. For instance Netflix will suggest what movie you would want to watch or Amazon will suggest what kind of other products you might want to buy. All the mentioned platforms operates using the same basic algorithm in the background and in this article we are going to discuss the idea behind it.

What are the techniques?

There are two fundamental algorithms that comes into play when there’s a need to generate recommendations. In next section these techniques are discussed in detail.

Content-Based Filtering

The idea behind content based filtering is to analyse a set of features which will provide a similarity between items themselves i.e. between two movies, two products or two songs etc. These set of features once compared gives a similarity score at the end which can be used as a reference for the recommendations.

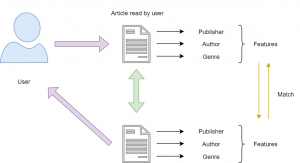
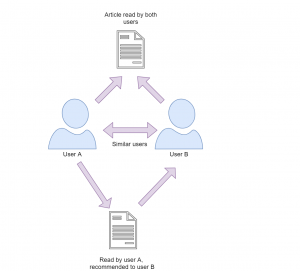
There are several steps involved to get to this similarity score and the first step is to construct a profile for each item by representing some of the important features of that item. In other terms, this steps requires to define a set of characteristics that are discovered easily. For instance, consider that there’s an article which a user has already read and once you know that this user likes this article you may want to show him recommendations of similar articles. Now, using content based filtering technique you could find the similar articles. The easiest way to do that is to set some features for this article like publisher, genre, author etc. Based on these features similar articles can be recommended to the user (as illustrated in Figure 1). There are three main similarity measures one could use to find the similar articles mentioned below.


Figure 1: Content-Based Filtering


Minkowski distance

Minkowski distance between two variables can be calculated as:

(x,y)= (\sum_{i=1}^{n}{|X_{i} - Y_{i}|^{p}})^{1/p}


Cosine Similarity

Cosine similarity between two variables can be calculated as :

  \mbox{Cosine Similarity} = \frac{\sum_{i=1}^{n}{x_{i} y_{i}}} {\sqrt{\sum_{i=1}^{n}{x_{i}^{2}}} \sqrt{\sum_{i=1}^{n}{y_{i}^{2}}}} \


Jaccard Similarity


  J(X,Y) = |X ∩ Y| / |X ∪ Y|


These measures can be used to create a matrix which will give you the similarity between each movie and then a function can be defined to return the top 10 similar articles.


Collaborative filtering

This filtering method focuses on finding how similar two users or two products are by analyzing user behavior or preferences rather than focusing on the content of the items. For instance consider that there are three users A,B and C.  We want to recommend some movies to user A, our first approach would be to find similar users and compare which movies user A has not yet watched and recommend those movies to user A.  This approach where we try to find similar users is called as User-User Collaborative Filtering.  

The other approach that could be used here is when you try to find similar movies based on the ratings given by others, this type is called as Item-Item Collaborative Filtering. The research shows that item-item collaborative filtering works better than user-user collaborative filtering as user behavior is really dynamic and changes over time. Also, there are a lot more users and increasing everyday but on the other side item characteristics remains the same. To calculate the similarities we can use Cosine distance.


Figure 2: Collaborative Filtering


Recently some companies have started to take advantage of both content based and collaborative filtering techniques to make a hybrid recommendation engine. The results from both models are combined into one hybrid model which provides more accurate recommendations. Five steps are involved to make a recommendation engine work which are collection of data, storing of data, analyzing the data, filtering the data and providing recommendations. There are a lot of attributes that are involved in order to collect user data including browsing history, page views, search logs, order history, marketing channel touch points etc. which requires a strong data architecture.  The collection of data is pretty straightforward but it can be overwhelming to analyze this amount of data. Storing this data could get tricky on the other hand as you need a scalable database for this kind of data. With the rise of graph databases this area is also improving for many use cases including recommendation engines. Graph databases like Neo4j can also help to analyze and find similar users and relationship among them. Analyzing the data can be carried in different ways, depending on how strong and scalable your architecture you can run real time, batch or near real time analysis. The fourth step involves the filtering of the data and here you can use any of the above mentioned approach to find similarities to finally provide the recommendations.

Having a good recommendation engine can be time consuming initially but it is definitely beneficial in the longer run. It not only helps to generate revenue but also helps to to improve your product catalog and customer service.

Multi-touch attribution: A data-driven approach

Customers shopping behavior has changed drastically when it comes to online shopping, as nowadays, customer likes to do a thorough market research about a product before making a purchase.

What is Multi-touch attribution?

This makes it really hard for marketers to correctly determine the contribution for each marketing channel to which a customer was exposed to. The path a customer takes from his first search to the purchase is known as a Customer Journey and this path consists of multiple marketing channels or touchpoints. Therefore, it is highly important to distribute the budget between these channels to maximize return. This problem is known as multi-touch attribution problem and the right attribution model helps to steer the marketing budget efficiently. Multi-touch attribution problem is well known among marketers. You might be thinking that if this is a well known problem then there must be an algorithm out there to deal with this. Well, there are some traditional models  but every model has its own limitation which will be discussed in the next section.

Types of attribution models

Most of the eCommerce companies have a performance marketing department to make sure that the marketing budget is spent in an agile way. There are multiple heuristics attribution models pre-existing in google analytics however there are several issues with each one of them. These models are:

Traditional attribution models

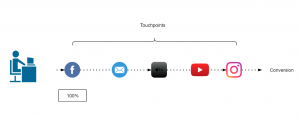
First touch attribution model

100% credit is given to the first channel as it is considered that the first marketing channel was responsible for the purchase.

Figure 1: First touch attribution model

Last touch attribution model

100% credit is given to the last channel as it is considered that the first marketing channel was responsible for the purchase.

Figure 2: Last touch attribution model

Linear-touch attribution model

In this attribution model, equal credit is given to all the marketing channels present in customer journey as it is considered that each channel is equally responsible for the purchase.

Figure 3: Linear attribution model

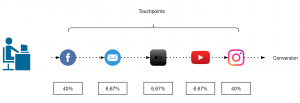
U-shaped or Bath tub attribution model

This is most common in eCommerce companies, this model assigns 40% to first and last touch and 20% is equally distributed among the rest.

Figure 4: Bathtub or U-shape attribution model

Data driven attribution models

Traditional attribution models follows somewhat a naive approach to assign credit to one or all the marketing channels involved. As it is not so easy for all the companies to take one of these models and implement it. There are a lot of challenges that comes with multi-touch attribution problem like customer journey duration, overestimation of branded channels, vouchers and cross-platform issue, etc.

Switching from traditional models to data-driven models gives us more flexibility and more insights as the major part here is defining some rules to prepare the data that fits your business. These rules can be defined by performing an ad hoc analysis of customer journeys. In the next section, I will discuss about Markov chain concept as an attribution model.

Markov chains

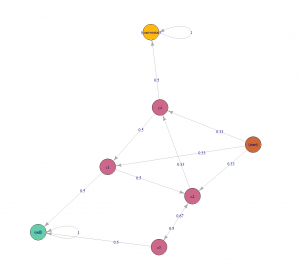
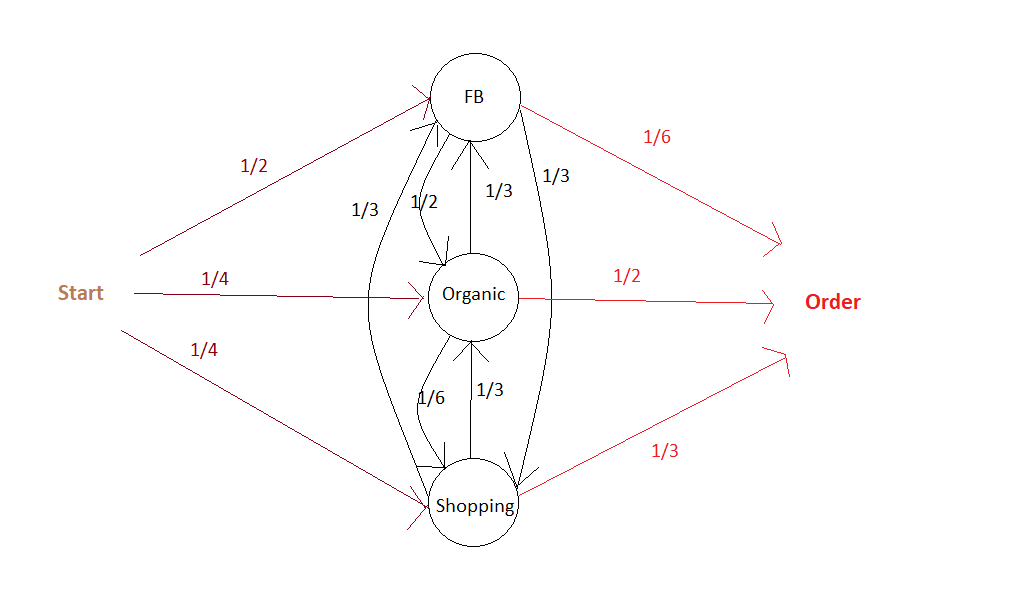
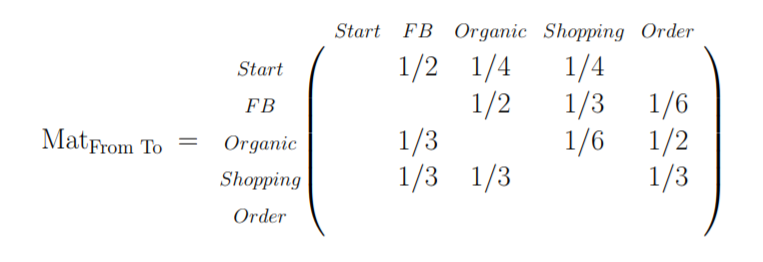
Markov chains concepts revolves around probability. For attribution problem, every customer journey can be seen as a chain(set of marketing channels) which will compute a markov graph as illustrated in figure 5. Every channel here is represented as a vertex and the edges represent the probability of hopping from one channel to another. There will be an another detailed article, explaining the concept behind different data-driven attribution models and how to apply them.

Figure 5: Markov chain example

Challenges during the Implementation

Transitioning from a traditional attribution models to a data-driven one, may sound exciting but the implementation is rather challenging as there are several issues which can not be resolved just by changing the type of model. Before its implementation, the marketers should perform a customer journey analysis to gain some insights about their customers and try to find out/perform:

  1. Length of customer journey.
  2. On an average how many branded and non branded channels (distinct and non-distinct) in a typical customer journey?
  3. Identify most upper funnel and lower funnel channels.
  4. Voucher analysis: within branded and non-branded channels.

When you are done with the analysis and able to answer all of the above questions, the next step would be to define some rules in order to handle the user data according to your business needs. Some of the issues during the implementation are discussed below along with their solution.

Customer journey duration

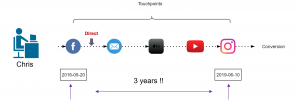
Assuming that you are a retailer, let’s try to understand this issue with an example. In May 2016, your company started a Fb advertising campaign for a particular product category which “attracted” a lot of customers including Chris. He saw your Fb ad while working in the office and clicked on it, which took him to your website. As soon as he registered on your website, his boss called him (probably because he was on Fb while working), he closed everything and went for the meeting. After coming back, he started working and completely forgot about your ad or products. After a few days, he received an email with some offers of your products which also he ignored until he saw an ad again on TV in Jan 2019 (after 3 years). At this moment, he started doing his research about your products and finally bought one of your products from some Instagram campaign. It took Chris almost 3 years to make his first purchase.

Figure 6: Chris journey

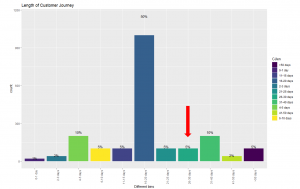
Now, take a minute and think, if you analyse the entire journey of customers like Chris, you would realize that you are still assigning some of the credit to the touchpoints that happened 3 years ago. This can be solved by using an attribution window. Figure 6 illustrates that 83% of the customers are making a purchase within 30 days which means the attribution window here could be 30 days. In simple words, it is safe to remove the touchpoints that happens after 30 days of purchase. This parameter can also be changed to 45 days or 60 days, depending on the use case.

Figure 7: Length of customer journey

Removal of direct marketing channel

A well known issue that every marketing analyst is aware of is, customers who are already aware of the brand usually comes to the website directly. This leads to overestimation of direct channel and branded channels start getting more credit. In this case, you can set a threshold (say 7 days) and remove these branded channels from customer journey.

Figure 8: Removal of branded channels

Cross platform problem

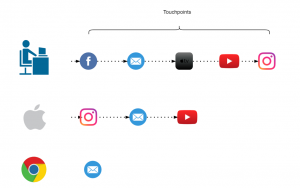
If some of your customers are using different devices to explore your products and you are not able to track them then it will make retargeting really difficult. In a perfect world these customers belong to same journey and if these can’t be combined then, except one, other paths would be considered as “non-converting path”. For attribution problem device could be thought of as a touchpoint to include in the path but to be able to track these customers across all devices would still be challenging. A brief introduction to deterministic and probabilistic ways of cross device tracking can be found here.

Figure 9: Cross platform clash

How to account for Vouchers?

To better account for vouchers, it can be added as a ‘dummy’ touchpoint of the type of voucher (CRM,Social media, Affiliate or Pricing etc.) used. In our case, we tried to add these vouchers as first touchpoint and also as a last touchpoint but no significant difference was found. Also, if the marketing channel of which the voucher was used was already in the path, the dummy touchpoint was not added.

Figure 10: Addition of Voucher as a touchpoint

Attribution Models in Marketing

Attribution Models

A Business and Statistical Case

INTRODUCTION

A desire to understand the causal effect of campaigns on KPIs

Advertising and marketing costs represent a huge and ever more growing part of the budget of companies. Studies have found out this share is as high as 10% and increases with the size of companies (CMO study by American Marketing Association and Duke University, 2017). Measuring precisely the impact of a specific marketing campaign on the sales of a company is a critical step towards an efficient allocation of this budget. Would the return be higher for an euro spent on a Facebook ad, or should we better spend it on a TV spot? How much should I spend on Twitter ads given the volume of sales this channel is responsible for?

Attribution Models have lately received great attention in Marketing departments to answer these issues. The transition from offline to online marketing methods has indeed permitted the collection of multiple individual data throughout the whole customer journey, and  allowed for the development of user-centric attribution models. In short, Attribution Models use the information provided by Tracking technologies such as Google Analytics or Webtrekk to understand customer journeys from the first click on a Facebook ad to the final purchase and adequately ponderate the different marketing campaigns encountered depending on their responsibility in the final conversion.

Issues on Causal Effects

A key question then becomes: how to declare a channel is responsible for a purchase? In other words, how can we isolate the causal effect or incremental value of a campaign ?

          1. A/B-Tests

One method to estimate the pure impact of a campaign is the design of randomized experiments, wherein a control and treated groups are compared.  A/B tests belong to this broad category of randomized methods. Provided the groups are a priori similar in every aspect except for the treatment received, all subsequent differences may be attributed solely to the treatment. This method is typically used in medical studies to assess the effect of a drug to cure a disease.

Main practical issues regarding Randomized Methods are:

  • Assuring that control and treated groups are really similar before treatment. Uually a random assignment (i.e assuring that on a relevant set of observable variables groups are similar) is realized;
  • Potential spillover-effects, i.e the possibility that the treatment has an impact on the non-treated group as well (Stable unit treatment Value Assumption, or SUTVA in Rubin’s framework);
  • The costs of conducting such an experiment, and especially the costs linked to the deliberate assignment of individuals to a group with potentially lower results;
  • The number of such experiments to design if multiple treatments have to be measured;
  • Difficulties taking into account the interaction effects between campaigns or the effect of spending levels. Indeed, usually A/B tests are led by cutting off temporarily one campaign entirely and measuring the subsequent impact on KPI’s compared to the situation where this campaign is maintained;
  • The dynamical reproduction of experiments if we assume that treatment effects may change over time.

In the marketing context, multiple campaigns must be tested in a dynamical way, and treatment effect is likely to be heterogeneous among customers, leading to practical issues in the lauching of A/B tests to approximate the incremental value of all campaigns. However, sites with a lot of traffic and conversions can highly benefit from A/B testing as it provides a scientific and straightforward way to approximate a causal impact. Leading companies such as Uber, Netflix or Airbnb rely on internal tools for A/B testing automation, which allow them to basically test any decision they are about to make.

References:

Books:

Experiment!: Website conversion rate optimization with A/B and multivariate testing, Colin McFarland, ©2013 | New Riders  

A/B testing: the most powerful way to turn clicks into customers. Dan Siroker, Pete Koomen; Wiley, 2013.

Blogs:

https://eng.uber.com/xp

https://medium.com/airbnb-engineering/growing-our-host-community-with-online-marketing-9b2302299324

Study:

https://cmosurvey.org/wp-content/uploads/sites/15/2018/08/The_CMO_Survey-Results_by_Firm_and_Industry_Characteristics-Aug-2018.pdf

        2. Attribution models

Attribution Models do not demand to create an experimental setting. They take into account existing data and derive insights from the variability of customer journeys. One key difficulty is then to differentiate correlation and causality in the links observed between the exposition to campaigns and purchases. Indeed, selection effects may bias results as exposure to campaigns is usually dependant on user-characteristics and thus may not be necessarily independant from the customer’s baseline conversion probabilities. For example, customers purchasing from a discount price comparison website may be intrinsically different from customers buying from FB ad and this a priori difference may alone explain post-exposure differences in purchasing bahaviours. This intrinsic weakness must be remembered when interpreting Attribution Models results.

                          2.1 General Issues

The main issues regarding the implementation of Attribution Models are linked to

  • Causality and fallacious reasonning, as most models do not take into account the aforementionned selection biases.
  • Their difficult evaluation. Indeed, in almost all attribution models (except for those based on classification, where the accuracy of the model can be computed), the additionnal value brought by the use of a given attribution models cannot be evaluated using existing historical data. This additionnal value can only be approximated by analysing how the implementation of the conclusions of the attribution model have impacted a given KPI.
  • Tracking issues, leading to an uncorrect reconstruction of customer journeys
    • Cross-device journeys: cross-device issue arises from the use of different devices throughout the customer journeys, making it difficult to link datapoints. For example, if a customer searches for a product on his computer but later orders it on his mobile, the AM would then mistakenly consider it an order without prior campaign exposure. Though difficult to measure perfectly, the proportion of cross-device orders can approximate 20-30%.
    • Cookies destruction makes it difficult to track the customer his the whole journey. Both regulations and consumers’ rising concerns about data privacy issues mitigate the reliability and use of cookies.1 – From 2002 on, the EU has enacted directives concerning privacy regulation and the extended use of cookies for commercial targeting purposes, which have highly impacted marketing strategies, such as the ‘Privacy and Electronic Communications Directive’ (2002/58/EC). A research was conducted and found out that the adoption of this ‘Privacy Directive’ had led to 64% decrease in advertising methods compared to the rest of the world (Goldfarb et Tucker (2011)). The effect was stronger for generalized sites (Yahoo) than for specialized sites.2 – Users have grown more and more conscious of data privacy issues and have adopted protective measures concerning data privacy, such as automatic destruction of cookies after a session is ended, or simply giving away less personnal information (Goldfarb et Tucker (2012) ) .Valuable user information may be lost, though tracking technologies evolution have permitted to maintain tracking by other means. This issue may be particularly important in countries highly concerned with data privacy issues such as Germany.
    • Offline/Online bridge: an Attribution Model should take into account all campaigns to draw valuable insights. However, the exposure to offline campaigns (TV, newspapers) are difficult to track at the user level. One idea to tackle this issue would be to estimate the proportion of conversions led by offline campaigns through AB testing and deduce this proportion from the credit assigned to the online campaigns accounted for in the Attribution Model.
    • Touch point information available: clicks are easy to follow but irrelevant to take into account the influence of purely visual campaigns such as display ads or video.

                          2.2 Today’s main practices

Two main families of Attribution Models exist:

  • Rule-Based Attribution Models, which have been used for in the last decade but from which companies are gradualy switching.

Attribution depends on the individual journeys that have led to a purchase and is solely based on the rank of the campaign in the journey. Some models focus on a single touch points (First Click, Last Click) while others account for multi-touch journeys (Bathtube, Linear). It can be calculated at the customer level and thus doesn’t require large amounts of data points. We can distinguish two sub-groups of rule-based Attribution Models:

  • One Touch Attribution Models attribute all credit to a single touch point. The First-Click model attributes all credit for a converion to the first touch point of the customer journey; last touch attributes all credit to the last campaign.
  • Multi-touch Rule-Based Attribution Models incorporate information on the whole customer journey are thus an improvement compared to one touch models. To this family belong Linear model where credit is split equally between all channels, Bathtube model where 40% of credit is given to first and last clicks and the remaining 20% is distributed equally between the middle channels, or time-decay models where credit assigned to a click diminishes as the time between the click and the order increases..

The main advantages of rule-based models is their simplicity and cost effectiveness. The main problems are:

– They are a priori known and can thus lead to optimization strategies from competitors
– They do not take into account aggregate intelligence on customer journeys and actual incremental values.
– They tend to bias (depending on the model chosen) channels that are over-represented at the beggining or end of the funnel, according to theoretical assumptions that have no observationnal back-ups.

  • Data-Driven Attribution Models

These models take into account the weaknesses of rule-based models and make a relevant use of available data. Being data-driven, following attribution models cannot be computed using single user level data. On the contrary values are calculated through data aggregation and thus require a certain volume of customer journey information.

References:

https://dspace.mit.edu/handle/1721.1/64920


        3. Data-Driven Attribution Models in practice

                          3.1 Issues

Several issues arise in the computation of campaigns individual impact on a given KPI within a data-driven model.

  • Selection biases: Exposure to certain types of advertisement is usually highly correlated to non-observable variables which are in turn correlated to consumption practices. Differences in the behaviour of users exposed to different campaigns may thus only be driven by core differences in conversion probabilities between groups whether than by the campaign effect.
  • Complementarity: it may be that campaigns A and B only have an effect when combined, so that measuring their individual impact would lead to misleading conclusions. The model could then try to assess the effect of combinations of campaigns on top of the effect of individual campaigns. As the number of possible non-ordered combinations of k campaigns is 2k, it becomes clear that inclusing all possible combinations would however be time-consuming.
  • Order-sensitivity: The effect of a campaign A may depend on the place where it appears in the customer journey, meaning the rank of a campaign and not merely its presence could be accounted for in the model.
  • Relative Order-sensitivity: it may be that campaigns A and B only have an effect when one is exposed to campaign A before campaign B. If so, it could be useful to assess the effect of given combinations of campaigns as well. And this for all campaigns, leading to tremendous numbers of possible combinations.
  • All previous phenomenon may be present, increasing even more the potential complexity of a comprehensive Attribution Model. The number of all possible ordered combination of k campaigns is indeed :


                          3.2 Main models

                                  A) Logistic Regression and Classification models

If non converting journeys are available, Attribition Model can be shaped as a simple classification issue. Campaign types or campaigns combination and volume of campaign types can be included in the model along with customer or time variables. As we are interested in inference (on campaigns effect) whether than prediction, a parametric model should be used, such as Logistic Regression. Non paramatric models such as Random Forests or Neural Networks can also be used though the interpretation of campaigns value would be more difficult to derive from the model results.

A common pitfall is the usual issue of spurious correlations on one hand and the correct interpretation of coefficients in business terms.

An advantage if the possibility to evaluate the relevance of the model using common model validation methods to evaluate its predictive power (validation set \ AUC \pseudo R squared).

                                  B) Shapley Value

Theory

The Shapley Value is based on a Game Theory framework and is named after its creator, the Nobel Price Laureate Lloyd Shapley. Initially meant to calculate the marginal contribution of players in cooperative games, the model has received much attention in research and industry and has lately been applied to marketing issues. This model is typically used by Google Adords and other ad bidding vendors. Campaigns or marketing channels are in this model seen as compementary players looking forward to increasing a given KPI.
Contrarily to Logistic Regressions, it is a non-parametric model. Contrarily to Markov Chains, all results are built using existing journeys, and not simulated ones.

Channels are considered to enter the game sequentially under a certain joining order. Shapley value try to The Shapley value of channel i is the weighted sum of the marginal values that channel i adds to all possible coalitions that don’t contain channel i.
In other words, the main logic is to analyse the difference of gains when a channel i is added after a coalition Ck of k channels, k<=n. We then sum all the marginal contributions over all possible ordered combination Ck of all campaigns excluding i, with k<=n-1.

Subsets framework

A first an most usual way to compute the Shapley Vaue is to consider that when a channel enters coalition, its additionnal value is the same irrelevant of the order in which previous channels have appeared. In other words, journeys (A>B>C) and (B>A>C) trigger the same gains.
Shapley value is computed as the gains associated to adding a channel i to a subset of channels, weighted by the number of (ordered) sequences that the (unordered) subset represents, summed up on all possible subsets of the total set of campaigns where the channel i is not present.
The Shapley value of the channel ???????? is then:

where |S| is the number of campaigns of a coalition S and the sum extends over all subsets S that do not not contain channel j. ????(????)  is the value of the coalition S and ????(???? ∪ {????????})  the value of the coalition formed by adding ???????? to coalition S. ????(???? ∪ {????????}) − ????(????) is thus the marginal contribution of channel ???????? to the coalition S.

The formula can be rewritten and understood as:

This method is convenient when data on the gains of on all possible permutations of all unordered k subsets of the n campaigns are available. It is also more convenient if the order of campaigns prior to the introduction of a campaign is thought to have no impact.

Ordered sequences

Let us define ????((A>B)) as the value of the sequence A then B. What is we let ????((A>B)) be different from ????((B>A)) ?
This time we would need to sum over all possible permutation of the S campaigns present before  ???????? and the N-(S+1) campaigns after ????????. Doing so we will sum over all possible orderings (i.e all permutations of the n campaigns of the grand coalition containing all campaigns) and we can remove the permutation coefficient s!(p-s+1)!.

This method is convenient when the order of channels prior to and after the introduction of another channel is assumed to have an impact. It is also necessary to possess data for all possible permutations of all k subsets of the n campaigns, and not only on all (unordered) k-subsets of the n campaigns, k<=n. In other words, one must know the gains of A, B, C, A>B, B>A, etc. to compute the Shapley Value.

Differences between the two approaches

We simulate an ordered case where the value for each ordered sequence k for k<=3 is known. We compare it to the usual Shapley value calculated based on known gains of unordered subsets of campaigns. So as to compare relevant values, we have built the gains matrix so that the gains of a subset A, B i.e  ????({B,A}) is the average of the gains of ordered sequences made up with A and B (assuming the number of journeys where A>B equals the number of journeys where B>A, we have ????({B,A})=0.5( ????((A>B)) + ????((B>A)) ). We let the value of the grand coalition be different depending on the order of campaigns-keeping the constraints that it averages to the value used for the unordered case.

Note: mvA refers to the marginal value of A in a given sequence.
With traditionnal unordered coalitions:

With ordered sequences used to compute the marginal values:


We can see that the two approaches yield very different results. In the unordered case, the Shapley Value campaign C is the highest, culminating at 20, while A and B have the same Shapley Value mvA=mvB=15. In the ordered case, campaign A has the highest Shapley Value and all campaigns have different Shapley Values.

This example illustrates the inherent differences between the set and sequences approach to Shapley values. Real life data is more likely to resemble the ordered case as conversion probabilities may for any given set of campaigns be influenced by the order through which the campaigns appear.

Advantages

Shapley value has become popular in allocation problems in cooperative games because it is the unique allocation which satisfies different axioms:

  • Efficiency: Shaple Values of all channels add up to the total gains (here, orders) observed.
  • Symmetry: if channels A and B bring the same contribution to any coalition of campaigns, then their Shapley Value i sthe same
  • Null player: if a channel brings no additionnal gains to all coalitions, then its Shapley Value is zero
  • Strong monotony: the Shapley Value of a player increases weakly if all its marginal contributions increase weakly

These properties make the Shapley Value close to what we intuitively define as a fair attribution.

Issues

  • The Shapley Value is based on combinatory mathematics, and the number of possible coalitions and ordered sequences becomes huge when the number of campaigns increases.
  • If unordered, the Shapley Value assumes the contribution of campaign A is the same if followed by campaign B or by C.
  • If ordered, the number of combinations for which data must be available and sufficient is huge.
  • Channels rarely present or present in long journeys will be played down.
  • Generally, gains are supposed to grow with the number of players in the game. However, it is plausible that in the marketing context a journey with a high number of channels will not necessarily bring more orders than a journey with less channels involved.

References:

R package: GameTheoryAllocation

Article:
Zhao & al, 2018 “Shapley Value Methods for Attribution Modeling in Online Advertising “
https://link.springer.com/content/pdf/10.1007/s13278-017-0480-z.pdf
Courses: https://www.lamsade.dauphine.fr/~airiau/Teaching/CoopGames/2011/coopgames-7%5b8up%5d.pdf
Blogs: https://towardsdatascience.com/one-feature-attribution-method-to-supposedly-rule-them-all-shapley-values-f3e04534983d

                                  B) Markov Chains

Markov Chains are used to model random processes, i.e events that occur in a sequential manner and in such a way that the probability to move to a certain state only depends on the past steps. The number of previous steps that are taken into account to model the transition probability is called the memory parameter of the sequence, and for the model to have a solution must be comprised between 0 and 4. A Markov Chain process is thus defined entirely by its Transition Matrix and its initial vector (i.e the starting point of the process).

Markov Chains are applied in many scientific fields. Typically, they are used in weather forecasting, with the sequence of Sunny and Rainy days following a Markov Process of memory parameter 0, so that for each given day the probability that the next day will be rainy or sunny only depends on the weather of the current day. Other applications can be found in sociology to understand the dynamics of social classes intergenerational reproduction. To get more both mathematical and applied illustration, I recommend the reading of this course.

In the marketing context, Markov Chains are an interesting way to model the conversion funnel. To go from the from the Markov Model to the Attribution logic, we calculate the Removal Effect of each channel, i.e the difference in conversions that happen if the channel is removed. Please read below for an introduction to the methodology.

The first step in a Markov Chains Attribution Model is to build the transition matrix that captures the transition probabilities between the campaigns accross existing customer journeys. This Matrix is to be read as a “From state A to state B” table, from the left to the right. A first difficulty is finding the right memory parameter to use. A large memory parameter would allow to take more into account interraction effects within the conversion funnel but would lead to increased computationnal time, a non-readable transition matrix, and be more sensitive to noisy data. Please note that this transition matrix provides useful information on the conversion funnel and on the relationships between campaigns and can be used as such as an analytical tool. I suggest the clear and easily R code which can be found here or here.

Here is an illustration of a Markov Chain with memory Parameter of 0: the probability to go to a certain campaign B in the next step only depend on the campaign we are currently at:

The associated Transition Matrix is then (with null probabilities left as Blank):

The second step is  to compute the actual responsibility of a channel in total conversions. As mentionned above, the main philosophy to do so is to calculate the Removal Effect of each channel, i.e the changes in the number of conversions when a channel is entirely removed. All customer journeys which went through this channel are settled out to be unsuccessful. This calculation is done by applying the transition matrix with and without the removed channels to an initial vector that contains the number of desired simulations.

Building on our current example, we can then settle an initial vector with the desired number of simulations, e.g 10 000:


It is possible at this stage to add a constraint on the maximum number of times the matrix is applied to the data, i.e on the maximal number of campaigns a simulated journey is allowed to have.

Advantages

  • The dynamic journey is taken into account, as well as the transition between two states. The funnel is not assumed to be linear.
  • It is possile to build a conversion graph that maps the customer journey provides valuable insights.
  • It is possible to evaluate partly the accuracy of the Attribution Model based on Markov Chains. It is for example possible to see how well the transition matrix help predict the future by analysing the number of correct predictions at any given step over all sequences.

Disadvantages

  • It can be somewhat difficult to set the memory parameter. Complementarity effects between channels are not well taken into account if the memory is low, but a parameter too high will lead to over-sensitivity to noise in the data and be difficult to implement if customer journeys tend to have a number of campaigns below this memory parameter.
  • Long journeys with different channels involved will be overweighted, as they will count many times in the Removal Effect.  For example, if there are n-1 channels in the customer journey, this journey will be considered as failure for the n-1 channel-RE. If the volume effects (i.e the impact of the overall number of channels in a journey, irrelevant from their type° are important then results may be biased.

References:

R package: ChannelAttribution

Git:

https://github.com/MatCyt/Markov-Chain/blob/master/README.md

Course:

https://www.ssc.wisc.edu/~jmontgom/markovchains.pdf

Article:

“Mapping the Customer Journey: A Graph-Based Framework for Online Attribution Modeling”; Anderl, Eva and Becker, Ingo and Wangenheim, Florian V. and Schumann, Jan Hendrik, 2014. Available at SSRN: https://ssrn.com/abstract=2343077 or http://dx.doi.org/10.2139/ssrn.2343077

“Media Exposure through the Funnel: A Model of Multi-Stage Attribution”, Abhishek & al, 2012

“Multichannel Marketing Attribution Using Markov Chains”, Kakalejčík, L., Bucko, J., Resende, P.A.A. and Ferencova, M. Journal of Applied Management and Investments, Vol. 7 No. 1, pp. 49-60.  2018

Blogs:

https://analyzecore.com/2016/08/03/attribution-model-r-part-1

https://analyzecore.com/2016/08/03/attribution-model-r-part-2

                          3.3 To go further: Tackling selection biases with Quasi-Experiments

Exposure to certain types of advertisement is usually highly correlated to non-observable variables. Differences in the behaviour of users exposed to different campaigns may thus only be driven by core differences in converison probabilities between groups whether than by the campaign effect. These potential selection effects may bias the results obtained using historical data.

Quasi-Experiments can help correct this selection effect while still using available observationnal data.  These methods recreate the settings on a randomized setting. The goal is to come as close as possible to the ideal of comparing two populations that are identical in all respects except for the advertising exposure. However, populations might still differ with respect to some unobserved characteristics.

Common quasi-experimental methods used for instance in Public Policy Evaluation are:

  • Discontinuity Regressions
  • Matching Methods, such as Exact Matching,  Propensity-score matching or k-nearest neighbourghs.

References:

Article:

“Towards a digital Attribution Model: Measuring the impact of display advertising on online consumer behaviour”, Anindya Ghose & al, MIS Quarterly Vol. 40 No. 4, pp. 1-XX, 2016

https://pdfs.semanticscholar.org/4fa6/1c53f281fa63a9f0617fbd794d54911a2f84.pdf

        4. First Steps towards a Practical Implementation

Identify key points of interests

  • Identify the nature of touchpoints available: is the data based on clicks? If so, is there a way to complement the data with A/B tests to measure the influence of ads without clicks (display, video) ? For example, what happens to sales when display campaign is removed? Analysing this multiplier effect would give the overall responsibility of display on sales, to be deduced from current attribution values given to click-based channels. More interestingly, what is the impact of the removal of display campaign on the occurences of click-based campaigns ? This would give us an idea of the impact of display ads on the exposure to each other campaigns, which would help correct the attribution values more precisely at the campaign level.
  • Define the KPI to track. From a pure Marketing perspective, looking at purchases may be sufficient, but from a financial perspective looking at profits, though a bit more difficult to compute, may drive more interesting results.
  • Define a customer journey. It may seem obvious, but the notion needs to be clarified at first. Would it be defined by a time limit? If so, which one? Does it end when a conversion is observed? For example, if a customer makes 2 purchases, would the campaigns he’s been exposed to before the first order still be accounted for in the second order? If so, with a time decay?
  • Define the research framework: are we interested only in customer journeys which have led to conversions or in all journeys? Keep in mind that successful customer journeys are a non-representative sample of customer journeys. Models built on the analysis of biased samples may be conservative. Take an extreme example: 80% of customers who see campaign A buy the product, VS 1% for campaign B. However, campaign B exposure is great and 100 Million people see it VS only 1M for campaign A. An Attribution Model based on successful journeys will give higher credit to campaign B which is an auguable conclusion. Taking into account costs per campaign (in the case where costs are calculated by clicks) may of course tackle this issue partly, as campaign A could then exhibit higher returns, but a serious fallacious reasonning is at stake here.

Analyse the typical customer journey    

  • Performing a duration analysis on the data may help you improve the definition of the customer journey to be used by your organization. After which days are converison probabilities null? Should we consider the effect of campaigns disappears after x days without orders? For example, if 99% of orders are placed in the 30 days following a first click, it might be interesting to define the customer journey as a 30 days time frame following the first oder.
  • Look at the distribution of the number of campaigns in a typical journey. If you choose to calculate the effect of campaigns interraction in your Attribution Model, it may indeed help you determine the maximum number of campaigns to be included in a combination. Indeed, you may not need to assess the impact of channel combinations with above than 4 different channels if 95% of orders are placed after less then 4 campaigns.
  • Transition matrixes: what if a campaign A systematically leads to a campaign B? What happens if we remove A or B? These insights would give clues to ask precise questions for a latter AB test, for example to find out if there is complementarity between channels A and B – (implying none should be removed) or mere substitution (implying one can be given up).
  • If conversion rates are available: it can be interesting to perform a survival analysis i.e to analyse the likelihood of conversion based on duration since first click. This could help us excluse potential outliers or individuals who have very low conversion probabilities.

Summary

Attribution is a complex topic which will probably never be definitively solved. Indeed, a main issue is the difficulty, or even impossibility, to evaluate precisely the accuracy of the attribution model that we’ve built. Attribution Models should be seen as a good yet always improvable approximation of the incremental values of campaigns, and be presented with their intrinsinc limits and biases.