Simple RNN

Prerequisites for understanding RNN at a more mathematical level

Writing the A gentle introduction to the tiresome part of understanding RNN Article Series on recurrent neural network (RNN) is nothing like a creative or ingenious idea. It is quite an ordinary topic. But still I am going to write my own new article on this ordinary topic because I have been frustrated by lack of sufficient explanations on RNN for slow learners like me.

I think many of readers of articles on this website at least know that RNN is a type of neural network used for AI tasks, such as time series prediction, machine translation, and voice recognition. But if you do not understand how RNNs work, especially during its back propagation, this blog series is for you.

After reading this articles series, I think you will be able to understand RNN in more mathematical and abstract ways. But in case some of the readers are allergic or intolerant to mathematics, I tried to use as little mathematics as possible.

Ideal prerequisite knowledge:

  • Some understanding on densely connected layers (or fully connected layers, multilayer perception) and how their forward/back propagation work.
  •  Some understanding on structure of Convolutional Neural Network.

*In this article “Densely Connected Layers” is written as “DCL,” and “Convolutional Neural Network” as “CNN.”

1, Difficulty of Understanding RNN

I bet a part of difficulty of understanding RNN comes from the variety of its structures. If you search “recurrent neural network” on Google Image or something, you will see what I mean. But that cannot be helped because RNN enables a variety of tasks.

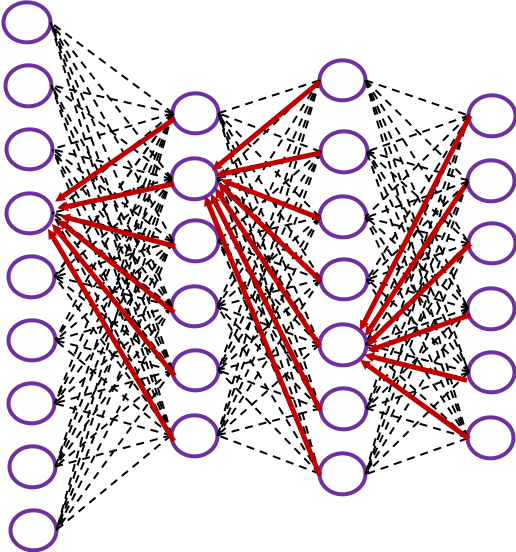
Another major difficulty of understanding RNN is understanding its back propagation algorithm. I think some of you found it hard to understand chain rules in calculating back propagation of densely connected layers, where you have to make the most of linear algebra. And I have to say backprop of RNN, especially LSTM, is a monster of chain rules. I am planing to upload not only a blog post on RNN backprop, but also a presentation slides with animations to make it more understandable, in some external links.

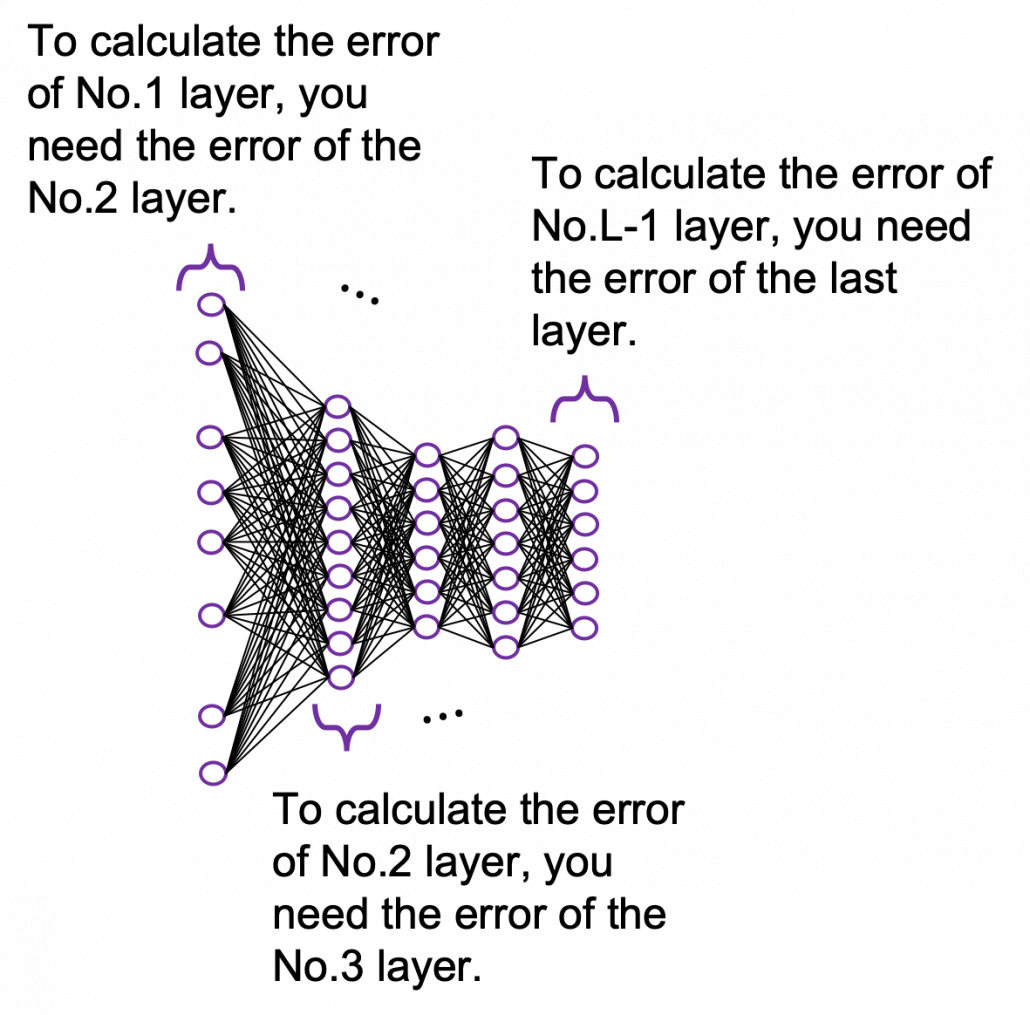
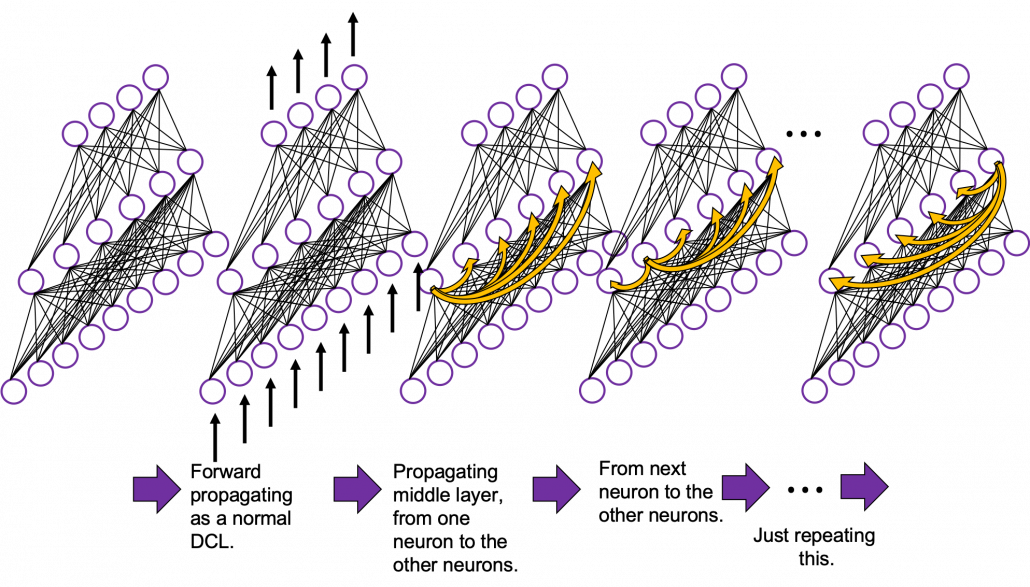
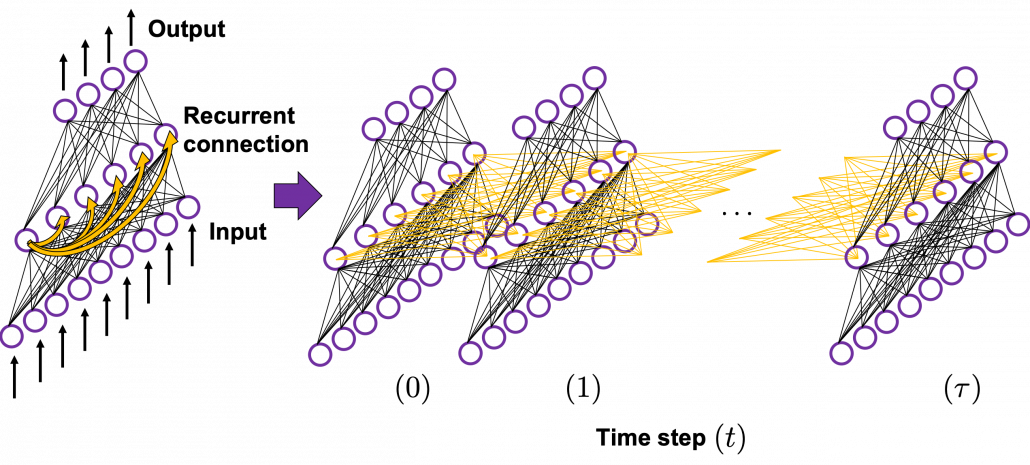
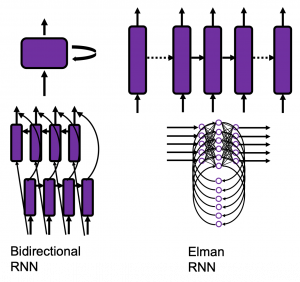
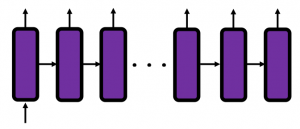
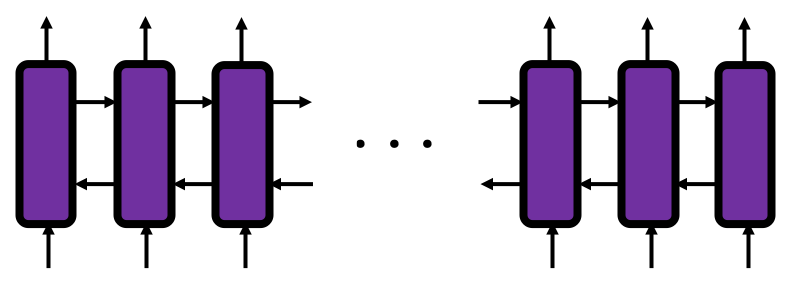
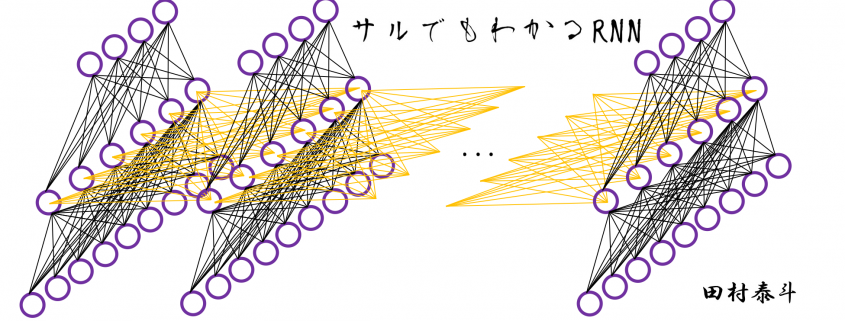
In order to avoid such confusions, I am going to introduce a very simplified type of RNN, which I call a “simple RNN.” The RNN displayed as the head image of this article is a simple RNN.

2, How Neurons are Connected

    \begin{equation*}   1 = 3 - 2 \end{equation*}

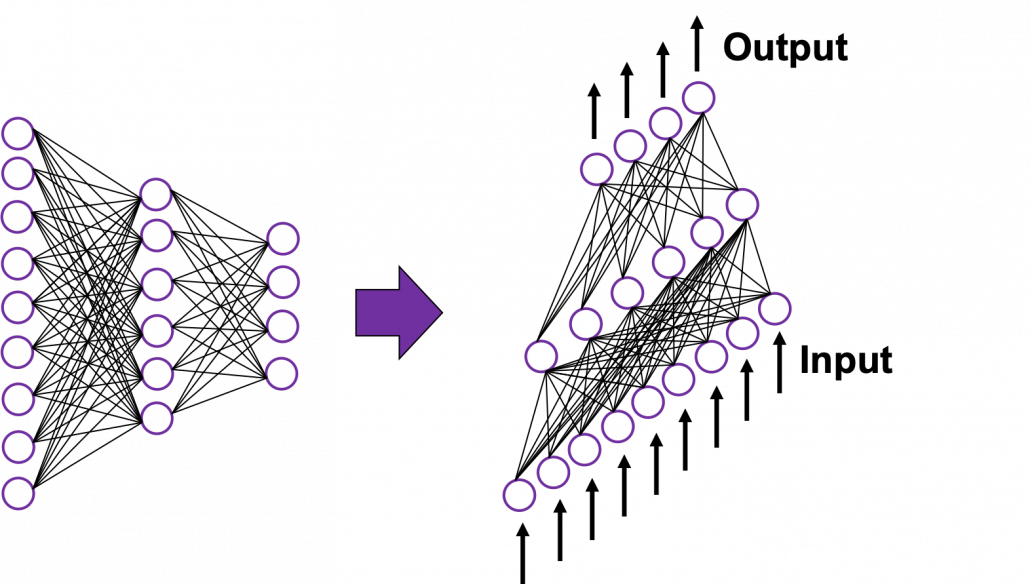
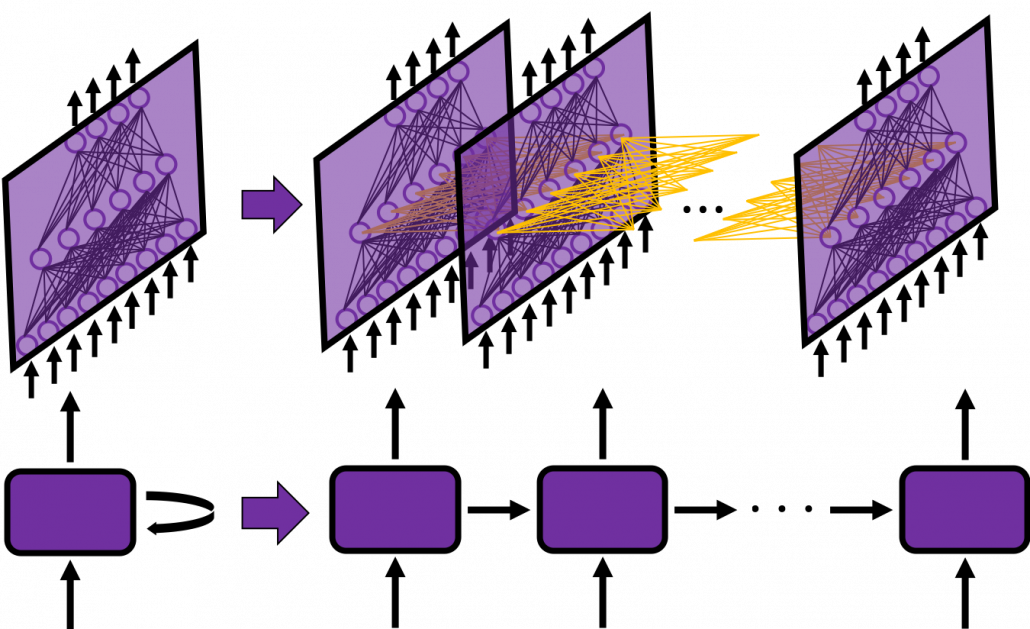
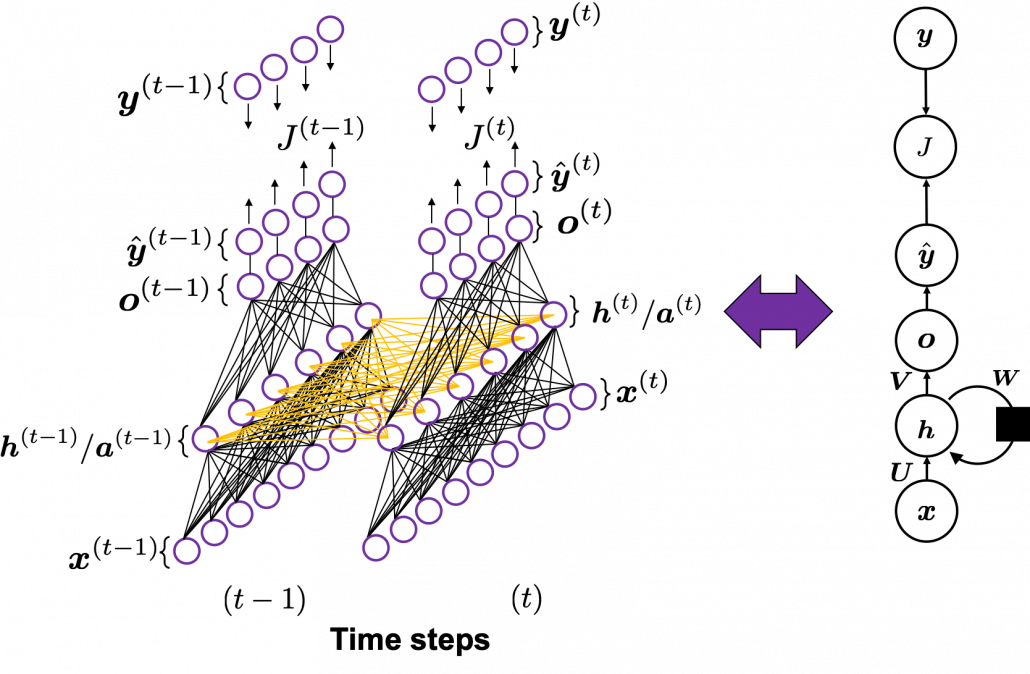
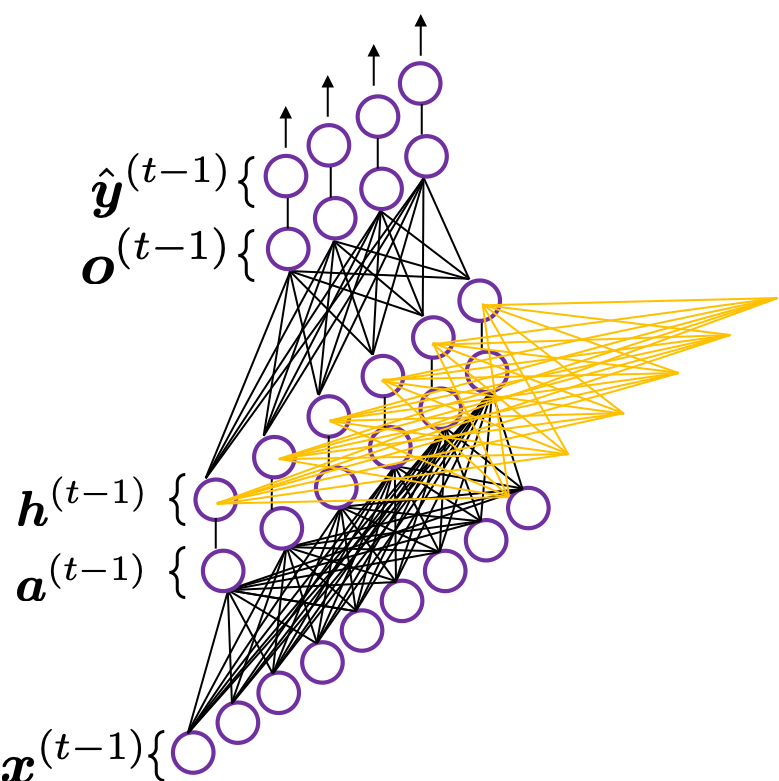
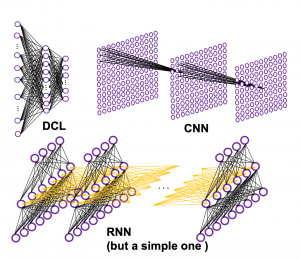
How to connect neurons and how to activate them is what neural networks are all about. Structures of those neurons are easy to grasp as long as that is about DCL or CNN. But when it comes to the structure of RNN, many study materials try to avoid showing that RNNs are also connections of neurons, as well as DCL or CNN(*If you are not sure how neurons are connected in CNN, this link should be helpful. Draw a random digit in the square at the corner.). In fact the structure of RNN is also the same, and as long as it is a simple RNN, and it is not hard to visualize its structure.

Even though RNN is also connections of neurons, usually most RNN charts are simplified, using blackboxes. In case of simple RNN, most study material would display it as the chart below.

But that also cannot be helped because fancier RNN have more complicated connections of neurons, and there are no longer advantages of displaying RNN as connections of neurons, and you would need to understand RNN in more abstract way, I mean, as you see in most of textbooks.

I am going to explain details of simple RNN in the next article of this series.

3, Neural Networks as Mappings

If you still think that neural networks are something like magical spider webs or models of brain tissues, forget that. They are just ordinary mappings.

If you have been allergic to mathematics in your life, you might have never heard of the word “mapping.” If so, at least please keep it in mind that the equation y=f(x), which most people would have seen in compulsory education, is a part of mapping. If you get a value x, you get a value y corresponding to the x.

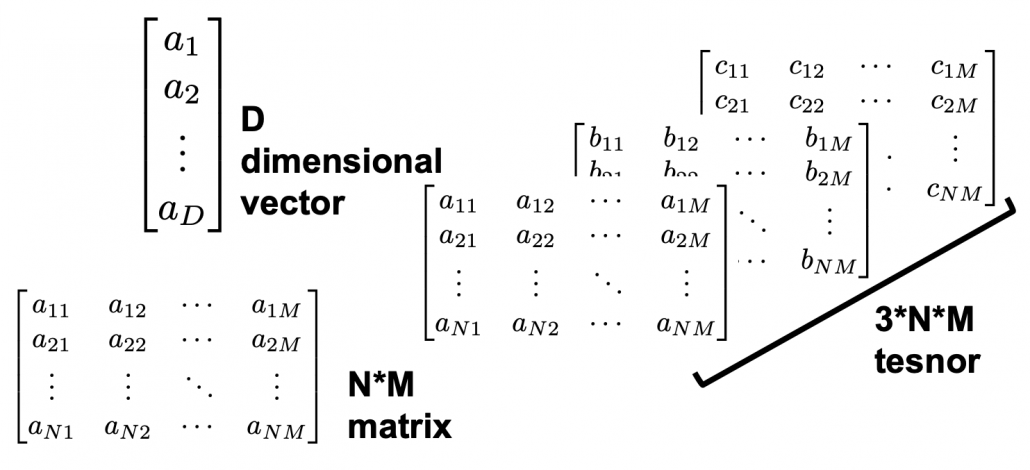
But in case of deep learning, x is a vector or a tensor, and it is denoted with \boldsymbol{x} . If you have never studied linear algebra , imagine that a vector is a column of Excel data (only one column), a matrix is a sheet of Excel data (with some rows and columns), and a tensor is some sheets of Excel data (each sheet does not necessarily contain only one column.)

CNNs are mainly used for image processing, so their inputs are usually image data. Image data are in many cases (3, hight, width) tensors because usually an image has red, blue, green channels, and the image in each channel can be expressed as a hight*width matrix (the “height” and the “width” are number of pixels, so they are discrete numbers).

The convolutional part of CNN (which I call “feature extraction part”) maps the tensors to a vector, and the last part is usually DCL, which works as classifier/regressor. At the end of the feature extraction part, you get a vector. I call it a “semantic vector” because the vector has information of “meaning” of the input image. In this link you can see maps of pictures plotted depending on the semantic vector. You can see that even if the pictures are not necessarily close pixelwise, they are close in terms of the “meanings” of the images.

In the example of a dog/cat classifier introduced by François Chollet, the developer of Keras, the CNN maps (3, 150, 150) tensors to 2-dimensional vectors, (1, 0) or (0, 1) for (dog, cat).

Wrapping up the points above, at least you should keep two points in mind: first, DCL is a classifier or a regressor, and CNN is a feature extractor used for image processing. And another important thing is, feature extraction parts of CNNs map images to vectors which are more related to the “meaning” of the image.

Importantly, I would like you to understand RNN this way. An RNN is also just a mapping.

*I recommend you to at least take a look at the beautiful pictures in this link. These pictures give you some insight into how CNN perceive images.

4, Problems of DCL and CNN, and needs for RNN

Taking an example of RNN task should be helpful for this topic. Probably machine translation is the most famous application of RNN, and it is also a good example of showing why DCL and CNN are not proper for some tasks. Its algorithms is out of the scope of this article series, but it would give you a good insight of some features of RNN. I prepared three sentences in German, English, and Japanese, which have the same meaning. Assume that each sentence is divided into some parts as shown below and that each vector corresponds to each part. In machine translation we want to convert a set of the vectors into another set of vectors.

Then let’s see why DCL and CNN are not proper for such task.

  • The input size is fixed: In case of the dog/cat classifier I have mentioned, even though the sizes of the input images varies, they were first molded into (3, 150, 150) tensors. But in machine translation, usually the length of the input is supposed to be flexible.
  • The order of inputs does not mater: In case of the dog/cat classifier the last section, even if the input is “cat,” “cat,” “dog” or “dog,” “cat,” “cat” there’s no difference. And in case of DCL, the network is symmetric, so even if you shuffle inputs, as long as you shuffle all of the input data in the same way, the DCL give out the same outcome . And if you have learned at least one foreign language, it is easy to imagine that the orders of vectors in sequence data matter in machine translation.

*It is said English language has phrase structure grammar, on the other hand Japanese language has dependency grammar. In English, the orders of words are important, but in Japanese as long as the particles and conjugations are correct, the orders of words are very flexible. In my impression, German grammar is between them. As long as you put the verb at the second position and the cases of the words are correct, the orders are also relatively flexible.

5, Sequence Data

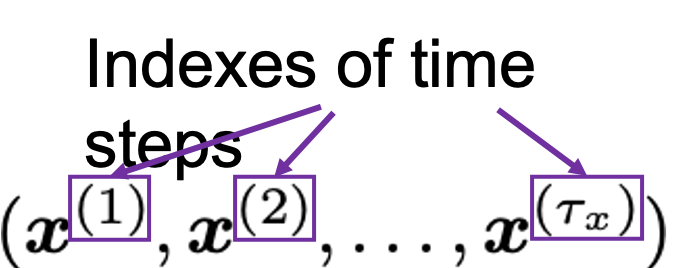
We can say DCL and CNN are not useful when you want to process sequence data. Sequence data are a type of data which are lists of vectors. And importantly, the orders of the vectors matter. The number of vectors in sequence data is usually called time steps. A simple example of sequence data is meteorological data measured at a spot every ten minutes, for instance temperature, air pressure, wind velocity, humidity. In this case the data is recorded as 4-dimensional vector every ten minutes.

But this “time step” does not necessarily mean “time.” In case of natural language processing (including machine translation), which you I mentioned in the last section, the numberings of each vector denoting each part of sentences are “time steps.”

And RNNs are mappings from a sequence data to another sequence data.

*At least I found a paper on the RNN’s capability of universal approximation on many-to-one RNN task. But I have not found any papers on universal approximation of many-to-many RNN tasks. Please let me know if you find any clue on whether such approximation is possible. I am desperate to know that. 

6, Types of RNN Tasks

RNN tasks can be classified into some types depending on the lengths of input/output sequences (the “length” means the times steps of input/output sequence data).

If you want to predict the temperature in 24 hours, based on several time series data points in the last 96 hours, the task is many-to-one. If you sample data every ten minutes, the input size is 96*6=574 (the input data is a list of 574 vectors), and the output size is 1 (which is a value of temperature). Another example of many-to-one task is sentiment classification. If you want to judge whether a post on SNS is positive or negative, the input size is very flexible (the length of the post varies.) But the output size is one, which is (1, 0) or (0, 1), which denotes (positive, negative).

*The charts in this section are simplified model of RNN used for each task. Please keep it in mind that they are not 100% correct, but I tried to make them as exact as possible compared to those in other study materials.

Music/text generation can be one-to-many tasks. If you give the first sound/word you can generate a phrase.

Next, let’s look at many-to-many tasks. Machine translation and voice recognition are likely to be major examples of many-to-many tasks, but here name entity recognition seems to be a proper choice. Name entity recognition is task of finding proper noun in a sentence . For example if you got two sentences “He said, ‘Teddy bears on sale!’ ” and ‘He said, “Teddy Roosevelt was a great president!” ‘ judging whether the “Teddy” is a proper noun or a normal noun is name entity recognition.

Machine translation and voice recognition, which are more popular, are also many-to-many tasks, but they use more sophisticated models. In case of machine translation, the inputs are sentences in the original language, and the outputs are sentences in another language. When it comes to voice recognition, the input is data of air pressure at several time steps, and the output is the recognized word or sentence. Again, these are out of the scope of this article but I would like to introduce the models briefly.

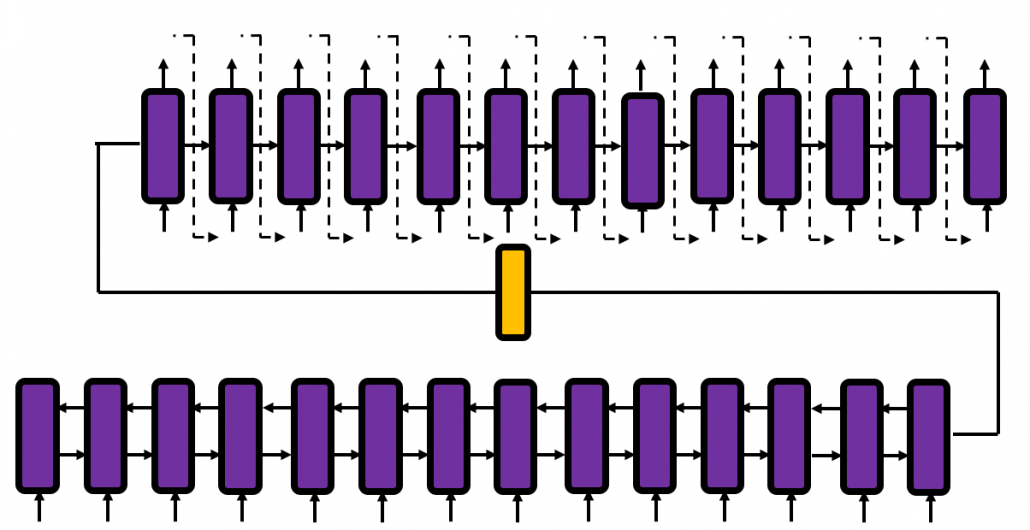
Machine translation uses a type of RNN named sequence-to-sequence model (which is often called seq2seq model). This model is also very important for other natural language processes tasks in general, such as text summarization. A seq2seq model is divided into the encoder part and the decoder part. The encoder gives out a hidden state vector and it used as the input of the decoder part. And decoder part generates texts, using the output of the last time step as the input of next time step.

Voice recognition is also a famous application of RNN, but it also needs a special type of RNN.

*To be honest, I don’t know what is the state-of-the-art voice recognition algorithm. The example in this article is a combination of RNN and a collapsing function made using Connectionist Temporal Classification (CTC). In this model, the output of RNN is much longer than the recorded words or sentences, so a collapsing function reduces the output into next output with normal length.

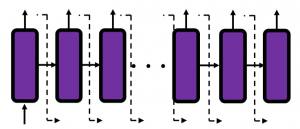
You might have noticed that RNNs in the charts above are connected in both directions. Depending on the RNN tasks you need such bidirectional RNNs.  I think it is also easy to imagine that such networks are necessary. Again, machine translation is a good example.

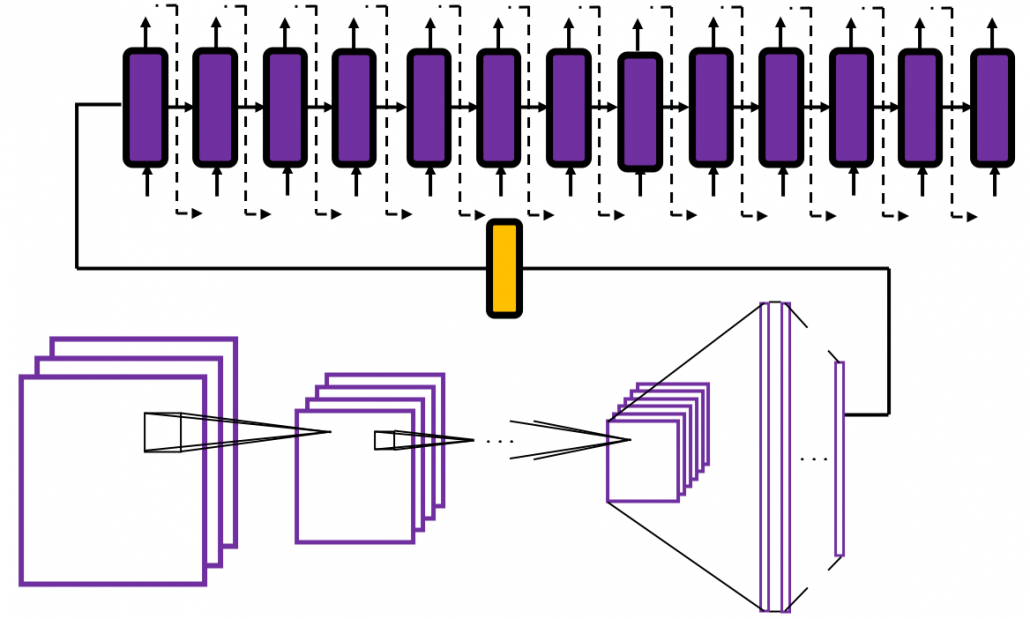
And interestingly, image captioning, which enables a computer to describe a picture, is one-to-many-task. As the output is a sentence, it is easy to imagine that the output is “many.” If it is a one-to-many task, the input is supposed to be a vector.

Where does the input come from? I told you that I was obsessed with the beauty of the last vector of the feature extraction part of CNN. Surprisingly the the “beautiful” vector, which I call a “semantic vector” is the input of image captioning task (after some transformations, depending on the network models).

I think this articles includes major things you need to know as prerequisites when you want to understand RNN at more mathematical level. In the next article, I would like to explain the structure of a simple RNN, and how it forward propagate.

* I make study materials on machine learning, sponsored by DATANOMIQ. I do my best to make my content as straightforward but as precise as possible. I include all of my reference sources. If you notice any mistakes in my materials, please let me know (email: yasuto.tamura@datanomiq.de). And if you have any advice for making my materials more understandable to learners, I would appreciate hearing it.

Six properties of modern Business Intelligence

Regardless of the industry in which you operate, you need information systems that evaluate your business data in order to provide you with a basis for decision-making. These systems are commonly referred to as so-called business intelligence (BI). In fact, most BI systems suffer from deficiencies that can be eliminated. In addition, modern BI can partially automate decisions and enable comprehensive analyzes with a high degree of flexibility in use.


Read this article in German:
“Sechs Eigenschaften einer modernen Business Intelligence“


Let us discuss the six characteristics that distinguish modern business intelligence, which mean taking technical tricks into account in detail, but always in the context of a great vision for your own company BI:

1. Uniform database of high quality

Every managing director certainly knows the situation that his managers do not agree on how many costs and revenues actually arise in detail and what the margins per category look like. And if they do, this information is often only available months too late.

Every company has to make hundreds or even thousands of decisions at the operational level every day, which can be made much more well-founded if there is good information and thus increase sales and save costs. However, there are many source systems from the company’s internal IT system landscape as well as other external data sources. The gathering and consolidation of information often takes up entire groups of employees and offers plenty of room for human error.

A system that provides at least the most relevant data for business management at the right time and in good quality in a trusted data zone as a single source of truth (SPOT). SPOT is the core of modern business intelligence.

In addition, other data on BI may also be made available which can be useful for qualified analysts and data scientists. For all decision-makers, the particularly trustworthy zone is the one through which all decision-makers across the company can synchronize.

2. Flexible use by different stakeholders

Even if all employees across the company should be able to access central, trustworthy data, with a clever architecture this does not exclude that each department receives its own views of this data. Many BI systems fail due to company-wide inacceptance because certain departments or technically defined employee groups are largely excluded from BI.

Modern BI systems enable views and the necessary data integration for all stakeholders in the company who rely on information and benefit equally from the SPOT approach.

3. Efficient ways to expand (time to market)

The core users of a BI system are particularly dissatisfied when the expansion or partial redesign of the information system requires too much of patience. Historically grown, incorrectly designed and not particularly adaptable BI systems often employ a whole team of IT staff and tickets with requests for change requests.

Good BI is a service for stakeholders with a short time to market. The correct design, selection of software and the implementation of data flows / models ensures significantly shorter development and implementation times for improvements and new features.

Furthermore, it is not only the technology that is decisive, but also the choice of organizational form, including the design of roles and responsibilities – from the technical system connection to data preparation, pre-analysis and support for the end users.

4. Integrated skills for Data Science and AI

Business intelligence and data science are often viewed and managed separately from each other. Firstly, because data scientists are often unmotivated to work with – from their point of view – boring data models and prepared data. On the other hand, because BI is usually already established as a traditional system in the company, despite the many problems that BI still has today.

Data science, often referred to as advanced analytics, deals with deep immersion in data using exploratory statistics and methods of data mining (unsupervised machine learning) as well as predictive analytics (supervised machine learning). Deep learning is a sub-area of ​​machine learning and is used for data mining or predictive analytics. Machine learning is a sub-area of ​​artificial intelligence (AI).

In the future, BI and data science or AI will continue to grow together, because at the latest after going live, the prediction models flow back into business intelligence. BI will probably develop into ABI (Artificial Business Intelligence). However, many companies are already using data mining and predictive analytics in the company, using uniform or different platforms with or without BI integration.

Modern BI systems also offer data scientists a platform to access high-quality and more granular raw data.

5. Sufficiently high performance

Most readers of these six points will probably have had experience with slow BI before. It takes several minutes to load a daily report to be used in many classic BI systems. If loading a dashboard can be combined with a little coffee break, it may still be acceptable for certain reports from time to time. At the latest, however, with frequent use, long loading times and unreliable reports are no longer acceptable.

One reason for poor performance is the hardware, which can be almost linearly scaled to higher data volumes and more analysis complexity using cloud systems. The use of cloud also enables the modular separation of storage and computing power from data and applications and is therefore generally recommended, but not necessarily the right choice for all companies.

In fact, performance is not only dependent on the hardware, the right choice of software and the right choice of design for data models and data flows also play a crucial role. Because while hardware can be changed or upgraded relatively easily, changing the architecture is associated with much more effort and BI competence. Unsuitable data models or data flows will certainly bring the latest hardware to its knees in its maximum configuration.

6. Cost-effective use and conclusion

Professional cloud systems that can be used for BI systems offer total cost calculators, such as Microsoft Azure, Amazon Web Services and Google Cloud. With these computers – with instruction from an experienced BI expert – not only can costs for the use of hardware be estimated, but ideas for cost optimization can also be calculated. Nevertheless, the cloud is still not the right solution for every company and classic calculations for on-premise solutions are necessary.

Incidentally, cost efficiency can also be increased with a good selection of the right software. Because proprietary solutions are tied to different license models and can only be compared using application scenarios. Apart from that, there are also good open source solutions that can be used largely free of charge and can be used for many applications without compromises.

However, it is wrong to assess the cost of a BI only according to its hardware and software costs. A significant part of cost efficiency is complementary to the aspects for the performance of the BI system, because suboptimal architectures work wastefully and require more expensive hardware than neatly coordinated architectures. The production of the central data supply in adequate quality can save many unnecessary processes of data preparation and many flexible analysis options also make redundant systems unnecessary and lead to indirect savings.

In any case, a BI for companies with many operational processes is always cheaper than no BI. However, if you take a closer look with BI expertise, cost efficiency is often possible.

Interview – Predictive Maintenance and how it can unleash cost savings

Interview with Dr. Kai Goebel, Principal Scientist at PARC, a Xerox Company, about Predictive Maintenance and how it can unleash cost savings.

Dr. Kai Goebel is principal scientist as PARC with more than two decades experience in corporate and government research organizations. He is responsible for leading applied research on state awareness, prognostics and decision-making using data analytics, AI, hybrid methods and physics-base methods. He has also fielded numerous applications for Predictive Maintenance at General Electric, NASA, and PARC for uses as diverse as rocket launchpads, jet engines, and chemical plants.

Data Science Blog: Mr. Goebel, predictive maintenance is not just a hype since industrial companies are already trying to establish this use case of predictive analytics. What benefits do they really expect from it?

Predictive Maintenance is a good example for how value can be realized from analytics. The result of the analytics drives decisions about when to schedule maintenance in advance of an event that might cause unexpected shutdown of the process line. This is in contrast to an uninformed process where the decision is mostly reactive, that is, maintenance is scheduled because equipment has already failed. It is also in contrast to a time-based maintenance schedule. The benefits of Predictive Maintenance are immediately clear: one can avoid unexpected downtime, which can lead to substantial production loss. One can manage inventory better since lead times for equipment replacement can be managed well. One can also manage safety better since equipment health is understood and safety averse situations can potentially be avoided. Finally, maintenance operations will be inherently more efficient as they shift significant time from inspection to mitigation of.

Data Science Blog: What are the most critical success factors for implementing predictive maintenance?

Critical for success is to get the trust of the operator. To that end, it is imperative to understand the limitations of the analytics approach and to not make false performance promises. Often, success factors for implementation hinge on understanding the underlying process and the fault modes reasonably well. It is important to be able to recognize the difference between operational changes and abnormal conditions. It is equally important to recognize rare events reliably while keeping false positives in check.

Data Science Blog: What kind of algorithm does predictive maintenance work with? Do you differentiate between approaches based on classical machine learning and those based on deep learning?

Well, there is no one kind of algorithm that works for Predictive Mantenance everywhere. Instead, one should look at the plurality of all algorithms as tools in a toolbox. Then analyze the problem – how many examples for run-to-failure trajectories are there; what is the desired lead time to report on a problem; what is the acceptable false positive/false negative rate; what are the different fault modes; etc – and use the right kind of tool to do the job. Just because a particular approach (like the one you mentioned in your question) is all the hype right now does not mean it is the right tool for the problem. Sometimes, approaches from what you call “classical machine learning” actually work better. In fact, one should consider approaches even outside the machine learning domain, either as stand-alone approach as in a hybrid configuration. One may also have to invent new methods, for example to perform online learning of the dynamic changes that a system undergoes through its (long) life. In the end, a customer does not care about what approach one is using, only if it solves the problem.

Data Science Blog: There are several providers for predictive analytics software. Is it all about software tools? What makes the difference for having success?

Frequently, industrial partners lament that they have to spend a lot of effort in teaching a new software provider about the underlying industrial processes as well as the equipment and their fault modes. Others are tired of false promises that any kind of data (as long as you have massive amounts of it) can produce any kind of performance. If one does not physically sense a certain modality, no algorithmic magic can take place. In other words, it is not just all about the software. The difference for having success is understanding that there is no cookie cutter approach. And that realization means that one may have to role up the sleeves and to install new instrumentation.

Data Science Blog: What are coming trends? What do you think will be the main topic 2020 and 2021?

Predictive Maintenance is slowly evolving towards Prescriptive Maintenance. Here, one does not only seek to inform about an impending problem, but also what to do about it. Such an approach needs to integrate with the logistics element of an organization to find an optimal decision that trades off several objectives with regards to equipment uptime, process quality, repair shop loading, procurement lead time, maintainer availability, safety constraints, contractual obligations, etc.

How Important is Customer Lifetime Value?

This is the third article of article series Getting started with the top eCommerce use cases. If you are interested in reading the first article you can find it here.

Customer Lifetime Value

Many researches have shown that cost for acquiring a new customer is higher than the cost of retention of an existing customer which makes Customer Lifetime Value (CLV or LTV) one of the most important KPI’s. Marketing is about building a relationship with your customer and quality service matters a lot when it comes to customer retention. CLV is a metric which determines the total amount of money a customer is expected to spend in your business.

CLV allows marketing department of the company to understand how much money a customer is going  to spend over their  life cycle which helps them to determine on how much the company should spend to acquire each customer. Using CLV a company can better understand their customer and come up with different strategies either to retain their existing customers by sending them personalized email, discount voucher, provide them with better customer service etc. This will help a company to narrow their focus on acquiring similar customers by applying customer segmentation or look alike modeling.

One of the main focus of every company is Growth in this competitive eCommerce market today and price is not the only factor when a customer makes a decision. CLV is a metric which revolves around a customer and helps to retain valuable customers, increase revenue from less valuable customers and improve overall customer experience. Don’t look at CLV as just one metric but the journey to calculate this metric involves answering some really important questions which can be crucial for the business. Metrics and questions like:

  1. Number of sales
  2. Average number of times a customer buys
  3. Full Customer journey
  4. How many marketing channels were involved in one purchase?
  5. When the purchase was made?
  6. Customer retention rate
  7. Marketing cost
  8. Cost of acquiring a new customer

and so on are somehow associated with the calculation of CLV and exploring these questions can be quite insightful. Lately, a lot of companies have started to use this metric and shift their focuses in order to make more profit. Amazon is the perfect example for this, in 2013, a study by Consumers Intelligence Research Partners found out that prime members spends more than a non-prime member. So Amazon started focusing on Prime members to increase their profit over the past few years. The whole article can be found here.

How to calculate CLV?

There are several methods to calculate CLV and few of them are listed below.

Method 1: By calculating average revenue per customer


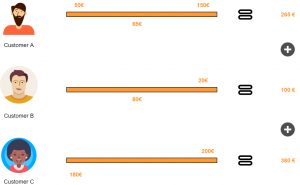
Figure 1: Using average revenue per customer


Let’s suppose three customers brought 745€ as profit to a company over a period of 2 months then:

CLV (2 months) = Total Profit over a period of time / Number of Customers over a period of time

CLV (2 months) = 745 / 3 = 248 €

Now the company can use this to calculate CLV for an year however, this is a naive approach and works only if the preferences of the customer are same for the same period of time. So let’s explore other approaches.

Method 2

This method requires to first calculate KPI’s like retention rate and discount rate.


CLV = Gross margin per lifespan ( Retention rate per month / 1 + Discount rate – Retention rate per month)

Where

Retention rate = Customer at the end of the month – Customer during the month / Customer at the beginning of the month ) * 100

Method 3

This method will allow us to look at other metrics also and can be calculated in following steps:

  1. Calculate average number of transactions per month (T)
  2. Calculate average order value (OV)
  3. Calculate average gross margin (GM)
  4. Calculate customer lifespan in months (ALS)

After calculating these metrics CLV can be calculated as:


CLV = T*OV*GM*ALS / No. of Clients for the period

where

Transactions (T) = Total transactions / Period

Average order value (OV) = Total revenue / Total orders

Gross margin (GM) = (Total revenue – Cost of sales/ Total revenue) * 100 [but how you calculate cost of sales is debatable]

Customer lifespan in months (ALS) = 1 / Churn Rate %


CLV can be calculated using any of the above mentioned methods depending upon how robust your company wants the analysis to be. Some companies are also using Machine learning models to predict CLV, maybe not directly but they use ML models to predict customer churn rate, retention rate and other marketing KPI’s. Some companies take advantage of all the methods by taking an average at the end.

5 Applications for Location-Based Data in 2020

Location-based data enables giving people relevant information based on where they are at any given moment. Here are five location data applications to look for in 2020 and beyond. 

1. Increasing Sales and Reducing Frustration

One 2019 report indicated that 89% of the marketers who used geo data saw increased sales within their customer bases. Sometimes, the ideal way to boost sales is to convert what would be a frustration into something positive. 

A French campaign associated with the Actimel yogurt brand achieved this by sending targeted, encouraging messages to drivers who used the Waze navigation app and appeared to have made a wrong turn or got caught in traffic. 

For example, a driver might get a message that said, “Instead of getting mad and honking your horn, pump up the jams! #StayStrong.” The three-month campaign saw a 140% increase in ad recall. 

More recently, home furnishing brand IKEA launched a campaign in Dubai where people can get free stuff for making a long trip to a store. The freebies get more valuable as a person’s commute time increases. The catch is that participants have to activate location settings on their phones and enable Google Maps. Driving five minutes to a store got a person a free veggie hot dog, and they’d get a complimentary table for traveling 49 minutes. 

2. Offering Tailored Ad Targeting in Medical Offices

Pharmaceutical companies are starting to rely on companies that send targeted ads to patients connected to the Wi-Fi in doctors’ offices. One such provider is Semcasting. A recent effort involved sending ads to cardiology offices for a type of drug that lowers cholesterol levels in the blood. 

The company has taken a similar approach for an over-the-counter pediatric drug and a medication to relieve migraine headaches, among others. Such initiatives cause a 10% boost in the halo effect, plus a 1.5% uptick in sales. The first perk relates to the favoritism that people feel towards other products a company makes once they like one of them.

However, location data applications related to health care arguably require special attention regarding privacy. Patients may feel uneasy if they believe that companies are watching them and know they need a particular kind of medical treatment. 

3. Facilitating the Deployment of the 5G Network

The 5G network is coming soon, and network operators are working hard to roll it out. Statistics indicate that the 5G infrastructure investment will total $275 billion over seven years. Geodata can help network brands decide where to deploy 5G connectivity first.

Moreover, once a company offers 5G in an area, marketing teams can use location data to determine which neighborhoods to target when contacting potential customers. Most companies that currently have 5G within their product lineups have carefully chosen which areas are at the top of the list to receive 5G, and that practice will continue throughout 2020. 

It’s easy to envision a scenario whereby people can send error reports to 5G providers by using location data. For example, a company could say that having location data collection enabled on a 5G-powered smartphone allows a technician to determine if there’s a persistent problem with coverage.

Since the 5G network is still, it’s impossible to predict all the ways that a telecommunications operator might use location data to make their installations maximally profitable. However, the potential is there for forward-thinking brands to seize. 

4. Helping People Know About the Events in Their Areas

SoundHound, Inc. and Wcities recently announced a partnership that will rely on location-based data to keep people in the loop about upcoming local events. People can use a conversational intelligence platform that has information about more than 20,000 cities around the world. 

Users also don’t need to mention their locations in voice queries. They could say, for example, “Which bands are playing downtown tonight?” or “Can you give me some events happening on the east side tomorrow?” They can also ask something associated with a longer timespan, such as “Are there any wine festivals happening this month?”

People can say follow-up commands, too. They might ask what the weather forecast is after hearing about an outdoor event they want to attend. The system also supports booking an Uber, letting people get to the happening without hassles. 

5. Using Location-Based Data for Matchmaking

In honor of Valentine’s Day 2020, students from more than two dozen U.S colleges signed up for a matchmaking opportunity. It, at least in part, uses their location data to work. 

Participants answer school-specific questions, and their responses help them find a friend or something more. The platform uses algorithms to connect people with like-minded individuals. 

However, the company that provides the service can also give a breakdown of which residence halls have the most people taking part, or whether people generally live off-campus. This example is not the first time a university used location data by any means, but it’s different from the usual approach. 

Location Data Applications Abound

These five examples show there are no limits to how a company might use location data. However, they must do so with care, protecting user privacy while maintaining a high level of data quality. 

Integrate Unstructured Data into Your Enterprise to Drive Actionable Insights

In an ideal world, all enterprise data is structured – classified neatly into columns, rows, and tables, easily integrated and shared across the organization.

The reality is far from it! Datamation estimates that unstructured data accounts for more than 80% of enterprise data, and it is growing at a rate of 55 – 65 percent annually. This includes information stored in images, emails, spreadsheets, etc., that cannot fit into databases.

Therefore, it becomes imperative for a data-driven organization to leverage their non-traditional information assets to derive business value. We have outlined a simple 3-step process that can help organizations integrate unstructured sources into their data eco-system:

1. Determine the Challenge

The primary step is narrowing down the challenges you want to solve through the unstructured data flowing in and out of your organization. Financial organizations, for instance, use call reports, sales notes, or other text documents to get real-time insights from the data and make decisions based on the trends. Marketers make use of social media data to evaluate their customers’ needs and shape their marketing strategy.

Figuring out which process your organization is trying to optimize through unstructured data can help you reach your goal faster.

2. Map Out the Unstructured Data Sources Within the Enterprise

An actionable plan starts with identifying the range of data sources that are essential to creating a truly integrated environment. This enables organizations to align the sources with business objectives and streamline their data initiatives.

Deciding which data should be extracted, analyzed, and stored should be a primary concern in this regard. Even if you can ingest data from any source, it doesn’t mean that you should.

Collecting a large volume of unstructured data is not enough to generate insights. It needs to be properly organized and validated for quality before integration. Full, incremental, online, and offline extraction methods are generally used to mine valuable information from unstructured data sources.

3. Transform Unstructured Assets into Decision-Ready Insights

Now that you have all the puzzle pieces, the next step is to create a complete picture. This may require making changes in your organization’s infrastructure to derive meaning from your unstructured assets and get a 360-degree business view.

IDC recommends creating a company culture that promotes the collection, use, and sharing of both unstructured and structured business assets. Therefore, finding an enterprise-grade integration solution that offers enhanced connectivity to a range of data sources, ideally structured, unstructured, and semi-structured, can help organizations generate the most value out of their data assets.

Automation is another feature that can help speed up integration processes, minimize error probability, and generate time-and-cost savings. Features like job scheduling, auto-mapping, and workflow automation can optimize the process of extracting information from XML, JSON, Excel or audio files, and storing it into a relational database or generating insights.

The push to become a data-forward organization has enterprises re-evaluating the way to leverage unstructured data assets for decision-making. With an actionable plan in place to integrate these sources with the rest of the data, organizations can take advantage of the opportunities offered by analytics and stand out from the competition.

Introduction to Recommendation Engines

This is the second article of article series Getting started with the top eCommerce use cases. If you are interested in reading the first article you can find it here.

What are Recommendation Engines?

Recommendation engines are the automated systems which helps select out similar things whenever a user selects something online. Be it Netflix, Amazon, Spotify, Facebook or YouTube etc. All of these companies are now using some sort of recommendation engine to improve their user experience. A recommendation engine not only helps to predict if a user prefers an item or not but also helps to increase sales, ,helps to understand customer behavior, increase number of registered users and helps a user to do better time management. For instance Netflix will suggest what movie you would want to watch or Amazon will suggest what kind of other products you might want to buy. All the mentioned platforms operates using the same basic algorithm in the background and in this article we are going to discuss the idea behind it.

What are the techniques?

There are two fundamental algorithms that comes into play when there’s a need to generate recommendations. In next section these techniques are discussed in detail.

Content-Based Filtering

The idea behind content based filtering is to analyse a set of features which will provide a similarity between items themselves i.e. between two movies, two products or two songs etc. These set of features once compared gives a similarity score at the end which can be used as a reference for the recommendations.

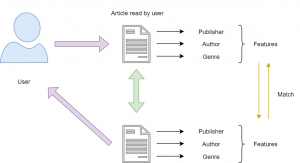
There are several steps involved to get to this similarity score and the first step is to construct a profile for each item by representing some of the important features of that item. In other terms, this steps requires to define a set of characteristics that are discovered easily. For instance, consider that there’s an article which a user has already read and once you know that this user likes this article you may want to show him recommendations of similar articles. Now, using content based filtering technique you could find the similar articles. The easiest way to do that is to set some features for this article like publisher, genre, author etc. Based on these features similar articles can be recommended to the user (as illustrated in Figure 1). There are three main similarity measures one could use to find the similar articles mentioned below.


Figure 1: Content-Based Filtering


Minkowski distance

Minkowski distance between two variables can be calculated as:

(x,y)= (\sum_{i=1}^{n}{|X_{i} - Y_{i}|^{p}})^{1/p}


Cosine Similarity

Cosine similarity between two variables can be calculated as :

  \mbox{Cosine Similarity} = \frac{\sum_{i=1}^{n}{x_{i} y_{i}}} {\sqrt{\sum_{i=1}^{n}{x_{i}^{2}}} \sqrt{\sum_{i=1}^{n}{y_{i}^{2}}}} \


Jaccard Similarity


  J(X,Y) = |X ∩ Y| / |X ∪ Y|


These measures can be used to create a matrix which will give you the similarity between each movie and then a function can be defined to return the top 10 similar articles.


Collaborative filtering

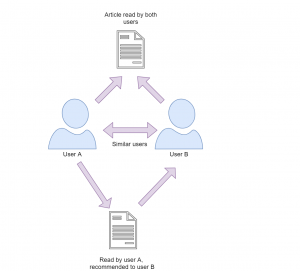
This filtering method focuses on finding how similar two users or two products are by analyzing user behavior or preferences rather than focusing on the content of the items. For instance consider that there are three users A,B and C.  We want to recommend some movies to user A, our first approach would be to find similar users and compare which movies user A has not yet watched and recommend those movies to user A.  This approach where we try to find similar users is called as User-User Collaborative Filtering.  

The other approach that could be used here is when you try to find similar movies based on the ratings given by others, this type is called as Item-Item Collaborative Filtering. The research shows that item-item collaborative filtering works better than user-user collaborative filtering as user behavior is really dynamic and changes over time. Also, there are a lot more users and increasing everyday but on the other side item characteristics remains the same. To calculate the similarities we can use Cosine distance.


Figure 2: Collaborative Filtering


Recently some companies have started to take advantage of both content based and collaborative filtering techniques to make a hybrid recommendation engine. The results from both models are combined into one hybrid model which provides more accurate recommendations. Five steps are involved to make a recommendation engine work which are collection of data, storing of data, analyzing the data, filtering the data and providing recommendations. There are a lot of attributes that are involved in order to collect user data including browsing history, page views, search logs, order history, marketing channel touch points etc. which requires a strong data architecture.  The collection of data is pretty straightforward but it can be overwhelming to analyze this amount of data. Storing this data could get tricky on the other hand as you need a scalable database for this kind of data. With the rise of graph databases this area is also improving for many use cases including recommendation engines. Graph databases like Neo4j can also help to analyze and find similar users and relationship among them. Analyzing the data can be carried in different ways, depending on how strong and scalable your architecture you can run real time, batch or near real time analysis. The fourth step involves the filtering of the data and here you can use any of the above mentioned approach to find similarities to finally provide the recommendations.

Having a good recommendation engine can be time consuming initially but it is definitely beneficial in the longer run. It not only helps to generate revenue but also helps to to improve your product catalog and customer service.

Python vs R: Which Language to Choose for Deep Learning?

Data science is increasingly becoming essential for every business to operate efficiently in this modern world. This influences the processes composed together to obtain the required outputs for clients. While machine learning and deep learning sit at the core of data science, the concepts of deep learning become essential to understand as it can help increase the accuracy of final outputs. And when it comes to data science, R and Python are the most popular programming languages used to instruct the machines.

Python and R: Primary Languages Used for Deep Learning

Deep learning and machine learning differentiate based on the input data type they use. While machine learning depends upon the structured data, deep learning uses neural networks to store and process the data during the learning. Deep learning can be described as the subset of machine learning, where the data to be processed is defined in another structure than a normal one.

R is developed specifically to support the concepts and implementation of data science and hence, the support provided by this language is incredible as writing codes become much easier with its simple syntax.

Python is already much popular programming language that can serve more than one development niche without straining even for a bit. The implementation of Python for programming machine learning algorithms is very much popular and the results provided are accurate and faster than any other language. (C or Java). And because of its extended support for data science concept implementation, it becomes a tough competitor for R.

However, if we compare the charts of popularity, Python is obviously more popular among data scientists and developers because of its versatility and easier usage during algorithm implementation. However, R outruns Python when it comes to the packages offered to developers specifically expertise in R over Python. Therefore, to conclude which one of them is the best, let’s take an overview of the features and limits offered by both languages.

Python

Python was first introduced by Guido Van Rossum who developed it as the successor of ABC programming language. Python puts white space at the center while increasing the readability of the developed code. It is a general-purpose programming language that simply extends support for various development needs.

The packages of Python includes support for web development, software development, GUI (Graphical User Interface) development and machine learning also. Using these packages and putting the best development skills forward, excellent solutions can be developed. According to Stackoverflow, Python ranks at the fourth position as the most popular programming language among developers.

Benefits for performing enhanced deep learning using Python are:

  • Concise and Readable Code
  • Extended Support from Large Community of Developers
  • Open-source Programming Language
  • Encourages Collaborative Coding
  • Suitable for small and large-scale products

The latest and stable version of Python has been released as Python 3.8.0 on 14th October 2019. Developing a software solution using Python becomes much easier as the extended support offered through the packages drives better development and answers every need.

R

R is a language specifically used for the development of statistical software and for statistical data analysis. The primary user base of R contains statisticians and data scientists who are analyzing data. Supported by R Foundation for statistical computing, this language is not suitable for the development of websites or applications. R is also an open-source environment that can be used for mining excessive and large amounts of data.

R programming language focuses on the output generation but not the speed. The execution speed of programs written in R is comparatively lesser as producing required outputs is the aim not the speed of the process. To use R in any development or mining tasks, it is required to install its operating system specific binary version before coding to run the program directly into the command line.

R also has its own development environment designed and named RStudio. R also involves several libraries that help in crafting efficient programs to execute mining tasks on the provided data.

The benefits offered by R are pretty common and similar to what Python has to offer:

  • Open-source programming language
  • Supports all operating systems
  • Supports extensions
  • R can be integrated with many of the languages
  • Extended Support for Visual Data Mining

Although R ranks at the 17th position in Stackoverflow’s most popular programming language list, the support offered by this language has no match. After all, the R language is developed by statisticians for statisticians!

Python vs R: Should They be Really Compared?

Even when provided with the best technical support and efficient tools, a developer will not be able to provide quality outputs if he/she doesn’t possess the required skills. The point here is, technical skills rank higher than the resources provided. A comparison of these two programming languages is not advisable as they both hold their own set of advantages. However, the developers considering to use both together are less but they obtain maximum benefit from the process.

Both these languages have some features in common. For example, if a representative comes asking you if you lend technical support for developing an uber clone, you are directly going to decline as Python and R both do not support mobile app development. To benefit the most and develop excellent solutions using both these programming languages, it is advisable to stop comparing and start collaborating!

R and Python: How to Fit Both In a Single Program

Anticipating the future needs of the development industry, there has been a significant development to combine these both excellent programming languages into one. Now, there are two approaches to performing this: either we include R script into Python code or vice versa.

Using the available interfaces, packages and extended support from Python we can include R script into the code and enhance the productivity of Python code. Availability of PypeR, pyRserve and more resources helps run these two programming languages efficiently while efficiently performing the background work.

Either way, using the developed functions and packages made available for integrating Python in R are also effective at providing better results. Available R packages like rJython, rPython, reticulate, PythonInR and more, integrating Python into R language is very easy.

Therefore, using the development skills at their best and maximizing the use of such amazing resources, Python and R can be togetherly used to enhance end results and provide accurate deep learning support.

Conclusion

Python and R both are great in their own names and own places. However, because of the wide applications of Python in almost every operation, the annual packages offered to Python developers are less than the developers skilled in using R. However, this doesn’t justify the usability of R. The ultimate decision of choosing between these two languages depends upon the data scientists or developers and their mining requirements.

And if a developer or data scientist decides to develop skills for both- Python and R-based development, it turns out to be beneficial in the near future. Choosing any one or both to use in your project depends on the project requirements and expert support on hand.

Multi-touch attribution: A data-driven approach

Customers shopping behavior has changed drastically when it comes to online shopping, as nowadays, customer likes to do a thorough market research about a product before making a purchase.

What is Multi-touch attribution?

This makes it really hard for marketers to correctly determine the contribution for each marketing channel to which a customer was exposed to. The path a customer takes from his first search to the purchase is known as a Customer Journey and this path consists of multiple marketing channels or touchpoints. Therefore, it is highly important to distribute the budget between these channels to maximize return. This problem is known as multi-touch attribution problem and the right attribution model helps to steer the marketing budget efficiently. Multi-touch attribution problem is well known among marketers. You might be thinking that if this is a well known problem then there must be an algorithm out there to deal with this. Well, there are some traditional models  but every model has its own limitation which will be discussed in the next section.

Types of attribution models

Most of the eCommerce companies have a performance marketing department to make sure that the marketing budget is spent in an agile way. There are multiple heuristics attribution models pre-existing in google analytics however there are several issues with each one of them. These models are:

Traditional attribution models

First touch attribution model

100% credit is given to the first channel as it is considered that the first marketing channel was responsible for the purchase.

Figure 1: First touch attribution model

Last touch attribution model

100% credit is given to the last channel as it is considered that the first marketing channel was responsible for the purchase.

Figure 2: Last touch attribution model

Linear-touch attribution model

In this attribution model, equal credit is given to all the marketing channels present in customer journey as it is considered that each channel is equally responsible for the purchase.

Figure 3: Linear attribution model

U-shaped or Bath tub attribution model

This is most common in eCommerce companies, this model assigns 40% to first and last touch and 20% is equally distributed among the rest.

Figure 4: Bathtub or U-shape attribution model

Data driven attribution models

Traditional attribution models follows somewhat a naive approach to assign credit to one or all the marketing channels involved. As it is not so easy for all the companies to take one of these models and implement it. There are a lot of challenges that comes with multi-touch attribution problem like customer journey duration, overestimation of branded channels, vouchers and cross-platform issue, etc.

Switching from traditional models to data-driven models gives us more flexibility and more insights as the major part here is defining some rules to prepare the data that fits your business. These rules can be defined by performing an ad hoc analysis of customer journeys. In the next section, I will discuss about Markov chain concept as an attribution model.

Markov chains

Markov chains concepts revolves around probability. For attribution problem, every customer journey can be seen as a chain(set of marketing channels) which will compute a markov graph as illustrated in figure 5. Every channel here is represented as a vertex and the edges represent the probability of hopping from one channel to another. There will be an another detailed article, explaining the concept behind different data-driven attribution models and how to apply them.

Figure 5: Markov chain example

Challenges during the Implementation

Transitioning from a traditional attribution models to a data-driven one, may sound exciting but the implementation is rather challenging as there are several issues which can not be resolved just by changing the type of model. Before its implementation, the marketers should perform a customer journey analysis to gain some insights about their customers and try to find out/perform:

  1. Length of customer journey.
  2. On an average how many branded and non branded channels (distinct and non-distinct) in a typical customer journey?
  3. Identify most upper funnel and lower funnel channels.
  4. Voucher analysis: within branded and non-branded channels.

When you are done with the analysis and able to answer all of the above questions, the next step would be to define some rules in order to handle the user data according to your business needs. Some of the issues during the implementation are discussed below along with their solution.

Customer journey duration

Assuming that you are a retailer, let’s try to understand this issue with an example. In May 2016, your company started a Fb advertising campaign for a particular product category which “attracted” a lot of customers including Chris. He saw your Fb ad while working in the office and clicked on it, which took him to your website. As soon as he registered on your website, his boss called him (probably because he was on Fb while working), he closed everything and went for the meeting. After coming back, he started working and completely forgot about your ad or products. After a few days, he received an email with some offers of your products which also he ignored until he saw an ad again on TV in Jan 2019 (after 3 years). At this moment, he started doing his research about your products and finally bought one of your products from some Instagram campaign. It took Chris almost 3 years to make his first purchase.

Figure 6: Chris journey

Now, take a minute and think, if you analyse the entire journey of customers like Chris, you would realize that you are still assigning some of the credit to the touchpoints that happened 3 years ago. This can be solved by using an attribution window. Figure 6 illustrates that 83% of the customers are making a purchase within 30 days which means the attribution window here could be 30 days. In simple words, it is safe to remove the touchpoints that happens after 30 days of purchase. This parameter can also be changed to 45 days or 60 days, depending on the use case.

Figure 7: Length of customer journey

Removal of direct marketing channel

A well known issue that every marketing analyst is aware of is, customers who are already aware of the brand usually comes to the website directly. This leads to overestimation of direct channel and branded channels start getting more credit. In this case, you can set a threshold (say 7 days) and remove these branded channels from customer journey.

Figure 8: Removal of branded channels

Cross platform problem

If some of your customers are using different devices to explore your products and you are not able to track them then it will make retargeting really difficult. In a perfect world these customers belong to same journey and if these can’t be combined then, except one, other paths would be considered as “non-converting path”. For attribution problem device could be thought of as a touchpoint to include in the path but to be able to track these customers across all devices would still be challenging. A brief introduction to deterministic and probabilistic ways of cross device tracking can be found here.

Figure 9: Cross platform clash

How to account for Vouchers?

To better account for vouchers, it can be added as a ‘dummy’ touchpoint of the type of voucher (CRM,Social media, Affiliate or Pricing etc.) used. In our case, we tried to add these vouchers as first touchpoint and also as a last touchpoint but no significant difference was found. Also, if the marketing channel of which the voucher was used was already in the path, the dummy touchpoint was not added.

Figure 10: Addition of Voucher as a touchpoint

AI For Advertisers: How Data Analytics Can Change The Maths Of Advertising?

All Images Credit: Freepik

The task of understanding a customer’s journey and designing your marketing strategy accordingly can be difficult in this data-driven world. Today, the customer expresses their needs in myriad forms of requests.

Consumers express their needs and want attitudes, and values in various forms through search, comments, blogs, Tweets, “likes,” videos, and conversations and access such data across many channels like web, mobile, and face to face. Volume, variety, velocity and veracity of the data accumulated through these customer interactions are huge.

BigData and data analytics can be leveraged to understand several phases of the customer journey. There are risks involved in using Artificial Intelligence for the marketing data analysis of data breach and even manipulation. But, AI do have brighter prospects when it comes to marketing and advertiser applications.

As the CEO of a technology firm Chop Dawg and marketer, Joshua Davidson puts it, “AI-powered apps are going to be the future for us, and there are several industries that are ripe for this.” The mobile-first strategy of many enterprises has powered the use of AI for digital marketing and developing technologies and innovations to power industries with intelligent systems.

How AI and Machine learning are affecting customer journeys?

Any consumer journey begins with the recognition of a problem and then stages like initial consideration, active evaluation, purchase, and postpurchase come through up till the consumer journey is over. The need for identifying the purchasing and need patterns of the consumers and finding the buyer personas to strategize the marketing for them.

Need and Want Recognition:

Identifying a need is quite difficult as it is the most initial level of a consumer’s journey and it is more on the category level than at a brand level. Marketers and advertisers are relying on techniques like market research, web analytics, and data mining to build consumer profiles and buyer’s persona for understanding the needs and influencing the purchase of products. AI can help identify these wants and needs in real-time as the consumers usually express their needs and wants online and help build profiles more quickly.

AI technologies offered by several firms help in consumer profiling. Firms like Microsoft offers Azure that crunches billions of data points in seconds to determine the needs of consumers. It then personalizes web content on specific platforms in real-time to align with those status-updates. Consumer digital footprints are evolving through social media status updates, purchasing behavior, online comments and posts. Ai tends to update these profiles continuously through machine learning techniques.

Initial Consideration:

A key objective of advertising is to insert a brand into the consideration set of the consumers when they are looking for deliberate offerings. Advertising includes increasing the visibility of brands and emphasize on the key reasons for consideration. Advertisers currently use search optimization, paid search advertisements, organic search, or advertisement retargeting for finding the consideration and increase the probability of consumer consideration.

AI can leverage machine learning and data analytics to help with search, identify and rank functions of consumer consideration that can match the real-time considerations at any specific time. Take an example of Google Adwords, it analyzes the consumer data and helps advertisers make clearer distinctions between qualified and unqualified leads for better targeting.

Google uses AI to analyze the search-query data by considering, not only the keywords but also context words and phrases, consumer activity data and other BigData. Then, Google identifies valuable subsets of consumers and more accurate targeting.

Active Evaluation: 

When consumers narrow it down to a few choices of brands, advertisers need to insert trust and value among the consumers for brands. A common technique is to identify the higher purchase consumers and persuade them through persuasive content and advertisement. AI can support these tasks using some techniques:

Predictive Lead Scoring: Predictive lead scoring by leveraging machine learning techniques of predictive analytics to allow marketers to make accurate predictions related to the intent of purchase for consumers. A machine learning algorithm runs through a database of existing consumer data, then recognize trends and patterns and after processing the external data on consumer activities and interests, creates robust consumer profiles for advertisers.

Natural Language Generation: By leveraging the image, speech recognition and natural language generation, machine learning enables marketers to curate content while learning from the consumer behavior in real-time scenarios and adjusts the content according to the profiles on the fly.

Emotion AI: Marketers use emotion AI to understand consumer sentiment and feel about the brand in general. By tapping into the reviews, blogs or videos they understand the mood of customers. Marketers also use emotion AI to pretest advertisements before its release. The famous example of Kelloggs, which used emotion AI to help devise an advertising campaign for their cereal, eliminating the advertisement executions whenever the consumer engagement dropped.

Purchase: 

As the consumers decide which brands to choose and what it’s worth, advertising aims to move them out of the decision process and push for the purchase by reinforcing the value of the brand compared with its competition.

Advertisers can insert such value by emphasizing convenience and information about where to buy the product, how to buy the product and reassuring the value through warranties and guarantees. Many marketers also emphasize on rapid return policies and purchase incentives.

AI can completely change the purchase process through dynamic pricing, which encompasses real-time price adjustments on the basis of information such as demand and other consumer-behavior variables, seasonality, and competitor activities.

Post-Purchase: 

Aftersales services can be improved through intelligent systems using AI technologies and machine learning techniques. Marketers and advertisers can hire dedicated developers to design intelligent virtual agents or chatbots that can reinforce the value and performance of a brand among consumers.

Marketers can leverage an intelligent technique known as Propensity modeling to identify the most valuable customers on the basis of lifetime value, likelihood of reengagement, propensity to churn, and other key performance measures of interest. Then advertisers can personalize their communication with these customers on the basis of these data.

Conclusion:

AI has shifted the focus of advertisers and marketers towards the customer-first strategies and enhanced the heuristics of customer engagement. Machine learning and IoT(Internet of Things) has already changed the way customer interact with the brands and this transition has come at a time when advertisers and marketers are looking for new ways to tap into the customer mindset and buyer’s persona.

All Images Credit: Freepik