The Data Scientist Job and the Future

A dramatic upswing of data science jobs facilitating the rise of data science professionals to encounter the supply-demand gap.

By 2024, a shortage of 250,000 data scientists is predicted in the United States alone. Data scientists have emerged as one of the hottest careers in the data world today. With digitization on the rise, IoT and cognitive technologies have generated a large number of data sets, thus, making it difficult for an organization to unlock the value of these data.

With the constant rise in data science, those fail to upgrade their skill set may be putting themselves at a competitive disadvantage. No doubt data science is still deemed as one of the best job titles today, but the battles for expert professionals in this field is fierce.

The hiring market for a data science professional has gone into overdrive making the competition even tougher. New online institutions have come up with credible certification programs for professionals to get skilled. Not to forget, organizations are in a hunt to hire candidates with data science and big data analytics skills, as these are the top skills that are going around in the market today. In addition to this, it is also said that typically it takes around 45 days for these job roles to be filled, which is five days longer than the average U.S. market.

Data science

One might come across several definitions for data science, however, a simple definition states that it is an accumulation of data, which is arranged and analyzed in a manner that will have an effect on businesses. According to Google, a data scientist is one who has the ability to analyze and interpret complex data, being able to make use of the statistic of a website and assist in business decision making. Also, one needs to be able to choose and build appropriate algorithms and predictive models that will help analyze data in a viable manner to uncover positive insights from it.

A data scientist job is now a buzzworthy career in the IT industry. It has driven a wider workforce to get skilled in this job role, as most organizations are becoming data-driven. It’s pretty obnoxious being a data professional will widen job opportunities and offer more chances of getting lucrative salary packages today. Similarly, let us look at a few points that define the future of data science to be bright.

  • Data science is still an evolving technology

A career without upskilling often remains redundant. To stay relevant in the industry, it is crucial that professionals get themselves upgraded in the latest technologies. Data science evolves to have an abundance of job opportunities in the coming decade. Since, the supply is low, it is a good call for professionals looking to get skilled in this field.

  • Organizations are still facing a challenge using data that is generated

Research by 2018 Data Security Confidence from Gemalto estimated that 65% of the organizations could not analyze or categorized the data they had stored. However, 89% said they could easily analyze the information prior they have a competitive edge. Being a data science professional, one can help organizations make progress with the data that is being gathered to draw positive insights.

  • In-demand skill-set

Most of the data scientists possess to have the in-demand skill set required by the current industry today. To be specific, since 2013 it is said that there has been a 256% increase in the data science jobs. Skills such as Machine Learning, R and Python programming, Predictive analytics, AI, and Data Visualization are the most common skills that employers seek from the candidates of today.

  • A humongous amount of data growing everyday

There are around 5 billion consumers that interact with the internet on a daily basis, this number is set to increase to 6 billion in 2025, thus, representing three-quarters of the world’s population.

In 2018, 33 zettabytes of data were generated and projected to rise to 133 zettabytes by 2025. The production of data will only keep increasing and data scientists will be the ones standing to guard these enterprises effectively.

  • Advancement in career

According to LinkedIn, data scientist was found to be the most promising career of 2019. The top reason for this job role to be ranked the highest is due to the salary compensation people were being awarded, a range of $130,000. The study also predicts that being a data scientist, there are high chances or earning a promotion giving a career advancement score of 9 out of 10.

Precisely, data science is still a fad job and will not cease until the foreseeable future.

Bringing intelligence to where data lives: Python & R embedded in T-SQL

Introduction

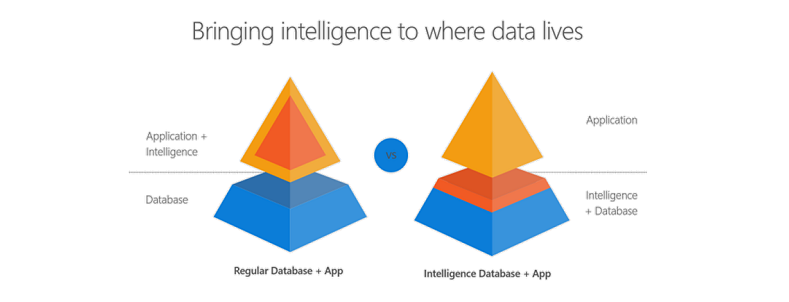
Did you know that you can write R and Python code within your T-SQL statements? Machine Learning Services in SQL Server eliminates the need for data movement. Instead of transferring large and sensitive data over the network or losing accuracy with sample csv files, you can have your R/Python code execute within your database. Easily deploy your R/Python code with SQL stored procedures making them accessible in your ETL processes or to any application. Train and store machine learning models in your database bringing intelligence to where your data lives.

You can install and run any of the latest open source R/Python packages to build Deep Learning and AI applications on large amounts of data in SQL Server. We also offer leading edge, high-performance algorithms in Microsoft’s RevoScaleR and RevoScalePy APIs. Using these with the latest innovations in the open source world allows you to bring unparalleled selection, performance, and scale to your applications.

If you are excited to try out SQL Server Machine Learning Services, check out the hands on tutorial below. If you do not have Machine Learning Services installed in SQL Server,you will first want to follow the getting started tutorial I published here: 

How-To Tutorial

In this tutorial, I will cover the basics of how to Execute R and Python in T-SQL statements. If you prefer learning through videos, I also published the tutorial on YouTube.

Basics

Open up SQL Server Management Studio and make a connection to your server. Open a new query and paste this basic example: (While I use Python in these samples, you can do everything with R as well)

EXEC sp_execute_external_script @language = N'Python',
@script = N'print(3+4)'

Sp_execute_external_script is a special system stored procedure that enables R and Python execution in SQL Server. There is a “language” parameter that allows us to choose between Python and R. There is a “script” parameter where we can paste R or Python code. If you do not see an output print 7, go back and review the setup steps in this article.

Parameter Introduction

Now that we discussed a basic example, let’s start adding more pieces:

EXEC sp_execute_external_script  @language =N'Python', 
@script = N' 
OutputDataSet = InputDataSet;
',
@input_data_1 =N'SELECT 1 AS Col1';

Machine Learning Services provides more natural communications between SQL and R/Python with an input data parameter that accepts any SQL query. The input parameter name is called “input_data_1”.
You can see in the python code that there are default variables defined to pass data between Python and SQL. The default variable names are “OutputDataSet” and “InputDataSet” You can change these default names like this example:

EXEC sp_execute_external_script  @language =N'Python', 
@script = N' 
MyOutput = MyInput;
',
@input_data_1_name = N'MyInput',
@input_data_1 =N'SELECT 1 AS foo',
@output_data_1_name =N'MyOutput';

As you executed these examples, you might have noticed that they each return a result with “(No column name)”? You can specify a name for the columns that are returned by adding the WITH RESULT SETS clause to the end of the statement which is a comma separated list of columns and their datatypes.

EXEC sp_execute_external_script  @language =N'Python', 
@script=N' 
MyOutput = MyInput;
',
@input_data_1_name = N'MyInput',
@input_data_1 =N'
SELECT 1 AS foo,
2 AS bar
',
@output_data_1_name =N'MyOutput'
WITH RESULT SETS ((MyColName int, MyColName2 int));

Input/Output Data Types

Alright, let’s discuss a little more about the input/output data types used between SQL and Python. Your input SQL SELECT statement passes a “Dataframe” to python relying on the Python Pandas package. Your output from Python back to SQL also needs to be in a Pandas Dataframe object. If you need to convert scalar values into a dataframe here is an example:

EXEC sp_execute_external_script  @language =N'Python', 
@script=N' 
import pandas as pd
c = 1/2
d = 1*2
s = pd.Series([c,d])
df = pd.DataFrame(s)
OutputDataSet = df
'

Variables c and d are both scalar values, which you can add to a pandas Series if you like, and then convert them to a pandas dataframe. This one shows a little bit more complicated example, go read up on the python pandas package documentation for more details and examples:

EXEC sp_execute_external_script  @language =N'Python', 
@script=N' 
import pandas as pd
s = {"col1": [1, 2], "col2": [3, 4]}
df = pd.DataFrame(s)
OutputDataSet = df
'

You now know the basics to execute Python in T-SQL!

Did you know you can also write your R and Python code in your favorite IDE like RStudio and Jupyter Notebooks and then remotely send the execution of that code to SQL Server? Check out these documentation links to learn more: https://aka.ms/R-RemoteSQLExecution https://aka.ms/PythonRemoteSQLExecution

Check out the SQL Server Machine Learning Services documentation page for more documentation, samples, and solutions. Check out these E2E tutorials on github as well.

Would love to hear from you! Leave a comment below to ask a question, or start a discussion!

The 6 most in-demand AI jobs and how to get them

A press release issued in December 2017 by Gartner, Inc explicitly states, 2020 will be a pivotal year in Artificial Intelligence-related employment dynamics. It states AI will become “a positive job motivator”.

However, the Gartner report also sounds some alarm bells. “The number of jobs affected by AI will vary by industry-through 2019, healthcare, the public sector and education will see continuously growing job demand while manufacturing will be hit the hardest. Starting in 2020, AI-related job creation will cross into positive territory, reaching two million net-new jobs in 2025,” the press release adds.

This phenomenon is expected to strike worldwide, as a report carried by a leading Indian financial daily, The Hindu BusinessLine states. “The year 2018 will see a sharp increase in demand for professionals with skills in emerging technologies such as Artificial Intelligence (AI) and machine learning, even as people with capabilities in Big Data and Analytics will continue to be the most sought after by companies across sectors, say sources in the recruitment industry,” this news article says.

Before we proceed, let us understand what exactly does Artificial Intelligence or AI mean.

Understanding Artificial Intelligence

Encyclopedia Britannica explains AI as: “The ability of a digital computer or computer-controlled robot to perform tasks commonly associated with human beings.” Classic examples of AI are computer games that can be played solo on a computer. Of these, one can be a human while the other is the reasoning, analytical and other intellectual property a computer. Chess is one example of such a game. While playing Chess with a computer, AI will analyze your moves. It will predict and reason why you made them and respond accordingly.

Similarly, AI imitates functions of the human brain to a very great extent. Of course, AI can never match the prowess of humans but it can come fairly close.

What this means?

This means that AI technology will advance exponentially. The main objective for developing AI will not aim at reducing dependence on humans that can result in loss of jobs or mass retrenchment of employees. Having a large population of unemployed people is harmful to economy of any country. Secondly, people without money will not be able to utilize most functions that are performed through AI, which will render the technology useless.

The advent and growing popularity of AI can be summarized in words of Bill Gates. According to the founder of Microsoft, AI will have a positive impact on people’s lives. In an interview with Fox Business, he said, people would have more spare time that would eventually lead to happier life. However he cautions, it would be long before AI starts making any significant impact on our daily activities and jobs.

Career in AI

Since AI primarily aims at making human life better, several companies are testing the technology. Global online retailer Amazon is one amongst these. Banks and financial institutions, service providers and several other industries are expected to jump on the AI bandwagon in 2018 and coming years. Hence, this is the right time to aim for a career in AI. Currently, there exists a great demand for AI professionals. Here, we look at the top six employment opportunities in Artificial Intelligence.

Computer Vision Research Engineer

 A Computer Vision Research Engineer’s work includes research and analysis, developing software and tools, and computer vision technologies. The primary role of this job is to ensure customer experience that equals human interaction.

Business Intelligence Engineer

As the job designation implies, the role of a Business Intelligence Engineer is to gather data from multiple functions performed by AI such as marketing and collecting payments. It also involves studying consumer patterns and bridging gaps that AI leaves.

Data Scientist

A posting for Data Scientist on recruitment website Indeed describes Data Scientist in these words: “ A mixture between a statistician, scientist, machine learning expert and engineer: someone who has the passion for building and improving Internet-scale products informed by data. The ideal candidate understands human behavior and knows what to look for in the data.

Research and Development Engineer (AI)

Research & Development Engineers are needed to find ways and means to improve functions performed through Artificial Intelligence. They research voice and text chat conversations conducted by bots or robotic intelligence with real-life persons to ensure there are no glitches. They also develop better solutions to eliminate the gap between human and AI interactions.

Machine Learning Specialist

The job of a Machine Learning Specialist is rather complex. They are required to study patterns such as the large-scale use of data, uploads, common words used in any language and how it can be incorporated into AI functions as well as analyzing and improving existing techniques.

Researchers

Researchers in AI is perhaps the best-paid lot. They are required to research into various aspects of AI in any organization. Their role involves researching usage patterns, AI responses, data analysis, data mining and research, linguistic differences based on demographics and almost every human function that AI is expected to perform.

As with any other field, there are several other designations available in AI. However, these will depend upon your geographic location. The best way to find the demand for any AI job is to look for good recruitment or job posting sites, especially those specific to your region.

In conclusion

Since AI is a technology that is gathering momentum, it will be some years before there is a flood of people who can be hired as fresher or expert in this field. Consequently, the demand for AI professionals is rather high. Median salaries these jobs mentioned above range between US$ 100,000 to US$ 150,000 per year.

However, before leaping into AI, it is advisable to find out what other qualifications are required by employers. As with any job, some companies need AI experts that hold specific engineering degrees combined with additional qualifications in IT and a certificate that states you hold the required AI training. Despite, this is the best time to make a career in the AI sector.

New Sponsor: Snowflake

Dear readers,

we have good news again: Now we welcome snowflake as our new Data Science Blog Sponsor! So we are booked out for the moment regarding sponsoring. Snowflake provides data warehousing for the cloud and has an unique data, access and feature model, the snowflake. Now we are looking forward to editorial contributions by snowflake.

Snowflake is the only data warehouse built for the cloud. Snowflake delivers the performance, concurrency and simplicity needed to store and analyze all data available to an organization in one location. Snowflake’s technology combines the power of data warehousing, the flexibility of big data platforms, the elasticity of the cloud, and live data sharing at a fraction of the cost of traditional solutions. Snowflake: Your data, no limits. Find out more at snowflake.net.

Furthermore, snowflake will also sponsor our Data Leader Days 2018 in November in Berlin!

Applying Data Science Techniques in Python to Evaluate Ionospheric Perturbations from Earthquakes

Multi-GNSS (Galileo, GPS, and GLONASS) Vertical Total Electron Content Estimates: Applying Data Science techniques in Python to Evaluate Ionospheric Perturbations from Earthquakes

1 Introduction

Today, Global Navigation Satellite System (GNSS) observations are routinely used to study the physical processes that occur within the Earth’s upper atmosphere. Due to the experienced satellite signal propagation effects the total electron content (TEC) in the ionosphere can be estimated and the derived Global Ionosphere Maps (GIMs) provide an important contribution to monitoring space weather. While large TEC variations are mainly associated with solar activity, small ionospheric perturbations can also be induced by physical processes such as acoustic, gravity and Rayleigh waves, often generated by large earthquakes.

In this study Ionospheric perturbations caused by four earthquake events have been observed and are subsequently used as case studies in order to validate an in-house software developed using the Python programming language. The Python libraries primarily utlised are Pandas, Scikit-Learn, Matplotlib, SciPy, NumPy, Basemap, and ObsPy. A combination of Machine Learning and Data Analysis techniques have been applied. This in-house software can parse both receiver independent exchange format (RINEX) versions 2 and 3 raw data, with particular emphasis on multi-GNSS observables from GPS, GLONASS and Galileo. BDS (BeiDou) compatibility is to be added in the near future.

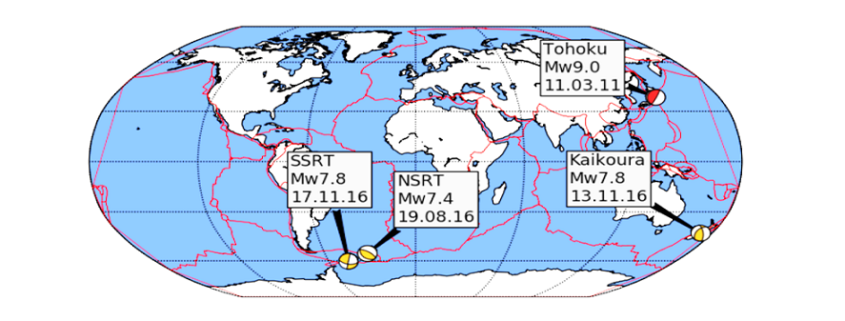
Several case studies focus on four recent earthquakes measuring above a moment magnitude (MW) of 7.0 and include: the 11 March 2011 MW 9.1 Tohoku, Japan, earthquake that also generated a tsunami; the 17 November 2013 MW 7.8 South Scotia Ridge Transform (SSRT), Scotia Sea earthquake; the 19 August 2016 MW 7.4 North Scotia Ridge Transform (NSRT) earthquake; and the 13 November 2016 MW 7.8 Kaikoura, New Zealand, earthquake.

Ionospheric disturbances generated by all four earthquakes have been observed by looking at the estimated vertical TEC (VTEC) and residual VTEC values. The results generated from these case studies are similar to those of published studies and validate the integrity of the in-house software.

2 Data Cleaning and Data Processing Methodology

Determining the absolute VTEC values are useful in order to understand the background ionospheric conditions when looking at the TEC perturbations, however small-scale variations in electron density are of primary interest. Quality checking processed GNSS data, applying carrier phase leveling to the measurements, and comparing the TEC perturbations with a polynomial fit creating residual plots are discussed in this section.

Time delay and phase advance observables can be measured from dual-frequency GNSS receivers to produce TEC data. Using data retrieved from the Center of Orbit Determination in Europe (CODE) site (ftp://ftp.unibe.ch/aiub/CODE), the differential code biases are subtracted from the ionospheric observables.

2.1 Determining VTEC: Thin Shell Mapping Function

The ionospheric shell height, H, used in ionosphere modeling has been open to debate for many years and typically ranges from 300 – 400 km, which corresponds to the maximum electron density within the ionosphere. The mapping function compensates for the increased path length traversed by the signal within the ionosphere. Figure 1 demonstrates the impact of varying the IPP height on the TEC values.
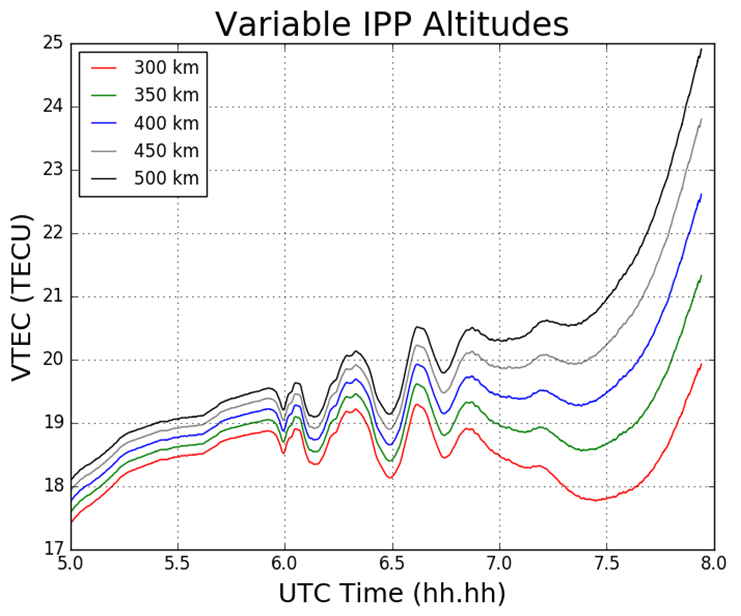
Figure 1 Impact on TEC values from varying IPP heights. The height of the thin shell, H, is increased in 50km increments from 300 to 500 km.

2.2 Phase Smoothing

For dual-frequency GNSS users TEC values can be retrieved with the use of dual-frequency measurements by applying calculations. Calculation of TEC for pseudorange measurements in practice produces a noisy outcome and so the relative phase delay between two carrier frequencies – which produces a more precise representation of TEC fluctuations – is preferred. To circumvent the effect of pseudorange noise on TEC data, GNSS pseudorange measurements can be smoothed by carrier phase measurements, with the use of the carrier phase smoothing technique, which is often referred to as carrier phase leveling.
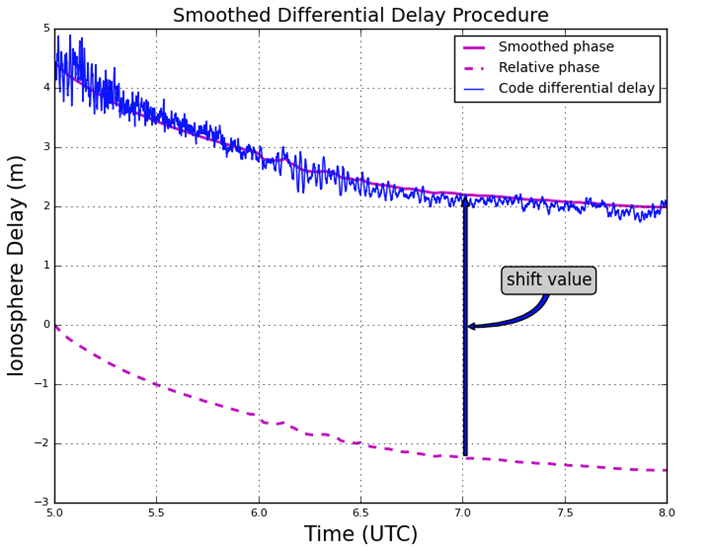
Figure 2 Phase smoothed code differential delay

2.3 Residual Determination

For the purpose of this study the monitoring of small-scale variations in ionospheric electron density from the ionospheric observables are of particular interest. Longer period variations can be associated with diurnal alterations, and changes in the receiver- satellite elevation angles. In order to remove these longer period variations in the TEC time series as well as to monitor more closely the small-scale variations in ionospheric electron density, a higher-order polynomial is fitted to the TEC time series. This higher-order polynomial fit is then subtracted from the observed TEC values resulting in the residuals. The variation of TEC due to the TID perturbation are thus represented by the residuals. For this report the polynomial order applied was typically greater than 4, and was chosen to emulate the nature of the arc for that particular time series. The order number selected is dependent on the nature of arcs displayed upon calculating the VTEC values after an initial inspection of the VTEC plots.

3 Results

3.1 Tohoku Earthquake

For this particular report, the sampled data focused on what was retrieved from the IGS station, MIZU, located at Mizusawa, Japan. The MIZU site is 39N 08′ 06.61″ and 141E 07′ 58.18″. The location of the data collection site, MIZU, and the earthquake epicenter can be seen in Figure 3.

Figure 3 MIZU IGS station and Tohoku earthquake epicenter [generated using the Python library, Basemap]

Figure 4 displays the ionospheric delay in terms of vertical TEC (VTEC), in units of TECU (1 TECU = 1016 el m-2). The plot is split into two smaller subplots, the upper section displaying the ionospheric delay (VTEC) in units of TECU, the lower displaying the residuals. The vertical grey-dashed lined corresponds to the epoch of the earthquake at 05:46:23 UT (2:46:23 PM local time) on March 11 2011. In the upper section of the plot, the blue line corresponds to the absolute VTEC value calculated from the observations, in this case L1 and L2 on GPS, whereby the carrier phase leveling technique was applied to the data set. The VTEC values are mapped from the STEC values which are calculated from the LOS between MIZU and the GPS satellite PRN18 (on Figure 4 denoted G18). For this particular data set as seen in Figure 4, a polynomial fit of  five degrees was applied, which corresponds to the red-dashed line. As an alternative to polynomial fitting, band-pass filtering can be employed when TEC perturbations are desired. However for the scope of this report polynomial fitting to the time series of TEC data was the only method used. In the lower section of Figure 4 the residuals are plotted. The residuals are simply the phase smoothed delay values (the blue line) minus the polynomial fit line (the red-dashed line). All ionosphere delay plots follow the same layout pattern and all time data is represented in UT (UT = GPS – 15 leap seconds, whereby 15 leap seconds correspond to the amount of leap seconds at the time of the seismic event). The time series shown for the ionosphere delay plots are given in terms of decimal of the hour, so that the format follows hh.hh.
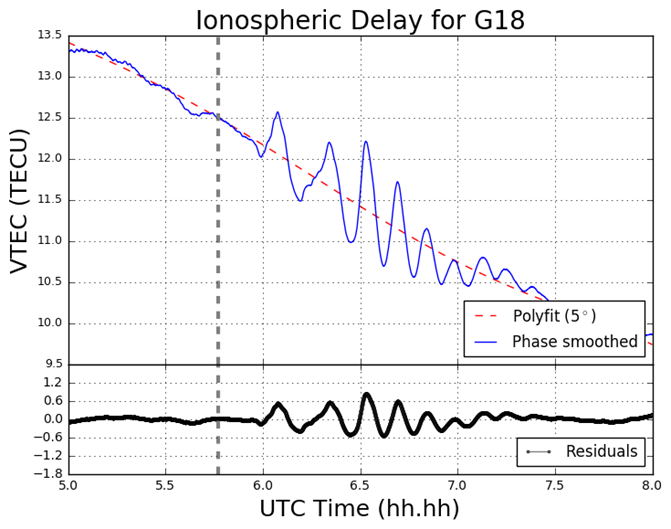
Figure 4 VTEC and residual plot for G18 at MIZU on March 11 2011

3.2 South Georgia Earthquake

In the South Georgia Island region located in the North Scotia Ridge Transform (NSRT) plate boundary between the South American and Scotia plates on 19 August 2016, a magnitude of 7.4 MW earthquake struck at 7:32:22 UT. This subsection analyses the data retrieved from KEPA and KRSA. As well as computing the GPS and GLONASS TEC values, four Galileo satellites (E08, E14, E26, E28) are also analysed. Figure 5 demonstrates the TEC perturbations as computed for the Galileo L1 and L5 carrier frequencies.
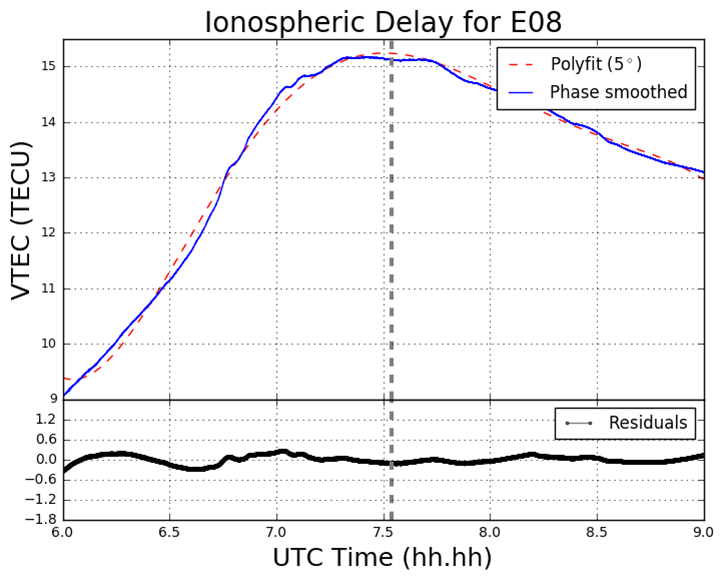
Figure 5 VTEC and residual plots at KRSA on 19 August 2016. The plots are from the perspective of the GNSS receiver at KRSA, for four Galileo satellites (a) E08; (b) E14; (c) E24; (d) E26. The y-axes and x-axes in all plots do not conform with one another but are adjusted to fit the data. The y-axes for the residual section of each plot is consistent with one another.

Figure 6 Geometry of the Galileo (E08, E14, E24 and E26) satellites’ projected ground track whereby the IPP is set to 300km altitude. The orange lines correspond to tectonic plate boundaries.

4 Conclusion

The proximity of the MIZU site and magnitude of the Tohoku event has provided a remarkable – albeit a poignant – opportunity to analyse the ocean-ionospheric coupling aftermath of a deep submarine seismic event. The Tohoku event has also enabled the observation of the origin and nature of the TIDs generated by both a major earthquake and tsunami in close proximity to the epicenter. Further, the Python software developed is more than capable of providing this functionality, by drawing on its mathematical packages, such as NumPy, Pandas, SciPy, and Matplotlib, as well as employing the cartographic toolkit provided from the Basemap package, and finally by utilizing the focal mechanism generation library, Obspy.

Pre-seismic cursors have been investigated in the past and strongly advocated in particular by Kosuke Heki. The topic of pre-seismic ionospheric disturbances remains somewhat controversial. A potential future study area could be the utilization of the Python program – along with algorithmic amendments – to verify the existence of this phenomenon. Such work would heavily involve the use of Scikit-Learn in order to ascertain the existence of any pre-cursors.

Finally, the code developed is still retained privately and as of yet not launched to any particular platform, such as GitHub. More detailed information on this report can be obtained here:

Download as PDF

New Sponsor: Cloudera

Dear readers,

we have good news: We welcome Cloudera as our new Data Science Blog Sponsor! Cloudera is one of the most famous platform and solution provider for big data analytics and machine learning. This also means editorial contributions by Cloudera for at least one year.

At Cloudera, we believe that data can make what is impossible today, possible tomorrow. We empower people to transform complex data into clear and actionable insights. We deliver the modern platform for machine learning and analytics optimized for the cloud. The world’s largest enterprises trust Cloudera to help solve their most challenging business problems.

Learn more about our new sponsor at cloudera.com.

New Sponsor: lexoro.ai

We wish our readers a happy new year and have good news: We welcome lexoro as our new Data Science Blog Sponsor for 2018!

lexoro GmbH is a Talent Management and Consulting company in the cosmos of the broad topic of Artificial Intelligence. Our focus lies on the relevant technologies and trends in the fields of data science, machine learning and big data. We identify and connect the best talents and experts behind the buzzwords, and help technology-focused industrial and consulting firms in finding the right people with the right skills to build and grow their analytics teams. In addition, we advise companies in identifying their individual challenges, hurdles and opportunities that go along with the great hype of Artificial Intelligence. We develop A.I. Prototypes and make the market transparent with industry-typical use cases.

Do you want to know more about lexoro? Visit them on lexoro.ai!

My Desk for Data Science

In my last post I anounced a blog parade about what a data scientist’s workplace might look like.

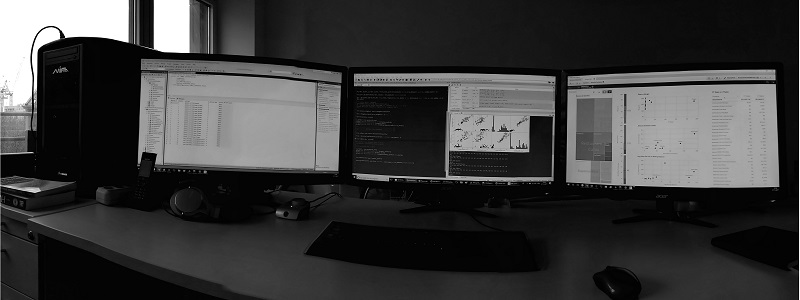
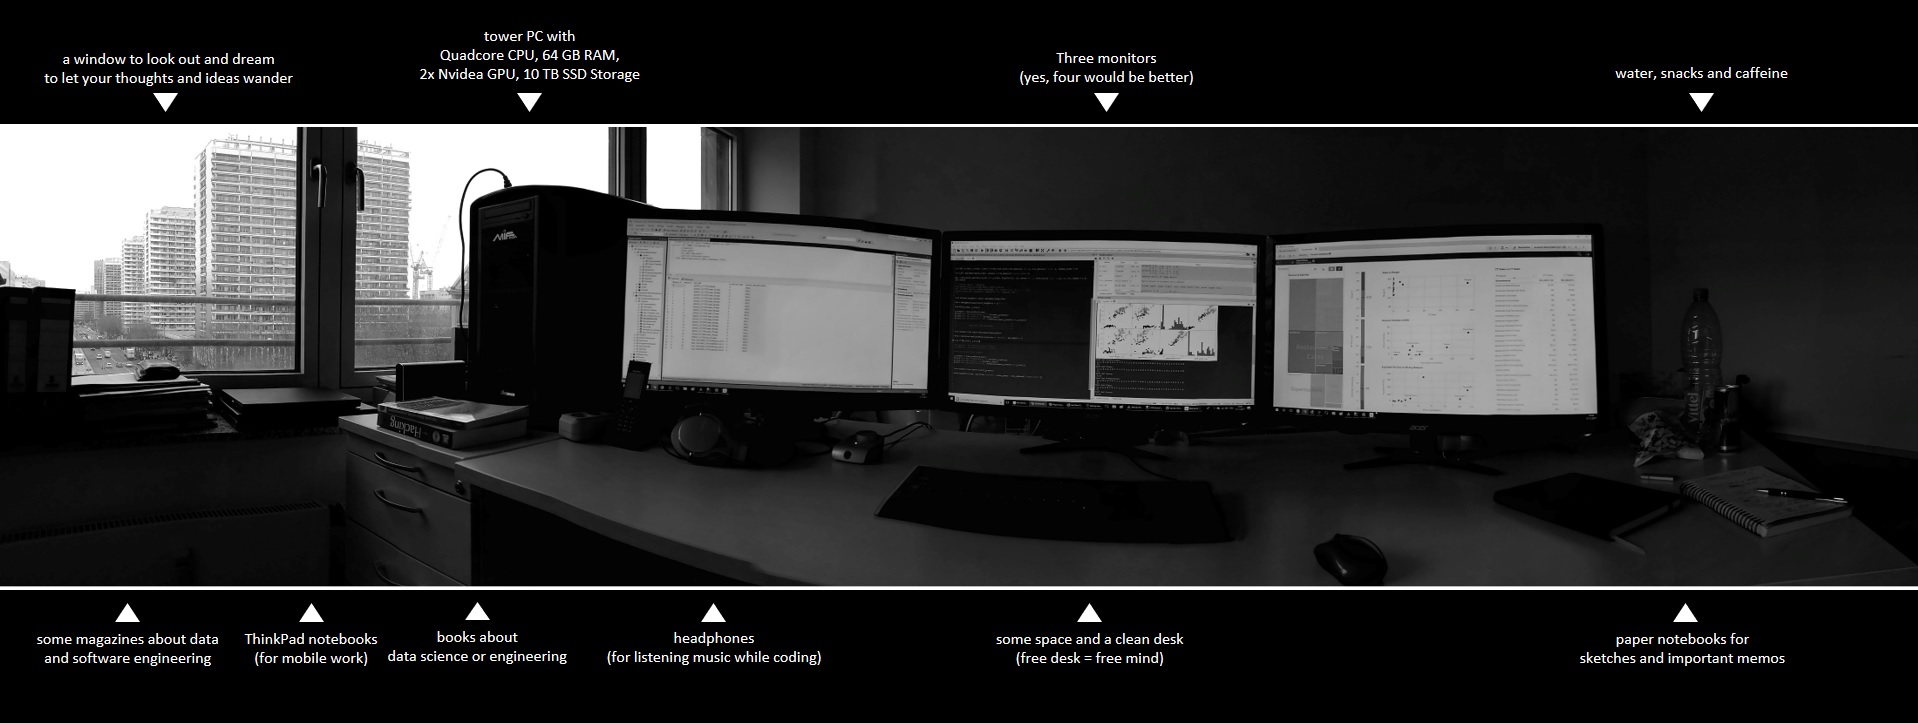
Here are some photos of my desk and my answers to the questions:

How many monitors do you use (or wish to have)?

I am mostly working at my desk in my office with a tower PC and three monitors.
I definitely need at least three monitors to work productively as a data scientist. Who does not know this: On the left monitor the data model is displayed, on the right monitor the data mapping and in the middle I do my work: programming the analysis scripts.

What hardware do you use? Apple? Dell? Lenovo? Others?

I am note an Apple guy. When I need to work mobile, I like to use ThinkPad notebooks. The ThinkPads are (in my experience) very robust and are therefore particularly good for mobile work. Besides, those notebooks look conservative and so I’m not sad if there comes a scratch on the notebook. However, I do not solve particularly challenging analysis tasks on a notebook, because I need my monitors for that.

Which OS do you use (or prefer)? MacOS, Linux, Windows? Virtual Machines?

As a data scientist, I have to be able to communicate well with my clients and they usually use Microsoft Windows as their operating system. I also use Windows as my main operating system. Of course, all our servers run on Linux Debian, but most of my tasks are done directly on Windows.
For some notebooks, I have set up a dual boot, because sometimes I need to start native Linux, for all other cases I work with virtual machines (Linux Ubuntu or Linux Mint).

What are your favorite databases, programming languages and tools?

I prefer the Microsoft SQL Server (T-SQL), C# and Python (pandas, numpy, scikit-learn). This is my world. But my customers are kings, therefore I am working with Postgre SQL, MongoDB, Neo4J, Tableau, Qlik Sense, Celonis and a lot more. I like to get used to new tools and technologies again and again. This is one of the benefits of being a data scientist.

Which data dou you analyze on your local hardware? Which in server clusters or clouds?

There have been few cases yet, where I analyzed really big data. In cases of analyzing big data we use horizontally scalable systems like Hadoop and Spark. But we also have customers analyzing middle-sized data (more than 10 TB but less than 100 TB) on one big server which is vertically scalable. Most of my customers just want to gather data to answer questions on not so big amounts of data. Everything less than 10TB we can do on a highend workstation.

If you use clouds, do you prefer Azure, AWS, Google oder others?

Microsoft Azure! I am used to tools provided by Microsoft and I think Azure is a well preconfigured cloud solution.

Where do you make your notes/memos/sketches. On paper or digital?

My calender is managed digital, because I just need to know everywhere what appointments I have. But my I prefer to wirte down my thoughts on paper and that´s why I have several paper-notebooks.

Now it is your turn: Join our Blog Parade!

So what does your workplace look like? Show your desk on your blog until 31/12/2017 and we will show a short introduction of your post here on the Data Science Blog!


Show your Data Science Workplace!

The job of a data scientist is often a mystery to outsiders. Of course, you do not really need much more than a medium-sized notebook to use data science methods for finding value in data. Nevertheless, data science workplaces can look so different and, let’s say, interesting. And that’s why I want to launch a blog parade – which I want to start with this article – where you as a Data Scientist or Data Engineer can show your workplace and explain what tools a data scientist in your opinion really needs.

I am very curious how many monitors you prefer, whether you use Apple, Dell, HP or Lenovo, MacOS, Linux or Windows, etc., etc. And of course, do you like a clean or messy desk?

What is a Blog Parade?

A blog parade is a call to blog owners to report on a specific topic. Everyone who participates in the blog parade, write on their blog a contribution to the topic. The organizer of the blog parade collects all the articles and will recap those articles in a short form together, of course with links to the articles.

How can I participate?

Write an article on your blog! Mention this blog parade here, show and explain your workplace (your desk with your technical equipment) in an article. If you’re missing your own blog, articles can also be posted directly to LinkedIn (LinkedIn has its own blogging feature that every LinkedIn member can use). Alternative – as a last resort – it would also be possible to send me your article with a photo about your workplace directly to: redaktion@data-science-blog.com.
Please make me aware of an article, via e-mail or with a comment (below) on this article.

Who can participate?

Any data scientist or anyone close to Data Science: Everyone concerned with topics such as data analytics, data engineering or data security. Please do not over-define data science here, but keep it in a nutshell, so that all professionals who manage and analyze data can join in with a clear conscience.

And yes, I will participate too. I will propably be the first who write an article about my workplace (I just need a new photo of my desk).

When does the article have to be finished?

By 31/12/2017, the article must have been published on your blog (or LinkedIn or wherever) and the release has to be reported to me.
But beware: Anyone who has previously written an article will also be linked earlier. After all, reporting on your article will take place immediately after I hear about it.
If you publish an artcile tomorrow, it will be shown the day after tomorrow here on the Data Science Blog.

What is in it for me to join?

Nothing! Except perhaps the fun factor of sharing your idea of ​​a nice desk for a data expert with others, so as to share creativity or a certain belief in what a data scientist needs.
Well and for bloggers: There is a great backlink from this data science blog for you 🙂

What should I write? What are the minimum requirements of content?

The article does not have to (but may be) particularly long. Anyway, here on this data science blog only a shortened version of your article will appear (with a link, of course).

Minimum requirments:

  • Show a photo (at least one!) of your workplace desk!
  • And tell us something about:
    • How many monitors do you use (or wish to have)?
    • What hardware do you use? Apple? Dell? Lenovo? Others?
    • Which OS do you use (or prefer)? MacOS, Linux, Windows? Virtual Machines?
    • What are your favorite databases, programming languages and tools? (e.g. Python, R, SAS, Postgre, Neo4J,…)
    • Which data dou you analyze on your local hardware? Which in server clusters or clouds?
    • If you use clouds, do you prefer Azure, AWS, Google oder others?
    • Where do you make your notes/memos/sketches. On paper or digital?

Not allowed:
Of course, please do not provide any information, which could endanger your company`s IT security.

Absolutly allowed:
Bringing some joke into the matter 🙂 We are happy to vote in the comments on the best or funniest desk for election, there may be also a winner later!


The resulting Blog Posts: https://data-science-blog.com/data-science-insights/show-your-desk/


The importance of domain knowledge – A healthcare data science perspective

Data scientists have (and need) many skills. They are frequently either former academic researchers or software engineers, with knowledge and skills in statistics, programming, machine learning, and many other domains of mathematics and computer science. These skills are general and allow data scientists to offer valuable services to almost any field. However, data scientists in some cases find themselves in industries they have relatively little knowledge of.

This is especially true in the healthcare field. In healthcare, there is an enormous amount of important clinical knowledge that might be relevant to a data scientist. It is unreasonable to expect a data scientist to not only have all of the skills typically required of a data scientist, but to also have all of the knowledge a medical professional may have.

Why is domain knowledge necessary?

This lack of domain knowledge, while perfectly understandable, can be a major barrier to healthcare data scientists. For one thing, it’s difficult to come up with project ideas in a domain that you don’t know much about. It can also be difficult to determine the type of data that may be helpful for a project – if you want to build a model to predict a health outcome (for example, whether a patient has or is likely to develop a gastrointestinal bleed), you need to know what types of variables might be related to this outcome so you can make sure to gather the right data.

Knowing the domain is useful not only for figuring out projects and how to approach them, but also for having rules of thumb for sanity checks on the data. Knowing how data is captured (is it hand-entered? Is it from machines that can give false readings for any number of reasons?) can help a data scientist with data cleaning and from going too far down the wrong path. It can also inform what true outliers are and which values might just be due to measurement error.

Often the most challenging part of building a machine learning model is feature engineering. Understanding clinical variables and how they relate to a health outcome is extremely important for this. Is a long history of high blood pressure important for predicting heart problems, or is only very recent history? How long a time horizon is considered ‘long’ or ‘short’ in this context? What other variables might be related to this health outcome? Knowing the domain can help direct the data exploration and greatly speed (and enhance) the feature engineering process.

Once features are generated, knowing what relationships between variables are plausible helps for basic sanity checks. If you’re finding the best predictor of hospitalization is the patient’s eye color, this might indicate an issue with your code. Being able to glance at the outcome of a model and determine if they make sense goes a long way for quality assurance of any analytical work.

Finally, one of the biggest reasons a strong understanding of the data is important is because you have to interpret the results of analyses and modeling work. Knowing what results are important and which are trivial is important for the presentation and communication of results. An analysis that determines there is a strong relationship between age and mortality is probably well-known to clinicians, while weaker but more surprising associations may be of more use. It’s also important to know what results are actionable. An analysis that finds that patients who are elderly are likely to end up hospitalized is less useful for trying to determine the best way to reduce hospitalizations (at least, without further context).

How do you get domain knowledge?

In some industries, such as tech, it’s fairly easy and straightforward to see an end-user’s prospective. By simply viewing a website or piece of software from the user’s point of view, a data scientist can gain a lot of the needed context and background knowledge needed to understand where their data is coming from and how their model output is being used. In the healthcare industry, it’s more difficult. A data scientist can’t easily choose to go through med school or the experience of being treated for a chronic illness. This means there is no easy single answer to where to gain domain knowledge. However, there are many avenues available.

Reading literature and attending presentations can boost one’s domain knowledge. However, it’s often difficult to find resources that are penetrable for someone who is not already a clinician. To gain deep knowledge, one needs to be steeped in the topic. One important avenue to doing this is through the establishment of good relationships with clinicians. Clinicians can be powerful allies that can help point you in the right direction for understanding your data, and simply by chatting with them you can gain important insights. They can also help you visit the clinics or practices to interact with the people that perform the procedures or even watch the procedures being done. At Fresenius Medical Care, where I work, members of my team regularly visit clinics. I have in the last year visited one of our dialysis clinics, a nephrology practice, and a vascular care unit. These experiences have been invaluable to me in developing my knowledge of the treatment of chronic illnesses.

In conclusion, it is crucial for data scientists to acquire basic familiarity in the field they are working in and in being part of collaborative teams that include people who are technically knowledgeable in the field they work in. This said, acquiring even an essential understanding (such as “Medicine 101”) may go a long way for the data scientists in being able to become self-sufficient in essential feature selection and design.