How Deep Learning drives businesses forward through automation – Infographic

In cooperation between DATANOMIQ, my consulting company for data science, business intelligence and process mining, and Pixolution, a specialist for computer vision with deep learning, we have created an infographic (PDF) about a very special use case for companies with deep learning: How to protect the corporate identity of any company by ensuring consistent branding with automated font recognition.

How to ensure consistent branding with automatic font recognition - Infographic

How to ensure consistent branding with automatic font recognition – Infographic

The infographic is available as PDF download:

My elaborate study notes on reinforcement learning

I will not tell you why, but all of a sudden I was in need of writing an article series on Reinforcement Learning. Though I am also a beginner in reinforcement learning field. Everything I knew was what I learned from one online lecture conducted in a lazy tone in my college. However in the process of learning reinforcement learning, I found a line which could connect the two dots, one is reinforcement learning and the other is my studying field. That is why I made up my mind to make an article series on reinforcement learning seriously.

To be a bit more concrete, I imagine that technologies in our world could be enhanced by a combination of reinforcement learning and virtual reality. That means companies like Toyota or VW might come to invest on visual effect or video game companies more seriously in the future. And I have been actually struggling with how to train deep learning with cgi, which might bridge the virtual world and the real world.

As I am also a beginner in reinforcement learning, this article series would a kind of study note for me. But as I have been doing in my former articles, I prefer exhaustive but intuitive explanations on AI algorithms, thus I will do my best to make my series as instructive and effective as existing tutorial on reinforcement learning.

This article is going to be composed of the following contents.

In this article I would like to share what I have learned about RL, and I hope you could get some hints of learning this fascinating field. In case you have any comments or advice on my “study note,” leaving a comment or contacting me via email would be appreciated.

How Microsoft Azure Is Impacting Financial Companies

Microsoft Azure has taken a large chunk of the cloud marketplace, transforming companies with the speed and security of the cloud. Microsoft has over the years used Azure to cushion companies against risk, deal with fraud and differentiate their customer experience. 

With Microsoft Cloud App Security, customers experience 75% automatic threat elimination because of increased visibility and automated threat protection. With all these and more amazing benefits of using Azure, its market share is bound to increase even more over the coming years.

https://www.flickr.com/photos/91869083@N05/8493934839/in/photolist-dWzCUp-efhrzk-29k3oWh-9zALPj-9zALPh-9aXgpG-91z6Eo-6pABZ8-2htjpWP-Wrr2UG-aNxVLK-4z3omV-2kEyM6k-9GvMhf-Rf9aM7-4z7CQJ-aS8oqx-ekXUoo-9aU3wz-9aXjnw-aS8HTZ-LPgq61-2kjSEYf-2hamKDd-2h6JfeX-2h7gxoF-Fx6eAM-pQ6Ken-fbNckF-2iMRZSS-2hTUA6v-b8ayve-b8awer-dZwwJ7-2i3mmqV-e1dGQz-2dZwNg6-b8aoSH-b8arkc-6ztgDn-b8asCZ-efwZLM-b8atnM-b8attr-2kGQugq-2iowpX5-6zbcAC-dAQCVY-b8aoq8-517Jxq

Image Source

Financial companies have not been left behind by the Azure bandwagon. The financial industry is using Microsoft Azure to enhance its core functionsinvest money by making informed decisions, and minimize risk while maximizing returns. 

Azure facilitates these core functions by helping with the storage of huge amounts of data—  some dating back to decades ago—, data retrieval and data security. 

It also helps financial companies to keep up with regulatory compliance.

Microsoft Azure is not the only cloud services provider. But here’s why it is the most outstanding when it comes to helping financial companies achieve their business goals.

Azure Offers Hybrid and Multi-Cloud Computing for Financial Companies

The financial services industry is extremely dynamic. Organizations offering financial services have to constantly test the market and come up with new and innovative products and services. 

They are also often under pressure to extend their services across borders. Remember they have to do all of this while at the same time managing their existing customers, containing their risk, and dealing with fraud.

Financial regulations also keep changing. As financial companies increasingly embrace new technology for their services— including intelligent cloud computing— and they have to comply with industry regulations. They cannot afford to leave loopholes as they take on their journey with the cloud.

The financial services industry is highly competitive and keeps up with modernity. These companies have had to resort to the dynamic hybrid, multi-cloud computing, and public cloud strategies to keep up with the trend.

This is how a hybrid cloud model worksit enables existing on-premises applications to be extended through a connection to the public cloud. 

This allows financial companies to enjoy the speed, elasticity, and scale of the public cloud without necessarily having to remodel their entire applications. These organizations are afforded the flexibility of deciding what parts of their application remains in an existing data center and which one resides in the cloud.

Cloud computing with Azure allows financial organizations to operate more efficiently by providing end-to-end protection to information, allowing the digitization of financial services, and providing data security. 

Data security is particularly important to financial firms because they are often targeted by fraudsters and cyber threats. They, therefore, need to protect crucial information which they achieve by authenticating their data centers using Azure.

Here’s why financial companies cannot think of doing without Azure’s hybrid cloud computing even for just a day.

https://unsplash.com/collections/28744506/work?utm_source=unsplash&utm_medium=referral&utm_content=creditCopyText

Photo by Windows on Unsplash

  • The ability to expand their geographic reach

Azure enables financial companies to establish data centers in new locations to meet globally growing demand. This allows them to open and explore new markets. They can then use Azure DevOps pipelines to maintain their data factories and keep everything consistent.

  • Consistent Infrastructure management

The hybrid cloud model promotes a consistent approach to infrastructure management across all locations, whether it is on-premises, public cloud, or the edge.

  • Increased Elasticity

Financial firms and banks utilizing Azure services can respond with great agility to transactional changes or changes in demand by provisioning or de-provisioning as the situation at hand demands. 

In cases where the organization requires high computation such as complex risk modeling, a hybrid strategy allows it to expand its capacity beyond its data center without overwhelming its servers.

  • Flexibility

A hybrid strategy allows financial organizations to choose cloud services that fall within their budget, match their needs, and suit their features.

  • Data security and enhanced regulatory compliance

Hybrid and multi-cloud strategies are a superb alternative for strictly on-premises strategies when one considers resiliency, data portability, and data security.

  • Reduces CapEx Expenses

Managing on-premises infrastructure is expensive. Financial companies utilizing Azure do not need to spend large amounts of money setting them up and managing them. 

With the increased elasticity of the hybrid system, financial organizations only pay for the resources they actually use, at a relatively lower cost.

Financial Organizations Have Access to an Analytics Platform

As we mentioned earlier, financial companies have the core function of making financial decisions in order to invest money and gain maximum returns at the least possible risk. 

Having been entrusted with their customers’ assets, the best way to ensure success in making profits is by using an analytics system.

Getting the form of analytics that helps with solving this investment problem is the kind of headache that does not go away by taking a tablet of ibuprofen and a glass of waterintegrating data is not an easy task. Besides, building a custom analytics solution from scratch is quite expensive.

Luckily for financial companies, Azure has a dedicated analytics platform for the financial services industry. It is custom-made just for these types of organizations. 

Their system is quite intuitive and easy to use. Companies not only get to save the resources they would have otherwise used to build a custom solution, but they get to learn about their investment risks and get instant results at cloud speed. 

They can mitigate against negatively impactful market occurrences and gain profits even when operating in adverse market conditions.

https://unsplash.com/collections/28744506/work?utm_source=unsplash&utm_medium=referral&utm_content=creditCopyText

Image by Headway on Unsplash

Financial Companies Get Advanced Data Management

Good analytics goes hand-in-hand with a great data management system. Financial companies need to have good data, create an organized data warehouse, and have a secure data storage system.

In addition to storing your data, Microsoft Azure ensures your storage can be optimized to support advanced applications, for example, machine learning and forecasting. 

Azure even allows you to compress and store documents for long periods of time when you write the data to Microsoft Azure Blob Storage. These documents can be retrieved anytime when the need arises for auditors’, regulators’, and lawyers’ perusal. 

Conclusion

Microsoft has over time managed to gain the trust of many industries, the financial services industry inclusive. Using its cloud computing giant, Azure, it has empowered these companies to carry out their functions efficiently and at the lowest cost and risk possible.

Azure’s hybrid cloud computing strategy has made financial operations flexible, opened doors for financial companies to establish their services in multiple locations, and provided them with consistent infrastructure management, among many other benefits.

With their futuristic model and commitment to growth, it’s only prudent to assume that Microsoft Azure will continue carrying the mantle as the best cloud services provider in the financial services industry.

5 AI Tricks to Grow Your Online Sales

The way people shop is currently changing. This only means that online stores need optimization to stay competitive and answer to the needs of customers. In this post, we’ll bring up the five ways in which you can use artificial intelligence technology in an online store to grow your revenues. Let’s begin!

1. Personalization with AI

Opening the list of AI trends that are certainly worth covering deals with a step up in personalization. Did you know that according to the results of a survey that was held by Accenture, more than 90% of shoppers are likelier to buy things from those stores and brands that propose suitable product recommendations?

This is exactly where artificial intelligence can give you a big hand. Such progressive technology analyzes the behavior of your consumers individually, keeping in mind their browsing and purchasing history. After collecting all the data, AI draws the necessary conclusions and offers those product recommendations that the user might like.

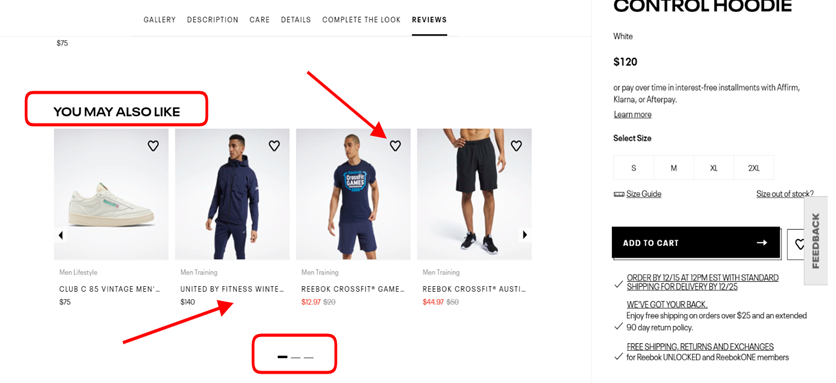
Look at the example below with the block has a carousel of neat product options. Obviously, this “move” can give a big boost to the average cart sizes.

Screenshot taken on the official Reebok website

Screenshot taken on the official Reebok website

2. Smarter Search Options

With the rise of the popularity of AI voice assistants and the leap in technology in general, the way people look for things on the web has changed. Everything is moving towards saving time and getting faster better results.

One of such trends deals with embracing the text to speech and image search technology. Did you notice how many search bars have “microphone icons” for talking out your request?

On a similar note, numerous sites have made a big jump forward after incorporating search by picture. In this case, uploaded photos get analyzed by artificial intelligence technology. The system studies what’s depicted on the image and cross-checks it with the products sold in the store. In several seconds the user is provided with a selection of similar products.

Without any doubt, this greatly helps users find what they were looking for faster. As you might have guessed, this is a time-saving feature. In essence, this omits the necessity to open dozens of product pages on multiple sites when seeking out a liked item that they’ve taken a screenshot or photo of.

Check out how such a feature works on the official Amazon website by taking a look at the screenshots of StyleSnap provided below.

Screenshot taken on the official Amazon StyleSnap website

Screenshot taken on the official Amazon StyleSnap website

3. Assisting Clients via Chatbots

The next point on the list is devoted to AI chatbots. This feature can be a real magic wand with client support which is also beneficial for online sales.

Real customer support specialists usually aren’t available 24/7. And keeping in mind that most requests are on repetitive topics, having a chatbot instantly handle many of the questions is a neat way to “unload” the work of humans.

Such chatbots use machine learning to get better at understanding and processing client queries. How do they work? They’re “taught” via scripts and scenario schemes. Therefore, the more data you supply them with, the more matters they’ll be able to cover.

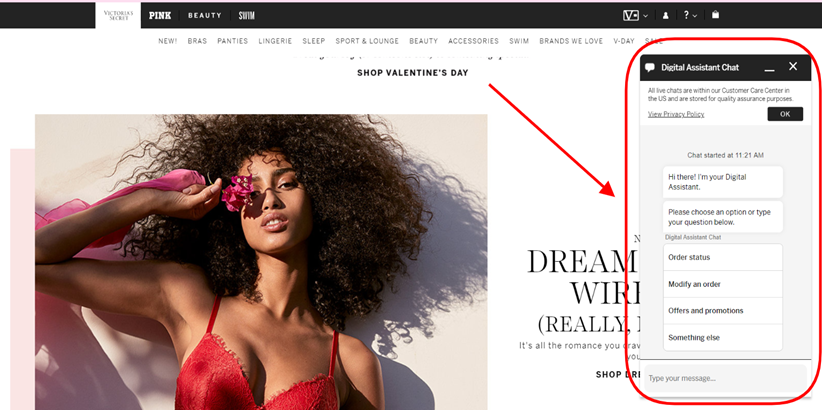
Case in point, there’s such a chat available on the official Victoria’s Secret website. If the user launches the Digital Assistant, the messenger bot starts the conversation. Based on the selected topic the user selects from the options, the bot defines what will be discussed.

Screenshot taken on the official Victoria’s Secret website

Screenshot taken on the official Victoria’s Secret website

4. Determining Top-Selling Product Combos

A similar AI use case for boosting online revenues to the one mentioned in the first point, it becomes much easier to cross-sell products when artificial intelligence “cracks” the actual top matches. Based on the findings by Sumo, you can boost your revenues by 10 to 30% if you upsell wisely!

The product database of online stores gets larger by the month, making it harder to know for good which items go well together and complement each other. With AI on your analytics team, you don’t have to scratch your head guessing which products people are likely to additionally buy along with the item they’re browsing at the moment. This work on singling out data can be done for you.

As seen on the screenshot from the official MAC Cosmetics website, the upselling section on the product page presents supplement items in a carousel. Thus, the chance of these products getting added to the shopping cart increases (if you compare it to the situation when the client would search the site and find these products by himself).

Screenshot taken on the official MAC Cosmetics website

Screenshot taken on the official MAC Cosmetics website

5. “Try It On” with a Camera

The fifth AI technology in this list is virtual try on that borrowed the power of augmented reality technology in the world of sales.

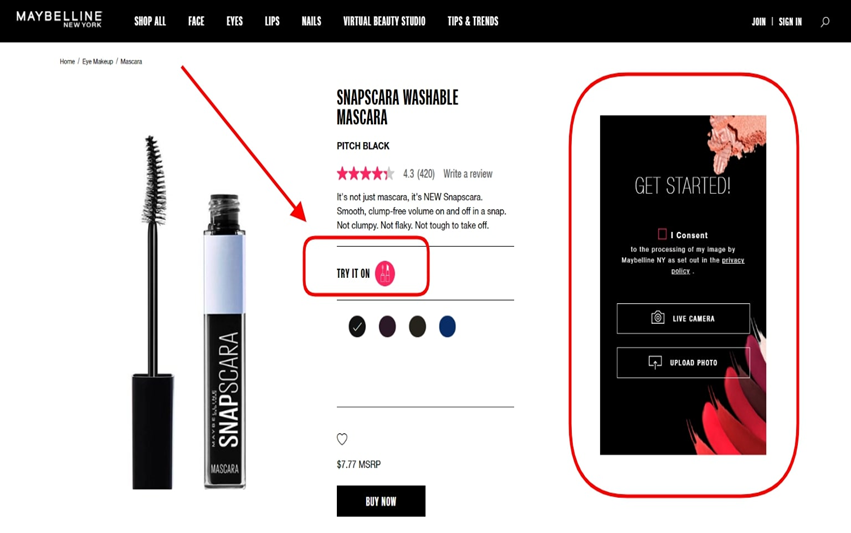
Especially for fields like cosmetics or accessories, it is important to find ways to help clients to make up their minds and encourage them to buy an item without testing it physically. If you want, you can play around with such real-time functionality and put on makeup using your camera on the official Maybelline New York site.

Consumers, ultimately, become happier because this solution omits frustration and unneeded doubts. With everything evident and clear, people don’t have the need to take a shot in the dark what will be a good match, they can see it.

Screenshot taken on the official Maybelline New York website

Screenshot taken on the official Maybelline New York website

In Closing

To conclude everything stated in this article, artificial intelligence is a big crunch point. Incorporating various AI-powered features into an online retail store can be a neat advancement leading to a visible growth in conversions.

Five ways Data Science is used in Fintech

Data science experts process and act upon data that digital resources produce. In the fintech world, data comes from mobile apps, transactions, conversations and financial standings. With this data for fintech, experts can improve the experience and success of businesses and customers alike.

Apps like PayPal, Venmo and Cash App have led the way for other fintech organizations, big and small, to grow. In fact, roughly 65% of Americans are already using digital banking in some capacity, whether it’s an app or online service. This growth, in turn, brings benefits. From personalization to integrating robotic advisors, here are five ways data scientists help fintech brands.

1. Personalization

Finance is one of the most personal industries out there as it deals with your private accounts and data. To match this uniqueness, fintechs can use data science for personalization. That way, customer service caters to individual needs.

As the fintech company gathers data from individual transactions, communications, behavior and interests, data scientists can then use said data to curate a better experience for the customer. They can advertise products and services that the customer may need to help with savings, for instance.

Contis is one example of a fintech that has integrated personalization into its services. Customers receive specific recommendations to create an efficient experience.

2. Fundraising

Fundraising had an interesting year in 2020. Amid racial justice protests and movements, crowdfunding took off on fintechs like GoFundMe and Kickstarter. These platforms helped provide funding for those who needed it. From here, data scientists can use fundraising in unique ways.

They can help raise money by targeting people who have donated in the past, or who are likely to donate based on spending habits. This data provides a more well-rounded fundraising campaign.

Then, once they do have donors, they can again use data to segment contributors by interest, demographic or engagement history. This segmentation helps advertise in a more personal, interest-specific way.

3. Fraud Detection

Cybercriminals thrive on an abundance of digital interactions. With the rise in digital banking — and the pandemic-driven shift to technology — fintechs could potentially see high rates of fraud. In fact, by the end of 2020, the United States saw about $11 billion in lost funds from credit card fraud alone.

Data for fintech brands will help address and prevent fraud like this in the future. As customers produce data from their transactions and interactions, it provides a better picture of their behavior. If there’s deviance, the data then shows potential fraud may be occurring.

If fraud does occur, data scientists can then use that instance to learn and properly recognize how data behaves during cybercriminal activity.

4. Robo-Advisors

With more people using fintech services, employees have a lot on their hands. They must properly address the customers’ needs and provide solutions. However, in the online world, employees are now getting some robotic assistance.

Robo-advisors use machine learning algorithms to interact with customers online or on mobile apps. They ask questions, understand the problems and provide solutions. They also collect data like customer goals and financial plans, which they can report back to data scientists for analysis.

Overall, roughly 75% and 46% of large and small banks, respectively, are implementing artificial intelligence to some degree. This data-driven revolution is one to keep your eye on.

5. Blockchain Governance

Blockchain governance is a somewhat newer way that experts can use data for fintech services. The blockchain is commonly known for its support of cryptocurrency services. Though crypto assets like Bitcoin and Ethereum are on the rise, the blockchain itself is still getting its footing.

Now, fintechs like PayPal are offering crypto services, which means data scientists will be able to expand what’s possible for digital banking. As customers transfer crypto funds, data scientists can monitor their activity and get a better handle on the data that exists on the blockchain. From there, they can provide personalization and prevent fraud in the same ways as they would with standard digital banking.

A Changing Landscape

As data scientists continue to help fintech services grow, you’ll notice each of these five areas begins to become more common. Some, like personalization and fraud detection, are already key focuses for fintech companies. However, alongside robo-advisor, fundraising and blockchain, they all have room to grow through the use of data science.

How the Internet of Things Technology is Impacting the World

Internet of Things, or commonly referred to as IoT, is disrupting industries and arguably making the world a much better place because of it.  Some of the main industries are actually listed below.

Manufacturing

The first industry that is seeing a revival from the Internet of Things technology has to be manufacturing.  The ways that IoT technology is impacting systems and processes are saving companies and a lot of money and making them more efficient for more profits.

On the factory level, they can predict and presume when a machine needs to go, replaced, or improved upon using IoT technology.  On the consumer side of things, they can use the Internet of Things technology to see how customers are using their products, and how they can improve it.

Cars

The automotive industry is also seeing things like connected cars Internet of Things software pop up, and it is changing the industry.  The technology lets users get diagnostic information and it lets them be connected to the internet.

Letting users always be connected to the internet is useful in so many areas, and it really would be hard not to find benefit from it.

Public Transportation

Another thing that is related to the general automotive industry is the transportation industry and how the public moves.  By using the Internet of Things technology, we can track the diagnostics, fuel, and driver patterns of public transportation.

All of this can increase the effectiveness of public transportation and end up saving the public more money if the drivers are more efficient in the routes that they take across cities.

Housing

The real estate and housing market is the biggest in the world, so naturally, they are going to take advantage of something like the Internet of Things software.

We are starting to see the housing sector take up on smart products in their home, but the Internet of Things is going to eventually make the whole home smart.  A refrigerator connected to the internet is most likely coming if you think about it.

While it may seem weird to have everything connected and no appliances are just old school, you can certainly expect this to happen soon.  The only problem is, most of the old appliances need to go bad before people have the urge to go out and get a new appliance that is connected to the internet.

Energy and Utilities

The utility market is exploding with the growth of the IoT software because of its many uses.  Before, we used to have someone come and read your meter or check for leaks.  Now, the connectivity of everything can be monitored from another place, and no one has to show up to your house to read a meter.

It really is a win-win situation for both providers and consumers in the utility and energy sector.  It will be very interesting to see how the Internet of Things impacts the world and flips some industries on their side.

Data Science in Engineering Process - Product Lifecycle Management

How to develop digital products and solutions for industrial environments?

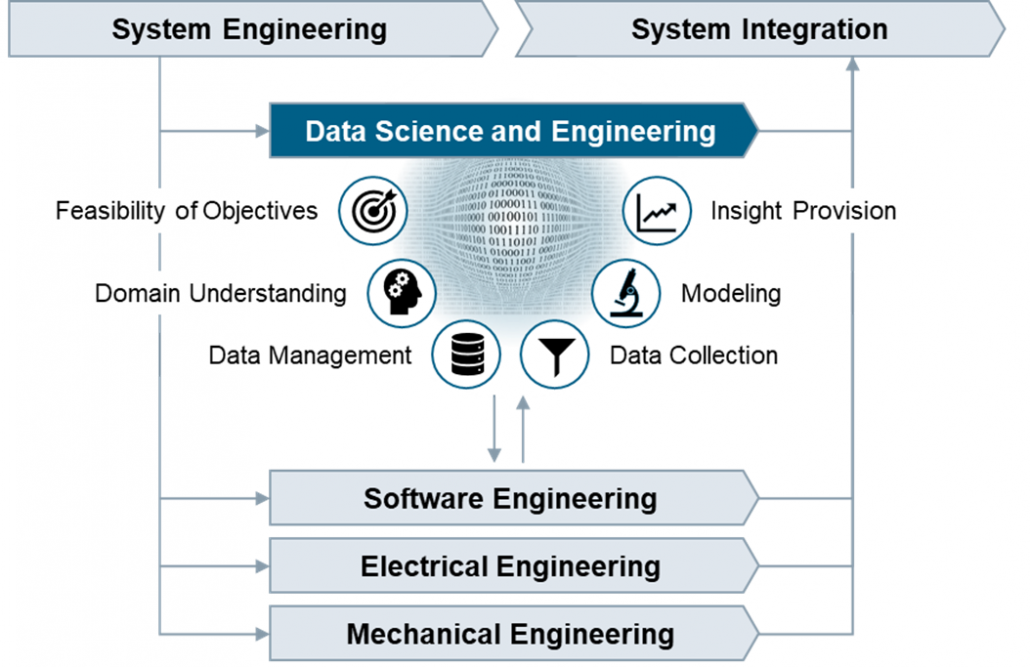
The Data Science and Engineering Process in PLM.

Huge opportunities for digital products are accompanied by huge risks

Digitalization is about to profoundly change the way we live and work. The increasing availability of data combined with growing storage capacities and computing power make it possible to create data-based products, services, and customer specific solutions to create insight with value for the business. Successful implementation requires systematic procedures for managing and analyzing data, but today such procedures are not covered in the PLM processes.

From our experience in industrial settings, organizations start processing the data that happens to be available. This data often does not fully cover the situation of interest, typically has poor quality, and in turn the results of data analysis are misleading. In industrial environments, the reliability and accuracy of results are crucial. Therefore, an enormous responsibility comes with the development of digital products and solutions. Unless there are systematic procedures in place to guide data management and data analysis in the development lifecycle, many promising digital products will not meet expectations.

Various methodologies exist but no comprehensive framework

Over the last decades, various methodologies focusing on specific aspects of how to deal with data were promoted across industries and academia. Examples are Six Sigma, CRISP-DM, JDM standard, DMM model, and KDD process. These methodologies aim at introducing principles for systematic data management and data analysis. Each methodology makes an important contribution to the overall picture of how to deal with data, but none provides a comprehensive framework covering all the necessary tasks and activities for the development of digital products. We should take these approaches as valuable input and integrate their strengths into a comprehensive Data Science and Engineering framework.

In fact, we believe it is time to establish an independent discipline to address the specific challenges of developing digital products, services and customer specific solutions. We need the same kind of professionalism in dealing with data that has been achieved in the established branches of engineering.

Data Science and Engineering as new discipline

Whereas the implementation of software algorithms is adequately guided by software engineering practices, there is currently no established engineering discipline covering the important tasks that focus on the data and how to develop causal models that capture the real world. We believe the development of industrial grade digital products and services requires an additional process area comprising best practices for data management and data analysis. This process area addresses the specific roles, skills, tasks, methods, tools, and management that are needed to succeed.

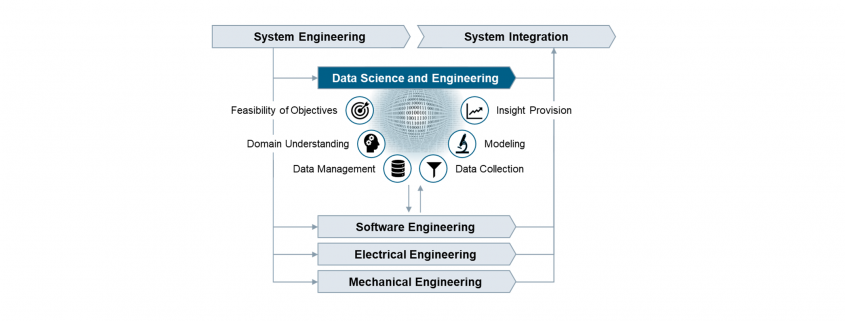
Figure: Data Science and Engineering as new engineering discipline

More than in other engineering disciplines, the outputs of Data Science and Engineering are created in repetitions of tasks in iterative cycles. The tasks are therefore organized into workflows with distinct objectives that clearly overlap along the phases of the PLM process.

Feasibility of Objectives
  Understand the business situation, confirm the feasibility of the product idea, clarify the data infrastructure needs, and create transparency on opportunities and risks related to the product idea from the data perspective.
Domain Understanding
  Establish an understanding of the causal context of the application domain, identify the influencing factors with impact on the outcomes in the operational scenarios where the digital product or service is going to be used.
Data Management
  Develop the data management strategy, define policies on data lifecycle management, design the specific solution architecture, and validate the technical solution after implementation.
Data Collection
  Define, implement and execute operational procedures for selecting, pre-processing, and transforming data as basis for further analysis. Ensure data quality by performing measurement system analysis and data integrity checks.
Modeling
  Select suitable modeling techniques and create a calibrated prediction model, which includes fitting the parameters or training the model and verifying the accuracy and precision of the prediction model.
Insight Provision
  Incorporate the prediction model into a digital product or solution, provide suitable visualizations to address the information needs, evaluate the accuracy of the prediction results, and establish feedback loops.

Real business value will be generated only if the prediction model at the core of the digital product reliably and accurately reflects the real world, and the results allow to derive not only correct but also helpful conclusions. Now is the time to embrace the unique chances by establishing professionalism in data science and engineering.

Authors

Peter Louis                               

Peter Louis is working at Siemens Advanta Consulting as Senior Key Expert. He has 25 years’ experience in Project Management, Quality Management, Software Engineering, Statistical Process Control, and various process frameworks (Lean, Agile, CMMI). He is an expert on SPC, KPI systems, data analytics, prediction modelling, and Six Sigma Black Belt.


Ralf Russ    

Ralf Russ works as a Principal Key Expert at Siemens Advanta Consulting. He has more than two decades experience rolling out frameworks for development of industrial-grade high quality products, services, and solutions. He is Six Sigma Master Black Belt and passionate about process transparency, optimization, anomaly detection, and prediction modelling using statistics and data analytics.4


How Important is Customer Lifetime Value?

This is the third article of article series Getting started with the top eCommerce use cases. If you are interested in reading the first article you can find it here.

Customer Lifetime Value

Many researches have shown that cost for acquiring a new customer is higher than the cost of retention of an existing customer which makes Customer Lifetime Value (CLV or LTV) one of the most important KPI’s. Marketing is about building a relationship with your customer and quality service matters a lot when it comes to customer retention. CLV is a metric which determines the total amount of money a customer is expected to spend in your business.

CLV allows marketing department of the company to understand how much money a customer is going  to spend over their  life cycle which helps them to determine on how much the company should spend to acquire each customer. Using CLV a company can better understand their customer and come up with different strategies either to retain their existing customers by sending them personalized email, discount voucher, provide them with better customer service etc. This will help a company to narrow their focus on acquiring similar customers by applying customer segmentation or look alike modeling.

One of the main focus of every company is Growth in this competitive eCommerce market today and price is not the only factor when a customer makes a decision. CLV is a metric which revolves around a customer and helps to retain valuable customers, increase revenue from less valuable customers and improve overall customer experience. Don’t look at CLV as just one metric but the journey to calculate this metric involves answering some really important questions which can be crucial for the business. Metrics and questions like:

  1. Number of sales
  2. Average number of times a customer buys
  3. Full Customer journey
  4. How many marketing channels were involved in one purchase?
  5. When the purchase was made?
  6. Customer retention rate
  7. Marketing cost
  8. Cost of acquiring a new customer

and so on are somehow associated with the calculation of CLV and exploring these questions can be quite insightful. Lately, a lot of companies have started to use this metric and shift their focuses in order to make more profit. Amazon is the perfect example for this, in 2013, a study by Consumers Intelligence Research Partners found out that prime members spends more than a non-prime member. So Amazon started focusing on Prime members to increase their profit over the past few years. The whole article can be found here.

How to calculate CLV?

There are several methods to calculate CLV and few of them are listed below.

Method 1: By calculating average revenue per customer


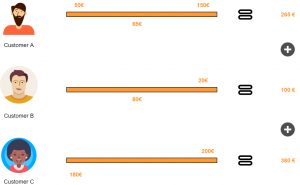
Figure 1: Using average revenue per customer


Let’s suppose three customers brought 745€ as profit to a company over a period of 2 months then:

CLV (2 months) = Total Profit over a period of time / Number of Customers over a period of time

CLV (2 months) = 745 / 3 = 248 €

Now the company can use this to calculate CLV for an year however, this is a naive approach and works only if the preferences of the customer are same for the same period of time. So let’s explore other approaches.

Method 2

This method requires to first calculate KPI’s like retention rate and discount rate.


CLV = Gross margin per lifespan ( Retention rate per month / 1 + Discount rate – Retention rate per month)

Where

Retention rate = Customer at the end of the month – Customer during the month / Customer at the beginning of the month ) * 100

Method 3

This method will allow us to look at other metrics also and can be calculated in following steps:

  1. Calculate average number of transactions per month (T)
  2. Calculate average order value (OV)
  3. Calculate average gross margin (GM)
  4. Calculate customer lifespan in months (ALS)

After calculating these metrics CLV can be calculated as:


CLV = T*OV*GM*ALS / No. of Clients for the period

where

Transactions (T) = Total transactions / Period

Average order value (OV) = Total revenue / Total orders

Gross margin (GM) = (Total revenue – Cost of sales/ Total revenue) * 100 [but how you calculate cost of sales is debatable]

Customer lifespan in months (ALS) = 1 / Churn Rate %


CLV can be calculated using any of the above mentioned methods depending upon how robust your company wants the analysis to be. Some companies are also using Machine learning models to predict CLV, maybe not directly but they use ML models to predict customer churn rate, retention rate and other marketing KPI’s. Some companies take advantage of all the methods by taking an average at the end.

Multi-touch attribution: A data-driven approach

Customers shopping behavior has changed drastically when it comes to online shopping, as nowadays, customer likes to do a thorough market research about a product before making a purchase.

What is Multi-touch attribution?

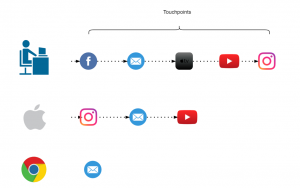
This makes it really hard for marketers to correctly determine the contribution for each marketing channel to which a customer was exposed to. The path a customer takes from his first search to the purchase is known as a Customer Journey and this path consists of multiple marketing channels or touchpoints. Therefore, it is highly important to distribute the budget between these channels to maximize return. This problem is known as multi-touch attribution problem and the right attribution model helps to steer the marketing budget efficiently. Multi-touch attribution problem is well known among marketers. You might be thinking that if this is a well known problem then there must be an algorithm out there to deal with this. Well, there are some traditional models  but every model has its own limitation which will be discussed in the next section.

Types of attribution models

Most of the eCommerce companies have a performance marketing department to make sure that the marketing budget is spent in an agile way. There are multiple heuristics attribution models pre-existing in google analytics however there are several issues with each one of them. These models are:

Traditional attribution models

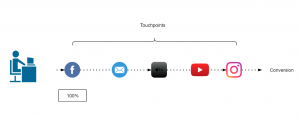
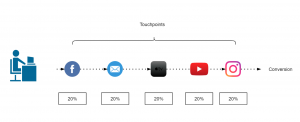
First touch attribution model

100% credit is given to the first channel as it is considered that the first marketing channel was responsible for the purchase.

Figure 1: First touch attribution model

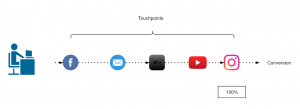
Last touch attribution model

100% credit is given to the last channel as it is considered that the first marketing channel was responsible for the purchase.

Figure 2: Last touch attribution model

Linear-touch attribution model

In this attribution model, equal credit is given to all the marketing channels present in customer journey as it is considered that each channel is equally responsible for the purchase.

Figure 3: Linear attribution model

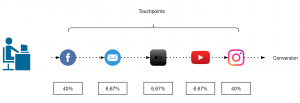
U-shaped or Bath tub attribution model

This is most common in eCommerce companies, this model assigns 40% to first and last touch and 20% is equally distributed among the rest.

Figure 4: Bathtub or U-shape attribution model

Data driven attribution models

Traditional attribution models follows somewhat a naive approach to assign credit to one or all the marketing channels involved. As it is not so easy for all the companies to take one of these models and implement it. There are a lot of challenges that comes with multi-touch attribution problem like customer journey duration, overestimation of branded channels, vouchers and cross-platform issue, etc.

Switching from traditional models to data-driven models gives us more flexibility and more insights as the major part here is defining some rules to prepare the data that fits your business. These rules can be defined by performing an ad hoc analysis of customer journeys. In the next section, I will discuss about Markov chain concept as an attribution model.

Markov chains

Markov chains concepts revolves around probability. For attribution problem, every customer journey can be seen as a chain(set of marketing channels) which will compute a markov graph as illustrated in figure 5. Every channel here is represented as a vertex and the edges represent the probability of hopping from one channel to another. There will be an another detailed article, explaining the concept behind different data-driven attribution models and how to apply them.

Figure 5: Markov chain example

Challenges during the Implementation

Transitioning from a traditional attribution models to a data-driven one, may sound exciting but the implementation is rather challenging as there are several issues which can not be resolved just by changing the type of model. Before its implementation, the marketers should perform a customer journey analysis to gain some insights about their customers and try to find out/perform:

  1. Length of customer journey.
  2. On an average how many branded and non branded channels (distinct and non-distinct) in a typical customer journey?
  3. Identify most upper funnel and lower funnel channels.
  4. Voucher analysis: within branded and non-branded channels.

When you are done with the analysis and able to answer all of the above questions, the next step would be to define some rules in order to handle the user data according to your business needs. Some of the issues during the implementation are discussed below along with their solution.

Customer journey duration

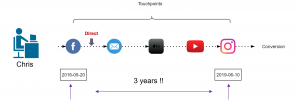
Assuming that you are a retailer, let’s try to understand this issue with an example. In May 2016, your company started a Fb advertising campaign for a particular product category which “attracted” a lot of customers including Chris. He saw your Fb ad while working in the office and clicked on it, which took him to your website. As soon as he registered on your website, his boss called him (probably because he was on Fb while working), he closed everything and went for the meeting. After coming back, he started working and completely forgot about your ad or products. After a few days, he received an email with some offers of your products which also he ignored until he saw an ad again on TV in Jan 2019 (after 3 years). At this moment, he started doing his research about your products and finally bought one of your products from some Instagram campaign. It took Chris almost 3 years to make his first purchase.

Figure 6: Chris journey

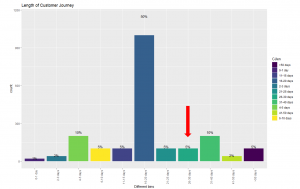
Now, take a minute and think, if you analyse the entire journey of customers like Chris, you would realize that you are still assigning some of the credit to the touchpoints that happened 3 years ago. This can be solved by using an attribution window. Figure 6 illustrates that 83% of the customers are making a purchase within 30 days which means the attribution window here could be 30 days. In simple words, it is safe to remove the touchpoints that happens after 30 days of purchase. This parameter can also be changed to 45 days or 60 days, depending on the use case.

Figure 7: Length of customer journey

Removal of direct marketing channel

A well known issue that every marketing analyst is aware of is, customers who are already aware of the brand usually comes to the website directly. This leads to overestimation of direct channel and branded channels start getting more credit. In this case, you can set a threshold (say 7 days) and remove these branded channels from customer journey.

Figure 8: Removal of branded channels

Cross platform problem

If some of your customers are using different devices to explore your products and you are not able to track them then it will make retargeting really difficult. In a perfect world these customers belong to same journey and if these can’t be combined then, except one, other paths would be considered as “non-converting path”. For attribution problem device could be thought of as a touchpoint to include in the path but to be able to track these customers across all devices would still be challenging. A brief introduction to deterministic and probabilistic ways of cross device tracking can be found here.

Figure 9: Cross platform clash

How to account for Vouchers?

To better account for vouchers, it can be added as a ‘dummy’ touchpoint of the type of voucher (CRM,Social media, Affiliate or Pricing etc.) used. In our case, we tried to add these vouchers as first touchpoint and also as a last touchpoint but no significant difference was found. Also, if the marketing channel of which the voucher was used was already in the path, the dummy touchpoint was not added.

Figure 10: Addition of Voucher as a touchpoint

4 Industries Likely to Be Further Impacted by Data and Analytics in 2020

Image by seeya.com

The possibilities for collecting and analyzing data have skyrocketed in recent years. Company leaders no longer must rely primarily on guesswork when making decisions. They can look at the hard statistics to get verification before making a choice.

Here are four industries likely to notice continuing positive benefits while using data and analytics in 2020.

  1. Transportation

If the transportation sector suffers from problems like late arrivals or buses and trains never showing up, people complain. Many use transportation options to reach work or school, and use long-term solutions like planes to visit relatives or enjoy vacations.

Data analysis helps transportation authorities learn about things such as ridership numbers, the most efficient routes and more. Digging into data can also help professionals in the sector verify when recent changes pay off.

For example, New York City recently enacted a plan called the 14th Street Busway. It stops cars from traveling on 14th Street for more than a couple of blocks from 6 a.m. to 10 p.m. every day. One of the reasons for making the change was to facilitate the buses that carry passengers along 14th Street. Data confirms the Busway did indeed encourage people to use the bus. Ridership jumped 24% overall, and by 20% during the morning rush hour.

Data analysis could also streamline air travel. A new solution built with artificial intelligence can reportedly make flights more on time and reduce fuel consumption by improving traffic flow in the terminals. The system also crunches numbers to warn people about long lines in an airport. Then, some passengers might make schedule adjustments to avoid those backups.

These examples prove why it’s smart for transportation professionals to continually see what the data shows. Becoming more aware of what’s happening, where problems exist and how people respond to different transit options could lead to better decision-making.

  1. Agriculture

People in the agriculture industry face numerous challenges, such as climate change and the need to produce food for a growing global population. There’s no single, magic fix for these challenges, but data analytics could help.

For example, MIT researchers are using data to track the effects of interventions on underperforming African farms. The outcome could make it easier for farmers to prove that new, high-tech equipment will help them succeed, which could be useful when applying for loans.

Elsewhere, scientists developed a robot called the TerraSentia that can collect information about a variety of crop traits, such as the height and biomass. The machine then transfers that data to a farmer’s laptop or computer. The robot’s developers say their creation could help farmers figure out which kinds of crops would give the best yields in specific locations, and that the TerraSentia will do it much faster than humans.

Applying data analysis to agriculture helps farmers remove much of the guesswork from what they do. Data can help them predict the outcome of a growing season, target a pest or crop disease problem and more. For these reasons and others, data analysis should remain prominent in agriculture for the foreseeable future.

  1. Energy 

Statistics indicate global energy demand will increase by at least 30% over the next two decades. Many energy industry companies have turned to advanced data analysis technologies to prepare for that need. Some solutions examine rocks to improve the detection of oil wells, while others seek to maximize production over the lifetime of an oilfield.

Data collection in the energy sector is not new, but there’s been a long-established habit of only using a small amount of the overall data collected. That’s now changing as professionals are more frequently collecting new data, plus converting information from years ago into usable data.

Strategic data analysis could also be a good fit for renewable energy efforts. A better understanding of weather forecasts could help energy professionals pinpoint how much a solar panel or farm could contribute to the electrical grid on a given day.

Data analysis helps achieve that goal. For example, some solutions can predict the weather up to a month in advance. Then, it’s possible to increase renewable power generation by up to 10%.

  1. Construction

Construction projects can be costly and time-consuming, although the results are often impressive. Construction professionals must work with a vast amount of data as they meet customers’ needs. Site plans, scheduling specifics, weather information and regulatory documents all help define how the work progresses and whether everything stays under budget.

Construction firms increasingly use big data analysis software to pull all the information into one place and make it easier to use. That data often streamlines customer communications and helps with meeting expectations. In one instance, a construction company depended on a real-time predictive modeling solution and combined it with in-house estimation software.

The outcome enabled instantly showing a client how much a new addition would cost. Other companies that are starting to use big data in construction note that having the option substantially reduces their costs — especially during the planning phase before construction begins. Another company is working on a solution that can analyze job site photos and use them to spot injury risks.

Data Analysis Increases Success

The four industries mentioned here have already enjoyed success by investigating the potential data analysis offers. People should expect them to continue making gains through 2020.

Image by seeya.com