Attribution Models in Marketing

Attribution Models

A Business and Statistical Case

INTRODUCTION

A desire to understand the causal effect of campaigns on KPIs

Advertising and marketing costs represent a huge and ever more growing part of the budget of companies. Studies have found out this share is as high as 10% and increases with the size of companies (CMO study by American Marketing Association and Duke University, 2017). Measuring precisely the impact of a specific marketing campaign on the sales of a company is a critical step towards an efficient allocation of this budget. Would the return be higher for an euro spent on a Facebook ad, or should we better spend it on a TV spot? How much should I spend on Twitter ads given the volume of sales this channel is responsible for?

Attribution Models have lately received great attention in Marketing departments to answer these issues. The transition from offline to online marketing methods has indeed permitted the collection of multiple individual data throughout the whole customer journey, and  allowed for the development of user-centric attribution models. In short, Attribution Models use the information provided by Tracking technologies such as Google Analytics or Webtrekk to understand customer journeys from the first click on a Facebook ad to the final purchase and adequately ponderate the different marketing campaigns encountered depending on their responsibility in the final conversion.

Issues on Causal Effects

A key question then becomes: how to declare a channel is responsible for a purchase? In other words, how can we isolate the causal effect or incremental value of a campaign ?

          1. A/B-Tests

One method to estimate the pure impact of a campaign is the design of randomized experiments, wherein a control and treated groups are compared.  A/B tests belong to this broad category of randomized methods. Provided the groups are a priori similar in every aspect except for the treatment received, all subsequent differences may be attributed solely to the treatment. This method is typically used in medical studies to assess the effect of a drug to cure a disease.

Main practical issues regarding Randomized Methods are:

  • Assuring that control and treated groups are really similar before treatment. Uually a random assignment (i.e assuring that on a relevant set of observable variables groups are similar) is realized;
  • Potential spillover-effects, i.e the possibility that the treatment has an impact on the non-treated group as well (Stable unit treatment Value Assumption, or SUTVA in Rubin’s framework);
  • The costs of conducting such an experiment, and especially the costs linked to the deliberate assignment of individuals to a group with potentially lower results;
  • The number of such experiments to design if multiple treatments have to be measured;
  • Difficulties taking into account the interaction effects between campaigns or the effect of spending levels. Indeed, usually A/B tests are led by cutting off temporarily one campaign entirely and measuring the subsequent impact on KPI’s compared to the situation where this campaign is maintained;
  • The dynamical reproduction of experiments if we assume that treatment effects may change over time.

In the marketing context, multiple campaigns must be tested in a dynamical way, and treatment effect is likely to be heterogeneous among customers, leading to practical issues in the lauching of A/B tests to approximate the incremental value of all campaigns. However, sites with a lot of traffic and conversions can highly benefit from A/B testing as it provides a scientific and straightforward way to approximate a causal impact. Leading companies such as Uber, Netflix or Airbnb rely on internal tools for A/B testing automation, which allow them to basically test any decision they are about to make.

References:

Books:

Experiment!: Website conversion rate optimization with A/B and multivariate testing, Colin McFarland, ©2013 | New Riders  

A/B testing: the most powerful way to turn clicks into customers. Dan Siroker, Pete Koomen; Wiley, 2013.

Blogs:

https://eng.uber.com/xp

https://medium.com/airbnb-engineering/growing-our-host-community-with-online-marketing-9b2302299324

Study:

https://cmosurvey.org/wp-content/uploads/sites/15/2018/08/The_CMO_Survey-Results_by_Firm_and_Industry_Characteristics-Aug-2018.pdf

        2. Attribution models

Attribution Models do not demand to create an experimental setting. They take into account existing data and derive insights from the variability of customer journeys. One key difficulty is then to differentiate correlation and causality in the links observed between the exposition to campaigns and purchases. Indeed, selection effects may bias results as exposure to campaigns is usually dependant on user-characteristics and thus may not be necessarily independant from the customer’s baseline conversion probabilities. For example, customers purchasing from a discount price comparison website may be intrinsically different from customers buying from FB ad and this a priori difference may alone explain post-exposure differences in purchasing bahaviours. This intrinsic weakness must be remembered when interpreting Attribution Models results.

                          2.1 General Issues

The main issues regarding the implementation of Attribution Models are linked to

  • Causality and fallacious reasonning, as most models do not take into account the aforementionned selection biases.
  • Their difficult evaluation. Indeed, in almost all attribution models (except for those based on classification, where the accuracy of the model can be computed), the additionnal value brought by the use of a given attribution models cannot be evaluated using existing historical data. This additionnal value can only be approximated by analysing how the implementation of the conclusions of the attribution model have impacted a given KPI.
  • Tracking issues, leading to an uncorrect reconstruction of customer journeys
    • Cross-device journeys: cross-device issue arises from the use of different devices throughout the customer journeys, making it difficult to link datapoints. For example, if a customer searches for a product on his computer but later orders it on his mobile, the AM would then mistakenly consider it an order without prior campaign exposure. Though difficult to measure perfectly, the proportion of cross-device orders can approximate 20-30%.
    • Cookies destruction makes it difficult to track the customer his the whole journey. Both regulations and consumers’ rising concerns about data privacy issues mitigate the reliability and use of cookies.1 – From 2002 on, the EU has enacted directives concerning privacy regulation and the extended use of cookies for commercial targeting purposes, which have highly impacted marketing strategies, such as the ‘Privacy and Electronic Communications Directive’ (2002/58/EC). A research was conducted and found out that the adoption of this ‘Privacy Directive’ had led to 64% decrease in advertising methods compared to the rest of the world (Goldfarb et Tucker (2011)). The effect was stronger for generalized sites (Yahoo) than for specialized sites.2 – Users have grown more and more conscious of data privacy issues and have adopted protective measures concerning data privacy, such as automatic destruction of cookies after a session is ended, or simply giving away less personnal information (Goldfarb et Tucker (2012) ) .Valuable user information may be lost, though tracking technologies evolution have permitted to maintain tracking by other means. This issue may be particularly important in countries highly concerned with data privacy issues such as Germany.
    • Offline/Online bridge: an Attribution Model should take into account all campaigns to draw valuable insights. However, the exposure to offline campaigns (TV, newspapers) are difficult to track at the user level. One idea to tackle this issue would be to estimate the proportion of conversions led by offline campaigns through AB testing and deduce this proportion from the credit assigned to the online campaigns accounted for in the Attribution Model.
    • Touch point information available: clicks are easy to follow but irrelevant to take into account the influence of purely visual campaigns such as display ads or video.

                          2.2 Today’s main practices

Two main families of Attribution Models exist:

  • Rule-Based Attribution Models, which have been used for in the last decade but from which companies are gradualy switching.

Attribution depends on the individual journeys that have led to a purchase and is solely based on the rank of the campaign in the journey. Some models focus on a single touch points (First Click, Last Click) while others account for multi-touch journeys (Bathtube, Linear). It can be calculated at the customer level and thus doesn’t require large amounts of data points. We can distinguish two sub-groups of rule-based Attribution Models:

  • One Touch Attribution Models attribute all credit to a single touch point. The First-Click model attributes all credit for a converion to the first touch point of the customer journey; last touch attributes all credit to the last campaign.
  • Multi-touch Rule-Based Attribution Models incorporate information on the whole customer journey are thus an improvement compared to one touch models. To this family belong Linear model where credit is split equally between all channels, Bathtube model where 40% of credit is given to first and last clicks and the remaining 20% is distributed equally between the middle channels, or time-decay models where credit assigned to a click diminishes as the time between the click and the order increases..

The main advantages of rule-based models is their simplicity and cost effectiveness. The main problems are:

– They are a priori known and can thus lead to optimization strategies from competitors
– They do not take into account aggregate intelligence on customer journeys and actual incremental values.
– They tend to bias (depending on the model chosen) channels that are over-represented at the beggining or end of the funnel, according to theoretical assumptions that have no observationnal back-ups.

  • Data-Driven Attribution Models

These models take into account the weaknesses of rule-based models and make a relevant use of available data. Being data-driven, following attribution models cannot be computed using single user level data. On the contrary values are calculated through data aggregation and thus require a certain volume of customer journey information.

References:

https://dspace.mit.edu/handle/1721.1/64920


        3. Data-Driven Attribution Models in practice

                          3.1 Issues

Several issues arise in the computation of campaigns individual impact on a given KPI within a data-driven model.

  • Selection biases: Exposure to certain types of advertisement is usually highly correlated to non-observable variables which are in turn correlated to consumption practices. Differences in the behaviour of users exposed to different campaigns may thus only be driven by core differences in conversion probabilities between groups whether than by the campaign effect.
  • Complementarity: it may be that campaigns A and B only have an effect when combined, so that measuring their individual impact would lead to misleading conclusions. The model could then try to assess the effect of combinations of campaigns on top of the effect of individual campaigns. As the number of possible non-ordered combinations of k campaigns is 2k, it becomes clear that inclusing all possible combinations would however be time-consuming.
  • Order-sensitivity: The effect of a campaign A may depend on the place where it appears in the customer journey, meaning the rank of a campaign and not merely its presence could be accounted for in the model.
  • Relative Order-sensitivity: it may be that campaigns A and B only have an effect when one is exposed to campaign A before campaign B. If so, it could be useful to assess the effect of given combinations of campaigns as well. And this for all campaigns, leading to tremendous numbers of possible combinations.
  • All previous phenomenon may be present, increasing even more the potential complexity of a comprehensive Attribution Model. The number of all possible ordered combination of k campaigns is indeed :


                          3.2 Main models

                                  A) Logistic Regression and Classification models

If non converting journeys are available, Attribition Model can be shaped as a simple classification issue. Campaign types or campaigns combination and volume of campaign types can be included in the model along with customer or time variables. As we are interested in inference (on campaigns effect) whether than prediction, a parametric model should be used, such as Logistic Regression. Non paramatric models such as Random Forests or Neural Networks can also be used though the interpretation of campaigns value would be more difficult to derive from the model results.

A common pitfall is the usual issue of spurious correlations on one hand and the correct interpretation of coefficients in business terms.

An advantage if the possibility to evaluate the relevance of the model using common model validation methods to evaluate its predictive power (validation set \ AUC \pseudo R squared).

                                  B) Shapley Value

Theory

The Shapley Value is based on a Game Theory framework and is named after its creator, the Nobel Price Laureate Lloyd Shapley. Initially meant to calculate the marginal contribution of players in cooperative games, the model has received much attention in research and industry and has lately been applied to marketing issues. This model is typically used by Google Adords and other ad bidding vendors. Campaigns or marketing channels are in this model seen as compementary players looking forward to increasing a given KPI.
Contrarily to Logistic Regressions, it is a non-parametric model. Contrarily to Markov Chains, all results are built using existing journeys, and not simulated ones.

Channels are considered to enter the game sequentially under a certain joining order. Shapley value try to The Shapley value of channel i is the weighted sum of the marginal values that channel i adds to all possible coalitions that don’t contain channel i.
In other words, the main logic is to analyse the difference of gains when a channel i is added after a coalition Ck of k channels, k<=n. We then sum all the marginal contributions over all possible ordered combination Ck of all campaigns excluding i, with k<=n-1.

Subsets framework

A first an most usual way to compute the Shapley Vaue is to consider that when a channel enters coalition, its additionnal value is the same irrelevant of the order in which previous channels have appeared. In other words, journeys (A>B>C) and (B>A>C) trigger the same gains.
Shapley value is computed as the gains associated to adding a channel i to a subset of channels, weighted by the number of (ordered) sequences that the (unordered) subset represents, summed up on all possible subsets of the total set of campaigns where the channel i is not present.
The Shapley value of the channel ???????? is then:

where |S| is the number of campaigns of a coalition S and the sum extends over all subsets S that do not not contain channel j. ????(????)  is the value of the coalition S and ????(???? ∪ {????????})  the value of the coalition formed by adding ???????? to coalition S. ????(???? ∪ {????????}) − ????(????) is thus the marginal contribution of channel ???????? to the coalition S.

The formula can be rewritten and understood as:

This method is convenient when data on the gains of on all possible permutations of all unordered k subsets of the n campaigns are available. It is also more convenient if the order of campaigns prior to the introduction of a campaign is thought to have no impact.

Ordered sequences

Let us define ????((A>B)) as the value of the sequence A then B. What is we let ????((A>B)) be different from ????((B>A)) ?
This time we would need to sum over all possible permutation of the S campaigns present before  ???????? and the N-(S+1) campaigns after ????????. Doing so we will sum over all possible orderings (i.e all permutations of the n campaigns of the grand coalition containing all campaigns) and we can remove the permutation coefficient s!(p-s+1)!.

This method is convenient when the order of channels prior to and after the introduction of another channel is assumed to have an impact. It is also necessary to possess data for all possible permutations of all k subsets of the n campaigns, and not only on all (unordered) k-subsets of the n campaigns, k<=n. In other words, one must know the gains of A, B, C, A>B, B>A, etc. to compute the Shapley Value.

Differences between the two approaches

We simulate an ordered case where the value for each ordered sequence k for k<=3 is known. We compare it to the usual Shapley value calculated based on known gains of unordered subsets of campaigns. So as to compare relevant values, we have built the gains matrix so that the gains of a subset A, B i.e  ????({B,A}) is the average of the gains of ordered sequences made up with A and B (assuming the number of journeys where A>B equals the number of journeys where B>A, we have ????({B,A})=0.5( ????((A>B)) + ????((B>A)) ). We let the value of the grand coalition be different depending on the order of campaigns-keeping the constraints that it averages to the value used for the unordered case.

Note: mvA refers to the marginal value of A in a given sequence.
With traditionnal unordered coalitions:

With ordered sequences used to compute the marginal values:
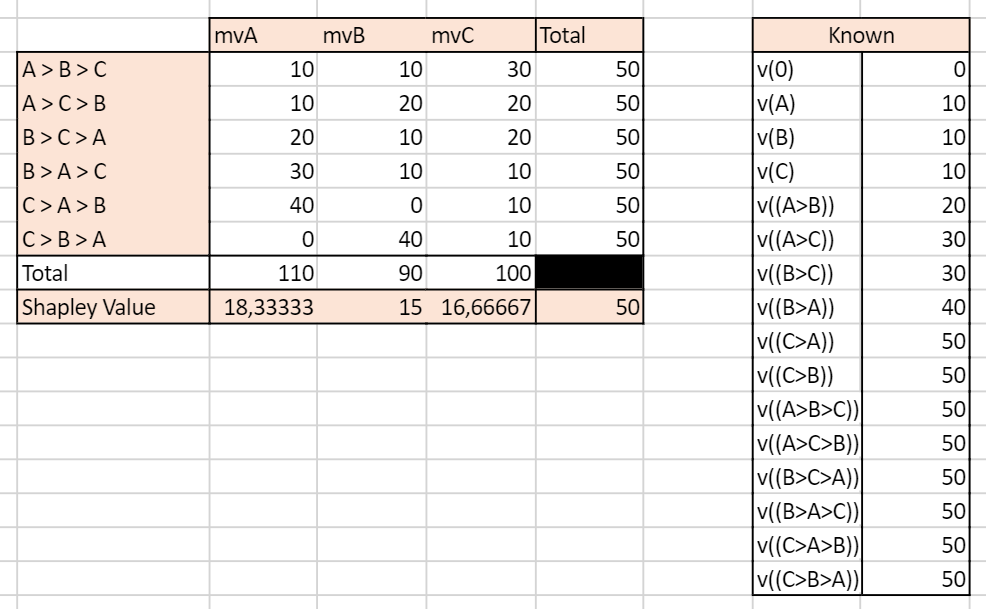
 

We can see that the two approaches yield very different results. In the unordered case, the Shapley Value campaign C is the highest, culminating at 20, while A and B have the same Shapley Value mvA=mvB=15. In the ordered case, campaign A has the highest Shapley Value and all campaigns have different Shapley Values.

This example illustrates the inherent differences between the set and sequences approach to Shapley values. Real life data is more likely to resemble the ordered case as conversion probabilities may for any given set of campaigns be influenced by the order through which the campaigns appear.

Advantages

Shapley value has become popular in allocation problems in cooperative games because it is the unique allocation which satisfies different axioms:

  • Efficiency: Shaple Values of all channels add up to the total gains (here, orders) observed.
  • Symmetry: if channels A and B bring the same contribution to any coalition of campaigns, then their Shapley Value i sthe same
  • Null player: if a channel brings no additionnal gains to all coalitions, then its Shapley Value is zero
  • Strong monotony: the Shapley Value of a player increases weakly if all its marginal contributions increase weakly

These properties make the Shapley Value close to what we intuitively define as a fair attribution.

Issues

  • The Shapley Value is based on combinatory mathematics, and the number of possible coalitions and ordered sequences becomes huge when the number of campaigns increases.
  • If unordered, the Shapley Value assumes the contribution of campaign A is the same if followed by campaign B or by C.
  • If ordered, the number of combinations for which data must be available and sufficient is huge.
  • Channels rarely present or present in long journeys will be played down.
  • Generally, gains are supposed to grow with the number of players in the game. However, it is plausible that in the marketing context a journey with a high number of channels will not necessarily bring more orders than a journey with less channels involved.

References:

R package: GameTheoryAllocation

Article:
Zhao & al, 2018 “Shapley Value Methods for Attribution Modeling in Online Advertising “
https://link.springer.com/content/pdf/10.1007/s13278-017-0480-z.pdf
Courses: https://www.lamsade.dauphine.fr/~airiau/Teaching/CoopGames/2011/coopgames-7%5b8up%5d.pdf
Blogs: https://towardsdatascience.com/one-feature-attribution-method-to-supposedly-rule-them-all-shapley-values-f3e04534983d

                                  B) Markov Chains

Markov Chains are used to model random processes, i.e events that occur in a sequential manner and in such a way that the probability to move to a certain state only depends on the past steps. The number of previous steps that are taken into account to model the transition probability is called the memory parameter of the sequence, and for the model to have a solution must be comprised between 0 and 4. A Markov Chain process is thus defined entirely by its Transition Matrix and its initial vector (i.e the starting point of the process).

Markov Chains are applied in many scientific fields. Typically, they are used in weather forecasting, with the sequence of Sunny and Rainy days following a Markov Process of memory parameter 0, so that for each given day the probability that the next day will be rainy or sunny only depends on the weather of the current day. Other applications can be found in sociology to understand the dynamics of social classes intergenerational reproduction. To get more both mathematical and applied illustration, I recommend the reading of this course.

In the marketing context, Markov Chains are an interesting way to model the conversion funnel. To go from the from the Markov Model to the Attribution logic, we calculate the Removal Effect of each channel, i.e the difference in conversions that happen if the channel is removed. Please read below for an introduction to the methodology.

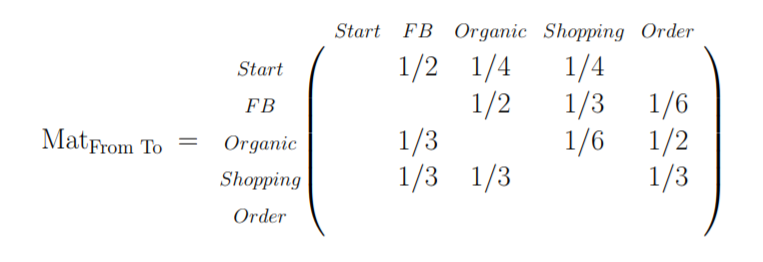
The first step in a Markov Chains Attribution Model is to build the transition matrix that captures the transition probabilities between the campaigns accross existing customer journeys. This Matrix is to be read as a “From state A to state B” table, from the left to the right. A first difficulty is finding the right memory parameter to use. A large memory parameter would allow to take more into account interraction effects within the conversion funnel but would lead to increased computationnal time, a non-readable transition matrix, and be more sensitive to noisy data. Please note that this transition matrix provides useful information on the conversion funnel and on the relationships between campaigns and can be used as such as an analytical tool. I suggest the clear and easily R code which can be found here or here.

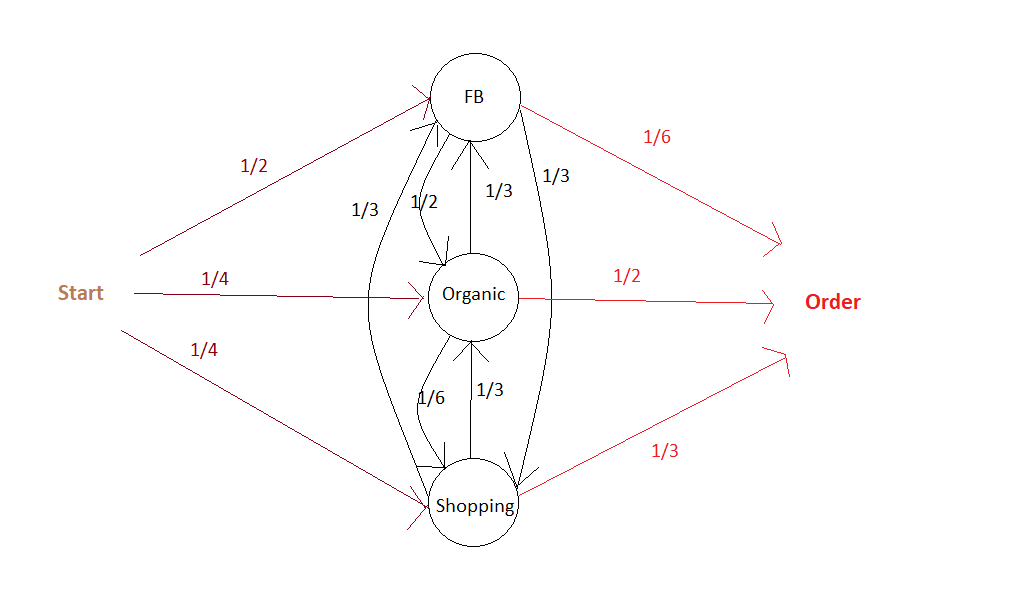
Here is an illustration of a Markov Chain with memory Parameter of 0: the probability to go to a certain campaign B in the next step only depend on the campaign we are currently at:
The associated Transition Matrix is then (with null probabilities left as Blank):
The second step is  to compute the actual responsibility of a channel in total conversions. As mentionned above, the main philosophy to do so is to calculate the Removal Effect of each channel, i.e the changes in the number of conversions when a channel is entirely removed. All customer journeys which went through this channel are settled out to be unsuccessful. This calculation is done by applying the transition matrix with and without the removed channels to an initial vector that contains the number of desired simulations.

Building on our current example, we can then settle an initial vector with the desired number of simulations, e.g 10 000:


It is possible at this stage to add a constraint on the maximum number of times the matrix is applied to the data, i.e on the maximal number of campaigns a simulated journey is allowed to have.

Advantages

  • The dynamic journey is taken into account, as well as the transition between two states. The funnel is not assumed to be linear.
  • It is possile to build a conversion graph that maps the customer journey provides valuable insights.
  • It is possible to evaluate partly the accuracy of the Attribution Model based on Markov Chains. It is for example possible to see how well the transition matrix help predict the future by analysing the number of correct predictions at any given step over all sequences.

Disadvantages

  • It can be somewhat difficult to set the memory parameter. Complementarity effects between channels are not well taken into account if the memory is low, but a parameter too high will lead to over-sensitivity to noise in the data and be difficult to implement if customer journeys tend to have a number of campaigns below this memory parameter.
  • Long journeys with different channels involved will be overweighted, as they will count many times in the Removal Effect.  For example, if there are n-1 channels in the customer journey, this journey will be considered as failure for the n-1 channel-RE. If the volume effects (i.e the impact of the overall number of channels in a journey, irrelevant from their type° are important then results may be biased.

References:

R package: ChannelAttribution

Git:

https://github.com/MatCyt/Markov-Chain/blob/master/README.md

Course:

https://www.ssc.wisc.edu/~jmontgom/markovchains.pdf

Article:

“Mapping the Customer Journey: A Graph-Based Framework for Online Attribution Modeling”; Anderl, Eva and Becker, Ingo and Wangenheim, Florian V. and Schumann, Jan Hendrik, 2014. Available at SSRN: https://ssrn.com/abstract=2343077 or http://dx.doi.org/10.2139/ssrn.2343077

“Media Exposure through the Funnel: A Model of Multi-Stage Attribution”, Abhishek & al, 2012

“Multichannel Marketing Attribution Using Markov Chains”, Kakalejčík, L., Bucko, J., Resende, P.A.A. and Ferencova, M. Journal of Applied Management and Investments, Vol. 7 No. 1, pp. 49-60.  2018

Blogs:

https://analyzecore.com/2016/08/03/attribution-model-r-part-1

https://analyzecore.com/2016/08/03/attribution-model-r-part-2

                          3.3 To go further: Tackling selection biases with Quasi-Experiments

Exposure to certain types of advertisement is usually highly correlated to non-observable variables. Differences in the behaviour of users exposed to different campaigns may thus only be driven by core differences in converison probabilities between groups whether than by the campaign effect. These potential selection effects may bias the results obtained using historical data.

Quasi-Experiments can help correct this selection effect while still using available observationnal data.  These methods recreate the settings on a randomized setting. The goal is to come as close as possible to the ideal of comparing two populations that are identical in all respects except for the advertising exposure. However, populations might still differ with respect to some unobserved characteristics.

Common quasi-experimental methods used for instance in Public Policy Evaluation are:

  • Discontinuity Regressions
  • Matching Methods, such as Exact Matching,  Propensity-score matching or k-nearest neighbourghs.

References:

Article:

“Towards a digital Attribution Model: Measuring the impact of display advertising on online consumer behaviour”, Anindya Ghose & al, MIS Quarterly Vol. 40 No. 4, pp. 1-XX, 2016

https://pdfs.semanticscholar.org/4fa6/1c53f281fa63a9f0617fbd794d54911a2f84.pdf

        4. First Steps towards a Practical Implementation

Identify key points of interests

  • Identify the nature of touchpoints available: is the data based on clicks? If so, is there a way to complement the data with A/B tests to measure the influence of ads without clicks (display, video) ? For example, what happens to sales when display campaign is removed? Analysing this multiplier effect would give the overall responsibility of display on sales, to be deduced from current attribution values given to click-based channels. More interestingly, what is the impact of the removal of display campaign on the occurences of click-based campaigns ? This would give us an idea of the impact of display ads on the exposure to each other campaigns, which would help correct the attribution values more precisely at the campaign level.
  • Define the KPI to track. From a pure Marketing perspective, looking at purchases may be sufficient, but from a financial perspective looking at profits, though a bit more difficult to compute, may drive more interesting results.
  • Define a customer journey. It may seem obvious, but the notion needs to be clarified at first. Would it be defined by a time limit? If so, which one? Does it end when a conversion is observed? For example, if a customer makes 2 purchases, would the campaigns he’s been exposed to before the first order still be accounted for in the second order? If so, with a time decay?
  • Define the research framework: are we interested only in customer journeys which have led to conversions or in all journeys? Keep in mind that successful customer journeys are a non-representative sample of customer journeys. Models built on the analysis of biased samples may be conservative. Take an extreme example: 80% of customers who see campaign A buy the product, VS 1% for campaign B. However, campaign B exposure is great and 100 Million people see it VS only 1M for campaign A. An Attribution Model based on successful journeys will give higher credit to campaign B which is an auguable conclusion. Taking into account costs per campaign (in the case where costs are calculated by clicks) may of course tackle this issue partly, as campaign A could then exhibit higher returns, but a serious fallacious reasonning is at stake here.

Analyse the typical customer journey    

  • Performing a duration analysis on the data may help you improve the definition of the customer journey to be used by your organization. After which days are converison probabilities null? Should we consider the effect of campaigns disappears after x days without orders? For example, if 99% of orders are placed in the 30 days following a first click, it might be interesting to define the customer journey as a 30 days time frame following the first oder.
  • Look at the distribution of the number of campaigns in a typical journey. If you choose to calculate the effect of campaigns interraction in your Attribution Model, it may indeed help you determine the maximum number of campaigns to be included in a combination. Indeed, you may not need to assess the impact of channel combinations with above than 4 different channels if 95% of orders are placed after less then 4 campaigns.
  • Transition matrixes: what if a campaign A systematically leads to a campaign B? What happens if we remove A or B? These insights would give clues to ask precise questions for a latter AB test, for example to find out if there is complementarity between channels A and B – (implying none should be removed) or mere substitution (implying one can be given up).
  • If conversion rates are available: it can be interesting to perform a survival analysis i.e to analyse the likelihood of conversion based on duration since first click. This could help us excluse potential outliers or individuals who have very low conversion probabilities.

Summary

Attribution is a complex topic which will probably never be definitively solved. Indeed, a main issue is the difficulty, or even impossibility, to evaluate precisely the accuracy of the attribution model that we’ve built. Attribution Models should be seen as a good yet always improvable approximation of the incremental values of campaigns, and be presented with their intrinsinc limits and biases.

A common trap when it comes to sampling from a population that intrinsically includes outliers

I will discuss a common fallacy concerning the conclusions drawn from calculating a sample mean and a sample standard deviation and more importantly how to avoid it.

Suppose you draw a random sample x_1, x_2, … x_N of size N and compute the ordinary (arithmetic) sample mean  x_m and a sample standard deviation sd from it.  Now if (and only if) the (true) population mean µ (first moment) and population variance (second moment) obtained from the actual underlying PDF  are finite, the numbers x_m and sd make the usual sense otherwise they are misleading as will be shown by an example.

By the way: The common correlation coefficient will also be undefined (or in practice always point to zero) in the presence of infinite population variances. Hopefully I will create an article discussing this related fallacy in the near future where a suitable generalization to Lévy-stable variables will be proposed.

 Drawing a random sample from a heavy tailed distribution and discussing certain measures

As an example suppose you have a one dimensional random walker whose step length is distributed by a symmetric standard Cauchy distribution (Lorentz-profile) with heavy tails, i.e. an alpha-stable distribution with alpha being equal to one. The PDF of an individual independent step is given by p(x) = \frac{\pi^{-1}}{(1 + x^2)} , thus neither the first nor the second moment exist whereby the first exists and vanishes at least in the sense of a principal value due to symmetry.

Still let us generate N = 3000 (pseudo) standard Cauchy random numbers in R* to analyze the behavior of their sample mean and standard deviation sd as a function of the reduced sample size n \leq N.

*The R-code is shown at the end of the article.

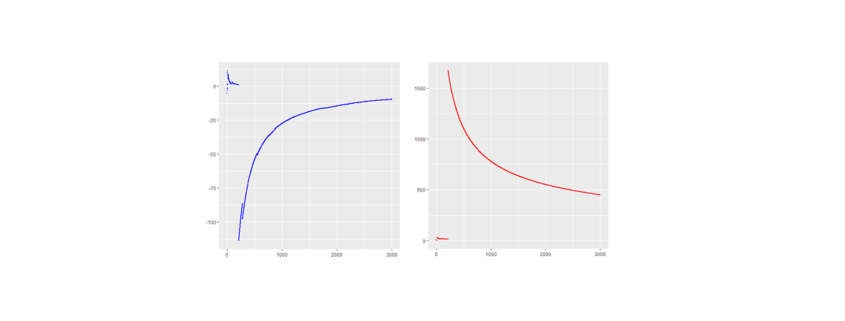
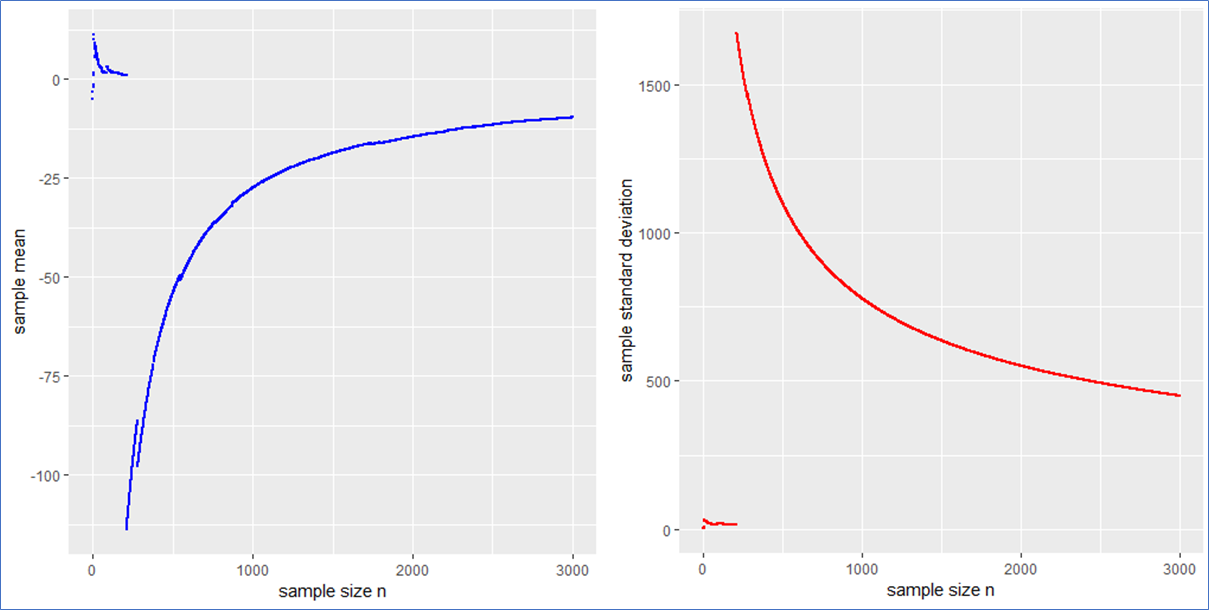
Here are the piecewise sample mean (in blue) and standard deviation (in red) for the mentioned Cauchy sampling. We see that both the sample mean and sd include jumps and do not converge.

Especially the mean deviates relatively largely from zero even after 3000 observations. The sample sd has no target due to the population variance being infinite.

If the data is new and no prior distribution is known, computing the sample mean and sd will be misleading. Astonishingly enough the sample mean itself will have the (formally exact) same distribution as the single step length p(x). This means that the sample mean is also standard Cauchy distributed implying that with a different Cauchy sample one could have easily observed different sample means far of the presented values in blue.

What sense does it make to present the usual interval x_m \pm sd / \sqrt{N} in such a case? What to do?

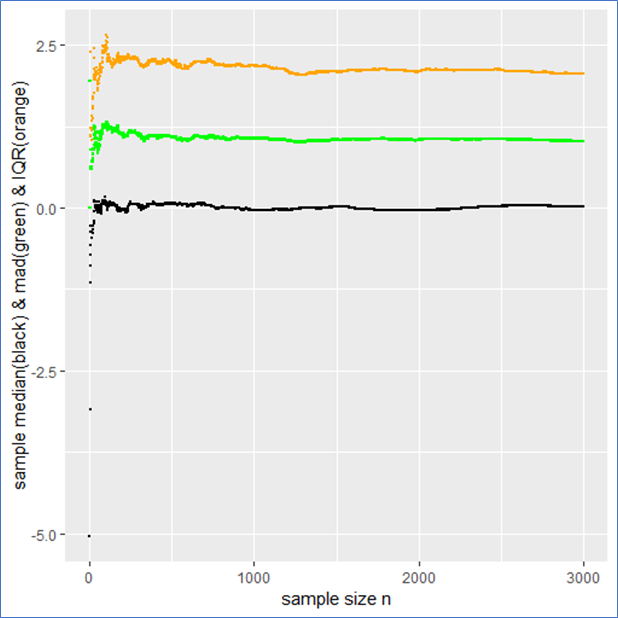
The sample median, median absolute difference (mad) and Inter-Quantile-Range (IQR) are more appropriate to describe such a data set including outliers intrinsically. To make this plausible I present the following plot, whereby the median is shown in black, the mad in green and the IQR in orange.

This example shows that the median, mad and IQR converge quickly against their assumed values and contain no major jumps. These quantities do an obviously better job in describing the sample. Even in the presence of outliers they remain robust, whereby the mad converges more quickly than the IQR. Note that a standard Cauchy sample will contain half of its sample in the interval median \pm mad meaning that the IQR is twice the mad.

Drawing a random sample from a PDF that has finite moments

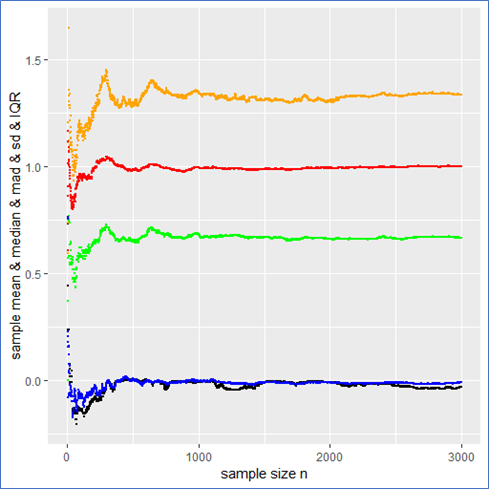
Just for comparison I also show the above quantities for a standard normal (pseudo) sample labeled with the same color as before as a counter example. In this case not only do both the sample mean and median but also the sd and mad converge towards their expected values (see plot below). Here all the quantities describe the data set properly and there is no trap since there are no intrinsic outliers. The sample mean itself follows a standard normal, so that the sd in deed makes sense and one could calculate a standard error \frac{sd}{\sqrt{N}} from it to present the usual stochastic confidence intervals for the sample mean.

A careful observation shows that in contrast to the Cauchy case here the sampled mean and sd converge more quickly than the sample median and the IQR. However still the sampled mad performs about as well as the sd. Again the mad is twice the IQR.

And here are the graphs of the prementioned quantities for a pseudo normal sample:

The take-home-message:

Just be careful when you observe outliers and calculate sample quantities right away, you might miss something. At best one carefully observes how the relevant quantities change with sample size as demonstrated in this article.

Such curves should become of broader interest in order to improve transparency in the Data Science process and reduce fallacies as well.

Thank you for reading.

P.S.: Feel free to play with the set random seed in the R-code below and observe how other quantities behave with rising sample size. Of course you can also try different PDFs at the beginning of the code. You can employ a Cauchy, Gaussian, uniform, exponential or Holtsmark (pseudo) random sample.


QUIZ: Which one of the recently mentioned random samples contains a trap** and why?

**in the context of this article


R-code used to generate the data and for producing plots:


#R-script for emphasizing convergence and divergence of sample means

####install and load relevant packages ####

#uncomment these lines if necessary
#install.packages(c('ggplot2',’stabledist’))
#library(ggplot2)
#library(stabledist)

#####drawing random samples #####

#Setting a random seed for being able to reproduce results  
set.seed(1234567)   
N= 2000     #sample size

#Choose a PDF from which a sample shall be drawn
#To do so (un)comment the respective lines of following code

data <- rcauchy(N)    # option1(default): standard Cauchy sampling

#data <- rnorm(N)     #option2: standard Gaussian sampling
                               
#data <- rexp(N)    # option3: standard exponential sampling

#data <- rstable(N,alpha=1.5,beta=0)  # option4: standard symmetric Holtsmark sampling

#data <- runif(N)              #option5: standard uniform sample

#####descriptive statistics####
#preparations/declarations

SUM = vector()
sd =vector()
mean = vector()
SQ =vector()
SQUARES = vector()
median = vector()
mad =vector()
quantiles = data.frame()
sem =vector()

#piecewise calculaion of descrptive quantities

for (k in 1:length(data)){              #mainloop
SUM[k] <- sum(data[1:k])            # sum of sample
mean[k] <- mean(data[1:k])          # arithmetic mean
sd[k] <- sd(data[1:k])              # standard deviation
sem[k] <- sd[k]/(sqrt(k))          #standard error of the sample mean (for finite variances)
mad[k] <- mad(data[1:k],const=1)   # median absolute deviation    

for (j in 1:5){
qq <- quantile(data[1:k],na.rm = T)
quantiles[k,j] <- qq[j]         #quantiles of sample
}
colnames(quantiles) <- c('min','Q1','median','Q3','max')

for (i in 1:length(data[1:k])){
SQUARES[i] <- data[i]*data[i]    
}
SQ[k] <- sum(SQUARES[1:k])    #sum of squares of random sample
}  #end of mainloop

#create table containing all relevant data
TABLE <-  as.data.frame(cbind(quantiles,mean,sd,SQ,SUM,sem))


#####plotting results###
x11()
print(ggplot(TABLE,aes(1:N,median))+
geom_point(size=.5)+xlab('sample size n')+ylab('sample median'))
x11()
print(ggplot(TABLE,aes(1:N,mad))+geom_point(size=.5,color ='green')+
xlab('sample size n')+ylab('sample median absolute difference'))
x11()
print(ggplot(TABLE,aes(1:N,sd))+geom_point(size=.5,color ='red')+
xlab('sample size n')+ylab('sample standard deviation'))
x11()
print(ggplot(TABLE,aes(1:N,mean))+geom_point(size=.5, color ='blue')+
xlab('sample size n')+ylab('sample mean'))
x11()
print(ggplot(TABLE,aes(1:N,Q3-Q1))+geom_point(size=.5, color ='blue')+
xlab('sample size n')+ylab('IQR'))

#uncomment the following lines of code to see further plots

#x11()
#print(ggplot(TABLE,aes(1:N,sem))+geom_point(size=.5)+
#xlab('sample size n')+ylab('sample sum of r.v.'))
#x11()
#print(ggplot(TABLE,aes(1:N,SUM))+geom_point(size=.5)+
#xlab('sample size n')+ylab('sample sum of r.v.'))
#x11()
#print(ggplot(TABLE,aes(1:N,SQ))+geom_point(size=.5)+
#xlab('sample size n')+ylab('sample sum of squares'))


The Inside Out of ML Based Prescriptive Analytics

With the constantly growing number of data, more and more companies are shifting towards analytic solutions. Analytic solutions help in extracting the meaning from the huge amount of data available. Thus, improving decision making.

Decision making is an important aspect of businesses, and technologies like Machine Learning are enhancing it further. The growing use of Machine Learning has changed the way of prescriptive analytics. In order to optimize the efforts, companies need to be more accurate with the historical and present data. This is because the historical and present data are the essentials of analytics. This article helps describe the inside out of Machine Learning-based prescriptive analytics.

Phases of business analytics

Descriptive analytics, predictive analytics, and prescriptive analytics are the three phases of business analytics. Descriptive analytics, being the first one, deals with past performance. Historical data is mined to understand past performance. This serves as a way to look for the reasons behind past success and failure. It is a kind of post-mortem analysis and most management reporting like sales, marketing, operations, and finance etc. make use of this.

The second one is a predictive analysis which answers the question of what is likely to happen. The historical data is now combined with rules, algorithms etc. to determine the possible future outcome or likelihood of a situation occurring.

The final phase, well known to everyone, is prescriptive analytics. It can continually take in new data and re-predict and re-prescribe. This improves the accuracy of the prediction and prescribes better decision options.  Professional services or technology or their combination can be chosen to perform all the three analytics.

More about prescriptive analytics

The analysis of business activities goes through many phases. Prescriptive analytics is one such. It is known to be the third phase of business analytics and comes after descriptive and predictive analytics. It entails the application of mathematical and computational sciences. It makes use of the results obtained from descriptive and predictive analysis to suggest decision options. It goes beyond predicting future outcomes and suggests actions to benefit from the predictions. It shows the implications of each decision option. It anticipates on what will happen when it will happen as well as why it will happen.

ML-based prescriptive analytics

Being just before the prescriptive analytics, predictive analytics is often confused with it. What actually happens is predictive analysis leads to prescriptive analysis. Thus, a Machine Learning based prescriptive analytics goes through an ML-based predictive analysis first. Therefore, it becomes necessary to consider the ML-based predictive analysis first.

ML-based predictive analytics:

A lot of things prevent businesses from achieving predictive analysis capabilities.  Machine Learning can be a great help in boosting Predictive analytics. Use of Machine Learning and Artificial Intelligence algorithms helps businesses in optimizing and uncovering the new statistical patterns. These statistical patterns form the backbone of predictive analysis. E-commerce, marketing, customer service, medical diagnosis etc. are some of the prospective use cases for Machine Learning based predictive analytics.

In E-commerce, machine learning can help in predicting the usual choices of the customer. Thus, presenting him/her according to his/her likes and dislikes. It can also help in predicting fraudulent transaction. Similarly, B2B marketing also makes good use of Machine learning based predictive analytics. Customer services and medical diagnosis also benefit from predictive analytics. Thus, a prediction and a prescription based on machine learning can boost various business functions.

Organizations and software development companies are making more and more use of machine learning based predictive analytics. The advancements like neural networks and deep learning algorithms are able to uncover hidden information. This all requires a well-researched approach. Big data and progressive IT systems also act as important factors in this.

Sentiment Analysis using Python

One of the applications of text mining is sentiment analysis. Most of the data is getting generated in textual format and in the past few years, people are talking more about NLP. Improvement is a continuous process many product based companies leverage these text mining techniques to examine the sentiments of the customers to find about what they can improve in the product. This information also helps them to understand the trend and demand of the end user which results in Customer satisfaction.

As text mining is a vast concept, the article is divided into two subchapters. The main focus of this article will be calculating two scores: sentiment polarity and subjectivity using python. The range of polarity is from -1 to 1(negative to positive) and will tell us if the text contains positive or negative feedback. Most companies prefer to stop their analysis here but in our second article, we will try to extend our analysis by creating some labels out of these scores. Finally, a multi-label multi-class classifier can be trained to predict future reviews.

Without any delay let’s deep dive into the code and mine some knowledge from textual data.

There are a few NLP libraries existing in Python such as Spacy, NLTK, gensim, TextBlob, etc. For this particular article, we will be using NLTK for pre-processing and TextBlob to calculate sentiment polarity and subjectivity.

import pandas as pd
import matplotlib.pyplot as plt
%matplotlib inline  
import nltk
from nltk import word_tokenize, sent_tokenize
from nltk.corpus import stopwords
from nltk.stem import LancasterStemmer, WordNetLemmatizer, PorterStemmer
from wordcloud import WordCloud, STOPWORDS
from textblob import TextBlob

The dataset is available here for download and we will be using pandas read_csv function to import the dataset. I would like to share an additional information here which I came to know about recently. Those who have already used python and pandas before they probably know that read_csv is by far one of the most used function. However, it can take a while to upload a big file. Some folks from  RISELab at UC Berkeley created Modin or Pandas on Ray which is a library that speeds up this process by changing a single line of code.

amz_reviews = pd.read_csv("1429_1.csv")

After importing the dataset it is recommended to understand it first and study the structure of the dataset. At this point we are interested to know how many columns are there and what are these columns so I am going to check the shape of the data frame and go through each column name to see if we need them or not.

amz_reviews.shape
(34660, 21)

amz_reviews.columns
Index(['id', 'name', 'asins', 'brand', 'categories', 'keys', 'manufacturer',
       'reviews.date', 'reviews.dateAdded', 'reviews.dateSeen',
       'reviews.didPurchase', 'reviews.doRecommend', 'reviews.id',
       'reviews.numHelpful', 'reviews.rating', 'reviews.sourceURLs',
       'reviews.text', 'reviews.title', 'reviews.userCity',
       'reviews.userProvince', 'reviews.username'],
      dtype='object')


There are so many columns which are not useful for our sentiment analysis and it’s better to remove these columns. There are many ways to do that: either just select the columns which you want to keep or select the columns you want to remove and then use the drop function to remove it from the data frame. I prefer the second option as it allows me to look at each column one more time so I don’t miss any important variable for the analysis.

columns = ['id','name','keys','manufacturer','reviews.dateAdded', 'reviews.date','reviews.didPurchase',
          'reviews.userCity', 'reviews.userProvince', 'reviews.dateSeen', 'reviews.doRecommend','asins',
          'reviews.id', 'reviews.numHelpful', 'reviews.sourceURLs', 'reviews.title']

df = pd.DataFrame(amz_reviews.drop(columns,axis=1,inplace=False))

Now let’s dive deep into the data and try to mine some knowledge from the remaining columns. The first step we would want to follow here is just to look at the distribution of the variables and try to make some notes. First, let’s look at the distribution of the ratings.

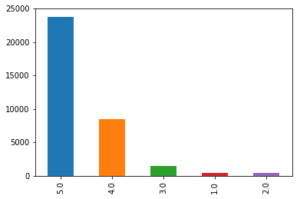
df['reviews.rating'].value_counts().plot(kind='bar')

Graphs are powerful and at this point, just by looking at the above bar graph we can conclude that most people are somehow satisfied with the products offered at Amazon. The reason I am saying ‘at’ Amazon is because it is just a platform where anyone can sell their products and the user are giving ratings to the product and not to Amazon. However, if the user is satisfied with the products it also means that Amazon has a lower return rate and lower fraud case (from seller side). The job of a Data Scientist relies not only on how good a model is but also on how useful it is for the business and that’s why these business insights are really important.

Data pre-processing for textual variables

Lowercasing

Before we move forward to calculate the sentiment scores for each review it is important to pre-process the textual data. Lowercasing helps in the process of normalization which is an important step to keep the words in a uniform manner (Welbers, et al., 2017, pp. 245-265).

## Change the reviews type to string
df['reviews.text'] = df['reviews.text'].astype(str)

## Before lowercasing 
df['reviews.text'][2]
'Inexpensive tablet for him to use and learn on, step up from the NABI. He was thrilled with it, learn how to Skype on it 
already...'

## Lowercase all reviews
df['reviews.text'] = df['reviews.text'].apply(lambda x: " ".join(x.lower() for x in x.split()))
df['reviews.text'][2] ## to see the difference
'inexpensive tablet for him to use and learn on, step up from the nabi. he was thrilled with it, learn how to skype on it 
already...'

Special characters

Special characters are non-alphabetic and non-numeric values such as {!,@#$%^ *()~;:/<>|+_-[]?}. Dealing with numbers is straightforward but special characters can be sometimes tricky. During tokenization, special characters create their own tokens and again not helpful for any algorithm, likewise, numbers.

## remove punctuation
df['reviews.text'] = df['reviews.text'].str.replace('[^ws]','')
df['reviews.text'][2]
'inexpensive tablet for him to use and learn on step up from the nabi he was thrilled with it learn how to skype on it already'

Stopwords

Stop-words being most commonly used in the English language; however, these words have no predictive power in reality. Words such as I, me, myself, he, she, they, our, mine, you, yours etc.

stop = stopwords.words('english')
df['reviews.text'] = df['reviews.text'].apply(lambda x: " ".join(x for x in x.split() if x not in stop))
df['reviews.text'][2]
'inexpensive tablet use learn step nabi thrilled learn skype already'

Stemming

Stemming algorithm is very useful in the field of text mining and helps to gain relevant information as it reduces all words with the same roots to a common form by removing suffixes such as -action, ing, -es and -ses. However, there can be problematic where there are spelling errors.

st = PorterStemmer()
df['reviews.text'] = df['reviews.text'].apply(lambda x: " ".join([st.stem(word) for word in x.split()]))
df['reviews.text'][2]
'inexpens tablet use learn step nabi thrill learn skype alreadi'

This step is extremely useful for pre-processing textual data but it also depends on your goal. Here our goal is to calculate sentiment scores and if you look closely to the above code words like ‘inexpensive’ and ‘thrilled’ became ‘inexpens’ and ‘thrill’ after applying this technique. This will help us in text classification to deal with the curse of dimensionality but to calculate the sentiment score this process is not useful.

Sentiment Score

It is now time to calculate sentiment scores of each review and check how these scores look like.

## Define a function which can be applied to calculate the score for the whole dataset

def senti(x):
    return TextBlob(x).sentiment  

df['senti_score'] = df['reviews.text'].apply(senti)

df.senti_score.head()

0                                   (0.3, 0.8)
1                                (0.65, 0.675)
2                                   (0.0, 0.0)
3    (0.29545454545454547, 0.6492424242424243)
4                    (0.5, 0.5827777777777777)
Name: senti_score, dtype: object

As it can be observed there are two scores: the first score is sentiment polarity which tells if the sentiment is positive or negative and the second score is subjectivity score to tell how subjective is the text.

In my next article, we will extend this analysis by creating labels based on these scores and finally we will train a classification model.

Sentiment Analysis using Python

One of the applications of text mining is sentiment analysis. Most of the data is getting generated in textual format and in the past few years, people are talking more about NLP. Improvement is a continuous process and many product based companies leverage these text mining techniques to examine the sentiments of the customers to find about what they can improve in the product. This information also helps them to understand the trend and demand of the end user which results in Customer satisfaction.

As text mining is a vast concept, the article is divided into two subchapters. The main focus of this article will be calculating two scores: sentiment polarity and subjectivity using python. The range of polarity is from -1 to 1(negative to positive) and will tell us if the text contains positive or negative feedback. Most companies prefer to stop their analysis here but in our second article, we will try to extend our analysis by creating some labels out of these scores. Finally, a multi-label multi-class classifier can be trained to predict future reviews.

Without any delay let’s deep dive into the code and mine some knowledge from textual data.

There are a few NLP libraries existing in Python such as Spacy, NLTK, gensim, TextBlob, etc. For this particular article, we will be using NLTK for pre-processing and TextBlob to calculate sentiment polarity and subjectivity.

import pandas as pd
import matplotlib.pyplot as plt
%matplotlib inline  
import nltk
from nltk import word_tokenize, sent_tokenize
from nltk.corpus import stopwords
from nltk.stem import LancasterStemmer, WordNetLemmatizer, PorterStemmer
from wordcloud import WordCloud, STOPWORDS
from textblob import TextBlob

The dataset is available here for download and we will be using pandas read_csv function to import the dataset. I would like to share an additional information here which I came to know about recently. Those who have already used python and pandas before they probably know that read_csv is by far one of the most used function. However, it can take a while to upload a big file. Some folks from  RISELab at UC Berkeley created Modin or Pandas on Ray which is a library that speeds up this process by changing a single line of code.

amz_reviews = pd.read_csv("1429_1.csv")

After importing the dataset it is recommended to understand it first and study the structure of the dataset. At this point we are interested to know how many columns are there and what are these columns so I am going to check the shape of the data frame and go through each column name to see if we need them or not.

amz_reviews.shape
(34660, 21)

amz_reviews.columns
Index(['id', 'name', 'asins', 'brand', 'categories', 'keys', 'manufacturer',
       'reviews.date', 'reviews.dateAdded', 'reviews.dateSeen',
       'reviews.didPurchase', 'reviews.doRecommend', 'reviews.id',
       'reviews.numHelpful', 'reviews.rating', 'reviews.sourceURLs',
       'reviews.text', 'reviews.title', 'reviews.userCity',
       'reviews.userProvince', 'reviews.username'],
      dtype='object')


There are so many columns which are not useful for our sentiment analysis and it’s better to remove these columns. There are many ways to do that: either just select the columns which you want to keep or select the columns you want to remove and then use the drop function to remove it from the data frame. I prefer the second option as it allows me to look at each column one more time so I don’t miss any important variable for the analysis.

columns = ['id','name','keys','manufacturer','reviews.dateAdded', 'reviews.date','reviews.didPurchase',
          'reviews.userCity', 'reviews.userProvince', 'reviews.dateSeen', 'reviews.doRecommend','asins',
          'reviews.id', 'reviews.numHelpful', 'reviews.sourceURLs', 'reviews.title']

df = pd.DataFrame(amz_reviews.drop(columns,axis=1,inplace=False))

Now let’s dive deep into the data and try to mine some knowledge from the remaining columns. The first step we would want to follow here is just to look at the distribution of the variables and try to make some notes. First, let’s look at the distribution of the ratings.

df['reviews.rating'].value_counts().plot(kind='bar')

Graphs are powerful and at this point, just by looking at the above bar graph we can conclude that most people are somehow satisfied with the products offered at Amazon. The reason I am saying ‘at’ Amazon is because it is just a platform where anyone can sell their products and the user are giving ratings to the product and not to Amazon. However, if the user is satisfied with the products it also means that Amazon has a lower return rate and lower fraud case (from seller side). The job of a Data Scientist relies not only on how good a model is but also on how useful it is for the business and that’s why these business insights are really important.

Data pre-processing for textual variables

Lowercasing

Before we move forward to calculate the sentiment scores for each review it is important to pre-process the textual data. Lowercasing helps in the process of normalization which is an important step to keep the words in a uniform manner (Welbers, et al., 2017, pp. 245-265).

## Change the reviews type to string
df['reviews.text'] = df['reviews.text'].astype(str)

## Before lowercasing 
df['reviews.text'][2]
'Inexpensive tablet for him to use and learn on, step up from the NABI. He was thrilled with it, learn how to Skype on it 
already...'

## Lowercase all reviews
df['reviews.text'] = df['reviews.text'].apply(lambda x: " ".join(x.lower() for x in x.split()))
df['reviews.text'][2] ## to see the difference
'inexpensive tablet for him to use and learn on, step up from the nabi. he was thrilled with it, learn how to skype on it 
already...'

Special characters

Special characters are non-alphabetic and non-numeric values such as {!,@#$%^ *()~;:/<>|+_-[]?}. Dealing with numbers is straightforward but special characters can be sometimes tricky. During tokenization, special characters create their own tokens and again not helpful for any algorithm, likewise, numbers.

## remove punctuation
df['reviews.text'] = df['reviews.text'].str.replace('[^ws]','')
df['reviews.text'][2]
'inexpensive tablet for him to use and learn on step up from the nabi he was thrilled with it learn how to skype on it already'

Stopwords

Stop-words being most commonly used in the English language; however, these words have no predictive power in reality. Words such as I, me, myself, he, she, they, our, mine, you, yours etc.

stop = stopwords.words('english')
df['reviews.text'] = df['reviews.text'].apply(lambda x: " ".join(x for x in x.split() if x not in stop))
df['reviews.text'][2]
'inexpensive tablet use learn step nabi thrilled learn skype already'

Stemming

Stemming algorithm is very useful in the field of text mining and helps to gain relevant information as it reduces all words with the same roots to a common form by removing suffixes such as -action, ing, -es and -ses. However, there can be problematic where there are spelling errors.

st = PorterStemmer()
df['reviews.text'] = df['reviews.text'].apply(lambda x: " ".join([st.stem(word) for word in x.split()]))
df['reviews.text'][2]
'inexpens tablet use learn step nabi thrill learn skype alreadi'

This step is extremely useful for pre-processing textual data but it also depends on your goal. Here our goal is to calculate sentiment scores and if you look closely to the above code words like ‘inexpensive’ and ‘thrilled’ became ‘inexpens’ and ‘thrill’ after applying this technique. This will help us in text classification to deal with the curse of dimensionality but to calculate the sentiment score this process is not useful.

Sentiment Score

It is now time to calculate sentiment scores of each review and check how these scores look like.

## Define a function which can be applied to calculate the score for the whole dataset

def senti(x):
    return TextBlob(x).sentiment  

df['senti_score'] = df['reviews.text'].apply(senti)

df.senti_score.head()

0                                   (0.3, 0.8)
1                                (0.65, 0.675)
2                                   (0.0, 0.0)
3    (0.29545454545454547, 0.6492424242424243)
4                    (0.5, 0.5827777777777777)
Name: senti_score, dtype: object

As it can be observed there are two scores: the first score is sentiment polarity which tells if the sentiment is positive or negative and the second score is subjectivity score to tell how subjective is the text. The whole code is available here.

In my next article, we will extend this analysis by creating labels based on these scores and finally we will train a classification model.

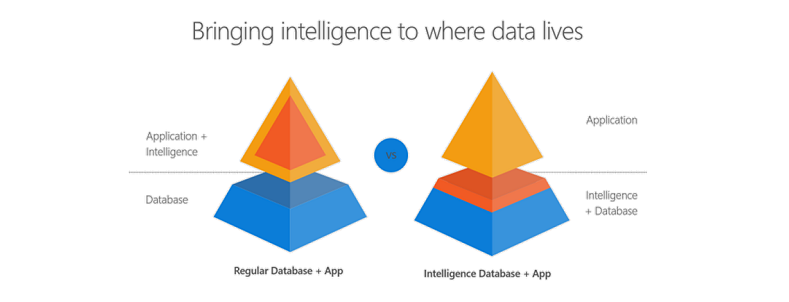
Bringing intelligence to where data lives: Python & R embedded in T-SQL

Introduction

Did you know that you can write R and Python code within your T-SQL statements? Machine Learning Services in SQL Server eliminates the need for data movement. Instead of transferring large and sensitive data over the network or losing accuracy with sample csv files, you can have your R/Python code execute within your database. Easily deploy your R/Python code with SQL stored procedures making them accessible in your ETL processes or to any application. Train and store machine learning models in your database bringing intelligence to where your data lives.

You can install and run any of the latest open source R/Python packages to build Deep Learning and AI applications on large amounts of data in SQL Server. We also offer leading edge, high-performance algorithms in Microsoft’s RevoScaleR and RevoScalePy APIs. Using these with the latest innovations in the open source world allows you to bring unparalleled selection, performance, and scale to your applications.

If you are excited to try out SQL Server Machine Learning Services, check out the hands on tutorial below. If you do not have Machine Learning Services installed in SQL Server,you will first want to follow the getting started tutorial I published here: 

How-To Tutorial

In this tutorial, I will cover the basics of how to Execute R and Python in T-SQL statements. If you prefer learning through videos, I also published the tutorial on YouTube.

Basics

Open up SQL Server Management Studio and make a connection to your server. Open a new query and paste this basic example: (While I use Python in these samples, you can do everything with R as well)

EXEC sp_execute_external_script @language = N'Python',
@script = N'print(3+4)'

Sp_execute_external_script is a special system stored procedure that enables R and Python execution in SQL Server. There is a “language” parameter that allows us to choose between Python and R. There is a “script” parameter where we can paste R or Python code. If you do not see an output print 7, go back and review the setup steps in this article.

Parameter Introduction

Now that we discussed a basic example, let’s start adding more pieces:

EXEC sp_execute_external_script  @language =N'Python', 
@script = N' 
OutputDataSet = InputDataSet;
',
@input_data_1 =N'SELECT 1 AS Col1';

Machine Learning Services provides more natural communications between SQL and R/Python with an input data parameter that accepts any SQL query. The input parameter name is called “input_data_1”.
You can see in the python code that there are default variables defined to pass data between Python and SQL. The default variable names are “OutputDataSet” and “InputDataSet” You can change these default names like this example:

EXEC sp_execute_external_script  @language =N'Python', 
@script = N' 
MyOutput = MyInput;
',
@input_data_1_name = N'MyInput',
@input_data_1 =N'SELECT 1 AS foo',
@output_data_1_name =N'MyOutput';

As you executed these examples, you might have noticed that they each return a result with “(No column name)”? You can specify a name for the columns that are returned by adding the WITH RESULT SETS clause to the end of the statement which is a comma separated list of columns and their datatypes.

EXEC sp_execute_external_script  @language =N'Python', 
@script=N' 
MyOutput = MyInput;
',
@input_data_1_name = N'MyInput',
@input_data_1 =N'
SELECT 1 AS foo,
2 AS bar
',
@output_data_1_name =N'MyOutput'
WITH RESULT SETS ((MyColName int, MyColName2 int));

Input/Output Data Types

Alright, let’s discuss a little more about the input/output data types used between SQL and Python. Your input SQL SELECT statement passes a “Dataframe” to python relying on the Python Pandas package. Your output from Python back to SQL also needs to be in a Pandas Dataframe object. If you need to convert scalar values into a dataframe here is an example:

EXEC sp_execute_external_script  @language =N'Python', 
@script=N' 
import pandas as pd
c = 1/2
d = 1*2
s = pd.Series([c,d])
df = pd.DataFrame(s)
OutputDataSet = df
'

Variables c and d are both scalar values, which you can add to a pandas Series if you like, and then convert them to a pandas dataframe. This one shows a little bit more complicated example, go read up on the python pandas package documentation for more details and examples:

EXEC sp_execute_external_script  @language =N'Python', 
@script=N' 
import pandas as pd
s = {"col1": [1, 2], "col2": [3, 4]}
df = pd.DataFrame(s)
OutputDataSet = df
'

You now know the basics to execute Python in T-SQL!

Did you know you can also write your R and Python code in your favorite IDE like RStudio and Jupyter Notebooks and then remotely send the execution of that code to SQL Server? Check out these documentation links to learn more: https://aka.ms/R-RemoteSQLExecution https://aka.ms/PythonRemoteSQLExecution

Check out the SQL Server Machine Learning Services documentation page for more documentation, samples, and solutions. Check out these E2E tutorials on github as well.

Would love to hear from you! Leave a comment below to ask a question, or start a discussion!

OLAP Technology in Business Intelligence

Data in Business Intelligence
Business processes traditionally comprise three stages of data management: collecting, analyzing, and reporting. First, data should be gathered from all the sources through ETL tools (Extract, Transform, Load). After this, there are often issues occurring connected with data consistency hence the data should be cleaned and structured using the function of metadata. Once the data are provided to the end-user in a readable and transparent way it is ready to be analyzed. There are multiple applications ensuring data analysis including Data Mining, OLAP, BI. In order to carry out in-depth and coherent analysis, the best approach is to initially determine KPI as these are the criteria to assess the progress in relation to the goals set.

OLAP definition
OLAP tool belongs to Business Intelligence concept intended for big data management and is short for Online Analytical Processing. OLAP conducts multidimensional data analysis and enables end-users to perform complicated calculations, trend analysis, ‘what-if’ scenarios and the like. Furthermore, owing to OLAP it’s possible to conduct planning and forecasting, budgeting and financial reporting, analysis, and data modeling which contributes to successful decision making in business.

OLAP Structure
An OLAP cube is composed of dimensions containing aggregated information referred to and measures which include numerical data. Dimensions are arranged in hierarchies which in their turn are indicators to determine the rate of granularity; the rate is called a level. The most common dimensions are location, product, and time. The lowest granularity level of a time dimension may be hours while the highest one can present years. This way when there is a query to be responded the measures contribute to filter out the data and select the right object inside the dimension. In the center of the cube there is a star or a snowflake schema which all the dimensions refer to.

OLAP main characteristics
Here are the main features characterizing the OLAP tool”:

– The data in OLAP is structured as a multidimensional cube.
– The cube structure allows users to see the information from various angles given location, products, demographics, time, etc.
– Rapid data access and analysis due to precalculated aggregations.
– Simple and intuitive interface.
– OLAP doesn’t require IT skills or SQL knowledge (as some other business intelligence software tools). Hence its operation eases the burden of IT department.
– The tool supports complex custom calculations
– The OLAP databases maintain historical data and are updated not constantly but regularly.
– The cube design and building process is the pivotal step on the way to successful data processing.

OLAP requirements
When the OLAP technology was invented there were twelve rules generated to follow so that it complies with the concept of online data processing:

Multidimensional
Not only the OLAP view has to be multidimensional but the data should as well be stored in this way of structure in order to provide the multidimensional analysis.

Transparent
The architecture has to be transparent to let the user see and understand the functionality and the client server of the application.

Accessible
The end user must have an opportunity to access the information in its consistent view without any issues related to the sources where the data come from or the way the data are maintained in OLAP.

Consistent Reporting
The data are regularly upgraded and its volume grows progressively although the user shouldn’t see problems changes in the process of scheduled reporting regarding that.

Client-Server
OLAP application has to manage client-server architecture as it manages vast volumes of data often requiring a core server for storage and maintenance.

Common Dimensionality
The main feature of the dimension structure in OLAP must be the same for all the dimensions to keep the data consistent, accurate, valid, complete, etc. Thus the dimensions have to possess common operation capabilities and be equal in structure.

Dynamic Sparse Matrix Handling
A usual OLAP application must manage to deal with sparse matrices and shouldn’t let the cube expand excessively as a usual OLAP cube is relatively sparse.

Multi-User
OLAP technology is originally supposed to provide an opportunity to access the data for multiple users simultaneously. The process of data management must at the same time be ensured with security and integrity.

Unrestricted Cross-dimensional Operations
A typical OLAP application is meant to handle all calculations and operations (such as slice-and-dice, drill up-down, drill through etc.) without the participation of the user. Commonly the tool delivers a language to exploit while requiring specified information.

Intuitive Data Manipulation
All OLAP operations which handle dimensions, measures, hierarchies, levels etc. have to be user-friendly and easily adopted without requiring additional technical skills. An average employee is considered to cope with the data navigation and management through clear displaying and handy operations.

Flexible Reporting
The main function – reporting must be flexible with a view to organizing all the rows, columns, and page setup containing a requisite number of dimensions and hierarchies from the data. As a result, the user has to gain a report comprising all the needed members and the relations between them.

Unlimited Dimensions and Aggregation Levels
When the technology was designed it was intended to be able to contain up to twenty dimensions in the cube. Each dimension had to provide as many aggregation levels inside a hierarchy as required. The idea was to manage great volumes of data keeping end-users absolutely aware of the performance of the organization.

Advantages of OLAP
Speed
Before OLAP was invented and introduced to the market there hadn’t been a tool to rapidly run the queries and it had taken long to retrieve the required information from the data. Thus the main advantage of the OLAP application is its speed gained due to precomputation of the data aggregations.

MDX designer and ad-hoc reports
MDX Designer is aimed at creating interactive ad-hoc reports. The reports provide a better understanding of the business processes and the organization’s performance in the market.

Visualization
OLAP provides its users with sophisticated data analytics allowing them to see data from different perspectives. There are numerous formats to visualize the requisite data: pie charts, graphs, heat maps, reports, pyramids, etc. Moreover, OLAP includes a number of operations to handle data: rotate, drill up and down, slice and dice, etc. Besides, there’s also an opportunity to apply a ‘what-if’ scenario due to a write-back option. All mentioned above can significantly contribute to decision-making process regarding the ongoing situation.

Flexibility
OLAP table displayed is flexible with column and row labels depending on the requirements of the user. Moreover, the reporting generated is available in multiple dimensions.

Process Analytics – Data Analysis for Process Audit & Improvement

Process Mining: Innovative data analysis for process optimization and audit

Step-by-Step: New ways to detect compliance violations with Process Analytics

In the course of the advancing digitization, an enormous upheaval of everyday work is currently taking place to ensure the complete recording of all steps in IT systems. In addition, companies are increasingly confronted with increasingly demanding regulatory requirements on their IT systems.


Read this article in German:
“Process Mining: Innovative Analyse von Datenspuren für Audit und Forensik “


The unstoppable trend towards a connected world will further increase the possibilities of process transparency, but many processes in the company area are already covered by one or more IT systems. Each employee, as well as any automated process, leaves many data traces in IT backend systems, from which processes can be replicated retroactively or in real time. These include both obvious processes, such as the entry of a recorded purchase order or invoice, as well as partially hidden processes, such as the modification of certain entries or deletion of these business objects.

1 Understanding Process Analytics

Process Analytics is a data-driven methodology of the actual process analysis, which originates in forensics. In the wake of the increasing importance of computer crime, it became necessary to identify and analyze the data traces that potential criminals left behind in IT systems in order to reconstruct the event as much as possible.

With the trend towards Big Data Analytics, Process Analytics has not only received new data bases, but has also been further developed as an analytical method. In addition, the visualization enables the analyst or the report recipient to have a deeper understanding of even more complex business processes.

While conventional process analysis primarily involves employee interviews and monitoring of the employees at the desk in order to determine actual processes, Process Analytics is a leading method, which is purely fact-based and thus objectively approaching the processes. It is not the employees who are asked, but the IT systems, which not only store all the business objects recorded in a table-oriented manner, but also all process activities. Every IT system for enterprise purposes log all relevant activities of the whole business process, in the background and invisible to the users, such as orders, invoices or customer orders, with a time stamp.

2 The right choice of the processes to analyze

Today almost every company works with at least one ERP system. As other systems are often used, it is clear which processes can not be analyzed: Those processes, which are still carried out exclusively on paper and in the minds of the employees, which are typical decision-making processes at the strategic level and not logged in IT systems.

Operational processes, however, are generally recorded almost seamlessly in IT systems. Furthermore, almost all operational decisions are recorded by status flags in datasets.

The operational processes, which can be reconstructed and analyzed with Process Mining very well and which are of equal interest from the point of view of compliance, include for example:

– Procurement

– Logistics / Transport

– Sales / Ordering

– Warranty / Claim Management

– Human Resource Management

Process Analytics enables the greatest possible transparency across all business processes, regardless of the sector and the department. Typical case IDs are, for example, sales order number, procurement order number, customer or material numbers.

3 Selection of relevant IT systems

In principle, every IT system used in the company should be examined with regard to the relevance for the process to be analyzed. As a rule, only the ERP system (SAP ERP or others) is relevant for the analysis of the purchasing processes. However, for other process areas there might be other IT systems interesting too, for example separate accounting systems, a CRM or a MES system, which must then also be included.

Occasionally, external data should also be integrated if they provide important process information from externally stored data sources – for example, data from logistics partners.

4 Data Preparation

Before the start of the data-driven process analysis, the data directly or indirectly indicating process activities must be identified, extracted and processed in the data sources. The data are stored in database tables and server logs and are collected via a data warehousing procedure and converted into a process protocol or – also called – event log.

The event log is usually a very large and wide table which, in addition to the actual process activities, also contains parameters which can be used to filter cases and activities. The benefit of this filter option is, for example, to show only process flows where special product groups, prices, quantities, volumes, departments or employee groups are involved.

5 Analysis Execution

The actual inspection is done visually and thus intuitively with an interactive process flow diagram, which represents the actual processes as they could be extracted from the IT systems. The event log generated by the data preparation is loaded into a data visualization software (e.g. Celonis PM Software), which displays this log by using the case IDs and time stamps and transforms this information in a graphical process network. The process flows are therefore not modeled by human “process thinkers”, as is the case with the target processes, but show the real process flows given by the IT systems. Process Mining means, that our enterprise databases “talk” about their view of the process.

The process flows are visualized and statistically evaluated so that concrete statements can be made about the process performance and risk estimations relevant to compliance.

6 Deviation from target processes

The possibility of intuitive filtering of the process presentation also enables an analysis of all deviation of our real process from the desired target process sequences.

The deviation of the actual processes from the target processes is usually underestimated even by IT-affine managers – with Process Analytics all deviations and the general process complexity can now be investigated.

6 Detection of process control violations

The implementation of process controls is an integral part of a professional internal control system (ICS), but the actual observance of these controls is often not proven. Process Analytics allows circumventing the dual control principle or the detection of functional separation conflicts. In addition, the deliberate removal of internal control mechanisms by executives or the incorrect configuration of the IT systems are clearly visible.

7 Detection of previously unknown behavioral patterns

After checking compliance with existing controls, Process Analytics continues to be used to recognize previously unknown patterns in process networks, which point to risks or even concrete fraud cases and are not detected by any control due to their previously unknown nature. In particular, the complexity of everyday process interlacing, which is often underestimated as already mentioned, only reveals fraud scenarios that would previously not have been conceivable.

8 Reporting – also possible in real time

As a highly effective audit analysis, Process Analytics is already an iterative test at intervals of three to twelve months. After the initial implementation, compliance violations, weak or even ineffective controls, and even cases of fraud, are detected reliably. The findings can be used in the aftermath to stop the weaknesses. A further implementation of the analysis after a waiting period makes it possible to assess the effectiveness of the measures taken.

In some application scenarios, the seamless integration of the process analysis with the visual dashboard to the IT system landscape is recommended so that processes can be monitored in near real-time. This connection can also be supplemented by notification systems, so that decision makers and auditors are automatically informed about the latest process bottlenecks or violations via SMS or e-mail.

Fazit

Process Analytics is, in the course of the digitalization, the highly effective methodology from the area of ​​Big Data Analysis for detecting compliance-relevant events throughout the company and also providing visual support for forensic data analysis. Since this is a method, and not a software, an expansion of the IT system landscape, especially for entry, is not absolutely necessary, but can be carried out by internal or external employees at regular intervals.

The Future of CRM Systems

Growth comes hand in hand with technology advancement. Today CRM software help in handling all customer data including buying habits for as long as they are attached to the company. With all the data collected, what next? How can CRM systems make things better? Most companies find themselves with a lot of data on their hands but fewer tools to capitalize on it.

To have a glimpse at the future of CRM systems, we ought to recognize the problems businesses have now. The critical issue for most companies is to offer personalized communication and products. What should we expect from these systems in the future? Why the need for improved CRM systems?

Retaining customers is easier than pitching new ones. Your clients also become an essential marketing tool. Most of the referrals you get will be from proud customers. With this said, there is the need of a system that enables a business to offer targeted information and products to the customers.

Systems that can Collect all Customer Data even from Other Markets

At the moment, your client information is only based on what you have collected internally. But wouldn’t you want to have a sneak preview of what your customer’s buying habits are outside your business? This will help you come up with relevant data that will meet customer needs. When there is a centralized unit that collects customer data from several sources and shares appropriately, business owners benefit more from the information they garner.

The Birth of Intelligent Units for Business Owners

In the future, we see business owners accessing software or multiple units that can bring order in data collection, analyzing and grouping. With all the data collected, companies are overwhelmed when it comes to utilization. Intelligent systems can analyze and even recommend proper usage of each set of data. This means customized products, recommendations, and appropriate sales formulas.

With all the data collected, businesses are overwhelmed when coming up with sales campaigns. Most of the effort is not recognized because it is not unique to customer needs. Many clients don’t even open emails from shopping outlets because they deem it as a waste of time. It is time to change this notion.

The Need to Use Different Marketing Channels

What if based on the customer data you have collected, you can reach clients through various means? Technology allows a person to use different devices all at the same time. Mobile marketing has not been delved into exhaustively, yet mobile devices are more popular nowadays because of the convenience they bring along. Some people no longer use PCs. When systems target mobile devices, chances of getting a better response are higher.

Social Media Integration

How can you profit from your clients’ social trends? Marketing can be easier when CRMs take into account social media habits. These should be customer specific with approaches that are both friendly, engaging and to the point.

Personalized Services

CRMs in the future will be able to detect customer preferences, styles, and tastes. What is your favorite color? How do you like your products packaged? Have you changed your address? Future systems will be able to detect this quickly and even update business data. No more wrong shipments or guessing what your customers would prefer? The systems will even be able to identify future buying trends that companies can use to their advantage. Customer understanding is vital when offering personalized services.

Customer Involvement

Through improved CRM systems customers can find it easier to make recommendations, offer suggestions and even get involved in the developments in the company. The more interactive a business is, the longer the clients will stay around meaning more sales. Systems can periodically interact with customers on given topics such as new product suggestions, the feedback of which can be useful for growth.

Customer interaction is also essential in promoting product knowledge. All the emails, inquiries and questions coming in can be overwhelming, but when a business has artificial intelligent units handling the incoming traffic, things get easier and tailor made to satisfy customer requests.

Sales Automation

In the future, the need to go through every order and dispatch will be a thing of the past. Systems will automatically detect orders, specifications and make appropriate shipments. This will make things easier and even reduce time spent on each order. CRMs will be able to work on multiple orders efficiently without human supervision. This will enhance a 24-hour working economy. The intelligent units will work day and night meaning that most business operations will go on past the regular working hours without having to employ more staff.

Efficient CRM use will reduce operating costs for most businesses. The need to have many employees or bigger operational space will go down. Customer expectations will be met which will mean better relations. This will result in a vibrant economy.

Ways AI & ML Are Changing How We Live

From Amazon’s Alexa, a personal assistant that can do anything from making your to-do list to giving a wide range of real-time information about the world around you, to Google’s DeepMind that has very recently made headlines for possibly being able to predict the future, AI and ML are the biggest development in human history.

Machine Learning Used by Hospitals

We hear a lot about Artificial Intelligence (AI) in the realm of insurance Big Data, but there isn’t much buzz around how AI and ML are revolutionising hospitals. The national health expenditures were around $3.4 trillion and estimated to increase from 17.8 percent of GDP to 19.9 percent between 2015 and 2025. By 2021, industry analysts have predicted that the AI health market will reach $6.6 billion. By 2026, such increases in AI technology in the healthcare sector will save the economy around $150 billion annually.

Some of the most popular Artificial Intelligence applications used in hospitals now are:

  • Predictive Health Trackers – Technology that has the ability to monitor patients’ health status using real-time data collection. One such technology is the Health and Environmental Tracker (HET) which can predict if someone is about to have an asthma attack.
  • Chatbots – It isn’t only retail customer service that uses chatbots to deal with consumers. Now hospitals have automated physicians that inquire and route clinicians to the right specialists.
  • Predictive AnalyticsCleveland Clinics have partnered with Microsoft (Cortana) while John Hopkins has partnered up with GE in order to create Machine Learning technology that has the ability to monitor patients and prevent patient emergencies before they happen. It does this by analysing data for primary indicators of potential risks.

Cognitive Marketing – Content Marketing on Steroids

Customer experience and content marketing are terms often tossed around in the world of business and advertising these days. Why do we bring them up now, you ask? Well, things are about to be kicked into sixth gear, thanks to Cognitive Marketing. To explain what that is, let’s go back a bit: remember when Google’s DeepMind AlphaGo bested the top human player at the game? This wasn’t some computer beating a bored office clerk at the game of Solitaire. In order to achieve that victory, Google’s AI had to “actually show its cognitive capability to ‘think’ like humans, because to win the game, ‘intuition’ was needed rather than just ‘logical reasoning’.” Similar algorithm-powered AI’s are enabling machines to learn and grow on their own. Soon, they’ll reach the potential to create content for marketeers at a massive scale. Not only that, but they’ll always deliver the right content, to the right kind of audience, at just the right time.

More Ways Than One: How Retail Is Harnessing AI & ML

  1. Developing Store That Don’t Need Checkout Lines

Tech companies and online retail giants such as Amazon want to create cashier-free stores, at least they are trying to. Last year Amazon launched its Amazon Go which uses sensors and hundreds of cameras to track what customers pick up and then charge the amount to an application on their smart phone, put simply. But only months into the experiment Amazon has said they need to work out some kinks in the system. As of now, Amazon Go’s system can only handle 20 or so customers at a time.

Among other issues, The Guardian, citing an unnamed source, wrote in an article, stated “…if an item has been moved from its specific spot on the shelf.”  Located in Seattle, Washington, Amazon Go is now running in “beta mode” only for Amazon employees as it tests its systems. And these tests are showing that Amazon’s attempt at a cashier-free brick-and-mortar convenience store is far from ready for the real world. A Journal report stated, “For now, the technology functions flawlessly only if there are a small number of customers present, or when their movements are slow.”

  1. Could Drones Be Delivering Goods to Your Home One Day?

Imagine ordering something online from, let’s say, Amazon, and it arrives at your door in 30 minutes or so via drone. Does that sound like something out of the movie The Fifth Element? Maybe, but this technology is already is already here.

Amazon Prime Air made its first delivery to a customer via a GPS-guided flying drone on December 7th, 2016. It only took 13 minutes for the drone to deliver the merchandise to the customer. This sort of technology will be a huge game changer for retail. The supply chain industry is headed for a revolution – drone delivery is coming, and retailers who want to keep up really should adopt such technologies.

Even in 2016, consumers were totally ready to accept drone delivery. The Walk Sands Future of Retail 2016 Study showed that 79 percent of US consumers said they would be “very likely” or “somewhat likely” to choose drone delivery if their product could be delivered within an hour. For me, I’d choose it just to see how cool it was. I think it would be pretty rad to have a drone land in my yard with my package, don’t you? Furthermore, other consumers stated they would pay up to $10 for a drone delivery. Lastly, 26 percent of consumers are already expecting to have their packages delivered to them in the next two years or so.

Driverless Delivery Vehicles Already Here as Well

There was a movie I watched some months ago – you most likely heard of it or even watched it. It was the latest movie about Wolverine titled Logan. There was a certain scene that never left my memory (basically because I found it awesome) where Logan and his companions were driving along a freeway full of driverless tractor trailers that had no tractor.

In an article written for pastemagazine.com, Carlos Alvarez of Getty wrote: “… Logan’s writer and director James Mangold’s inclusion of the self-driving trucking machines make it clear that the filmmaker understands the writing on the wall about the future of shipping. It’s a future without truck drivers.” He continues to explain that the movie takes place a little over 10 years from now in 2029.

“The change may well be here long before 2029. It’s only 2017, and already we’re seeing the beginnings of automated trucking taking over the industry. At the 2017 Consumer Electronics Show this January, Peloton Technology demonstrated “platooning,” where trucks are kept in a row on the highway to reduce wind resistance and save fuel. The trucks are controlled by computers on a “Level One” of autonomous driving,” Alvarez continued in his article.

Now in Germany, Mercedes-Benz is has been developing and testing their Actros truck which is fitted with a ‘highway pilot’ system, which acts like an auto-pilot and includes a radar and stereo camera system. So far, German carmaker Daimler has restricted testing on a German autobahn. The autobahn is generally safer than testing in city conditions since the curves are not as steep. Since the tests have started, this autonomous truck has already driven over 20,000 kilometres.

Did I Say Flying Taxis? Huh, Yeah I Did!

But, if you are still not amazed, then I am about to blow your socks off. Dubai has promised to build a fully autonomous public transportation system by 2030, including autonomous flying drone taxis! Now that is really something. And it isn’t a matter of when they’ll be produced and in use because they already are.

Manufactured in China by the drone-making firm EHang, these really freaking cool quad drones on steroids can carry one person weighing up to 100 kilogrammes (I weigh over that, guess I’m walking) plus maybe a backpack or suitcase. They can fly about 30 kilometres (or 19 miles), at a speed of 60 miles per hour, give or take. And, if that isn’t the cool part, you won’t need any lessons on how to fly it. Simply push a button and it flies you from point A to point B. Whether or not you have to give it directions, don’t know. Either way, this is mostly likely the coolest piece of tech out there right now.

Copyright @ CBS Interactive Inc.