How can AI and Machine learning impact healthcare industry?

Healthcare industry is a recession-proof one. Even in times of economic meltdown and financial distress, the healthcare industry can hold its own because mankind will always need healthcare. In fact, during the Great Depression in the US, when the economy was facing a severe slowdown, the healthcare industry expanded, adding 852,000 jobs.

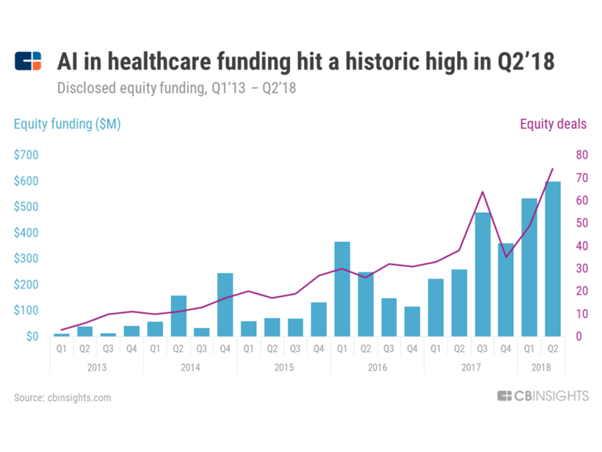
Healthcare AI in the US is slated to reach $6.6 billion in value by 2021.

From clinical trials to new drug research & development, and from innovative medical devices to technology like nanoparticles, AI, and ML has touched every point and has the power to transform them completely.

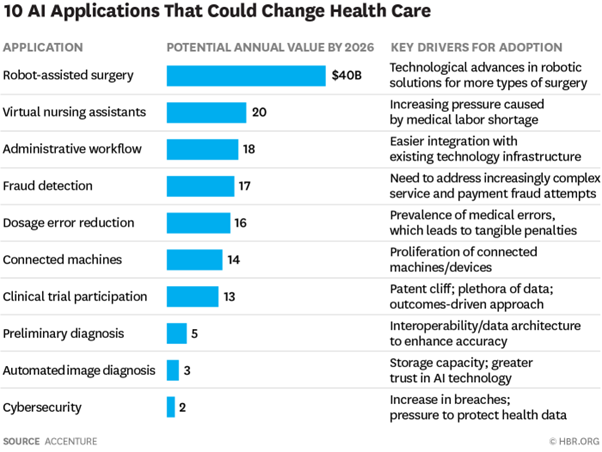
In fact, according to a study by Accenture, AI applications in healthcare can result in global savings to the tune of $150 billion by 2026.

The possibilities are endless, and the results unthinkable if AI can be properly used.

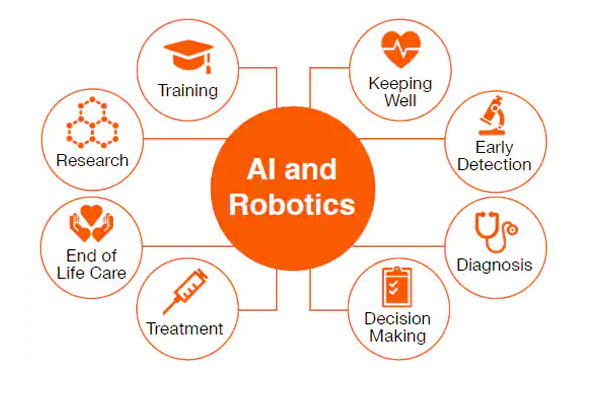
Here are some of the ways AI and ML can impact the healthcare industry:

1. Solving the Iron Triangle

A problem that has plagued the world for many years the triangle aims to solve a fundamental healthcare problem: that of good quality, accessible treatment at low cost.

Providing all three at the same time is a major challenge in healthcare, as the cost of healthcare is usually high. Here, trying to improve one factor harms another.

But AI can solve this problem in the near future without breaking the triangle, by improving the current healthcare cost-structure. The key to it is AI, and smart machines, that the patient can use for self-treatment for the majority of times, cutting down treatment costs drastically, by reducing human contact and improving quality of life.

2. Diagnostics and Imaging

The US FDA has drastically increased investment on AI in radiology and diagnostics. And it’s not without reason.

The IDx-DR became the first AI system cleared by the US FDA to provide diagnostic decisions. It was a breakthrough discovery to detect early mild diabetic retinopathy. The device was accurate 87.5% of the times, and also detected patients who didn’t have the condition, correctly up to 89.5% of times.

The US FDA also permitted marketing of the Viz.AI a type of clinical decision support system designed to analyze CT scan results to identify possibilities of a stroke in the patients and send the results to a specialist to identify any block.

In fact, diagnostics is fast becoming one of the significant drivers of AI investment in healthcare.

These advances can impact the healthcare industry in a novel way. As more and more devices become AI-enabled, the landscape of healthcare delivery will change.

3. Early screening 

Early screening in case of most diseases can drastically improve the mortality rates of patients and cut down treatment costs by over 50%.

Let’s take the example of colorectal cancer.

The 5-year survival for Stage 1 CRC is around 90%, as compared to only 10% for Stage 4.

Early detection of CRC can be ideally treated with a minimally invasive endoscopy at a low cost of less than $5,000 per year. However, in the case of late-stage CRC, it requires multidisciplinary treatment with multiple surgeries, chemotherapy, and radiation, skyrocketing the costs.

And that is why early detection is essential, and that’s exactly what AI can do. There are already apps on the market that are doing this. For example, Autism & Beyond is a revolutionary app that leveraged the power of Apple’s ResearchKit to gather videos of children and detect their preference for the development of autism, using AI software.

AI used for early screening can save billions of taxpayer dollars of taxpayer money every year, and reduce out of pocket expenditure in the US drastically.

4. Drug research & development

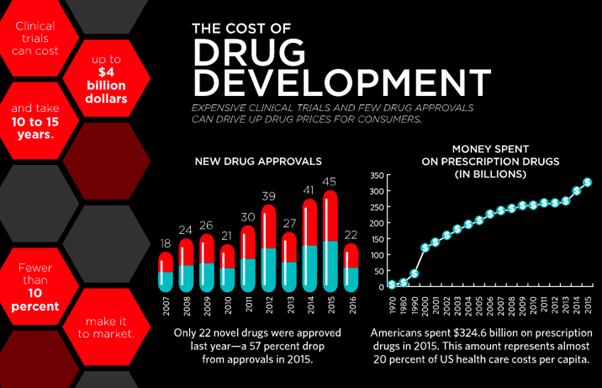
According to the California Biomedical Research Association, it takes around 12 years for a drug to be conceived in the laboratory and go to the patient.

Only 1 out of 5000 drugs that are selected for pre-clinical testing are then used for human testing, and only 20% of them make it to the market for human use.

(image)

The cost to develop a new drug now is more than $2.5 billion.

It is only recently that AI is being used in drug research and discovery. The power of AI can be leveraged to streamline the drug discovery and drug repurposing processes. It can identify patients best suited to the trial, can identify patients in the most need for new medications and can predict any side-effects and idiosyncrasies beforehand.

All of these, for a start, can lead to much safer clinical trials with no unwanted drug reactions.

And then, there is the question of lowering costs. In fact, a study by Carnegie Mellon and a German university estimated that AI could lower drug discovery costs by as much as 70%.

This, in turn, will be transferred to patients in the form of lower drug prices, which will increase accessibility to better medications for patients and improve population health in general.

5. Surgery 

AI-enabled robotic-assisted surgeries are taking over the US. They are increasingly being used to reduce surgeon variations and improve quality.

‘Artificial intelligence can help surgeons perform better’ quotes Dr. John Birkmeyer, a chief clinical officer at Sound Physicians.

Advanced analytics and machine learning techniques are being used concomitantly used to unleash critical insights from the billions of data elements associated with robotic-assisted surgery. If used properly, this can help overcome attendant inefficiencies and improve patient health outcomes.

Artificial intelligence helps surgeons make better clinical decisions in real-time during surgery, and helps them understand the dynamics of the patient, especially during complex operations. It also reduces the length of stay of patients by 21%.

This is ultimately reflected in the patient’s post-operative care and long-term health. It also prevents patient readmissions, saving millions of dollars annually.

A study involving 379 orthopedic patients found out that AI-assisted robotic surgery resulted in five times fewer complications as compared to surgeons working alone.

According to Accenture, AI-assisted robotic surgery could save the US healthcare industry $40 billion annually, by 2026.

6. AI-assisted virtual nurses

AI-assisted virtual nurses could well end up saving the US healthcare industry $20 billion annually, by 2026.

They are available 24/7 to answer any patient queries, monitor patients, and guide them in any way they might want.

Currently, they act as a bridge for information exchange between care providers (doctors) and care receivers (patients), to decide what medications to start, the current health status, the most recent test results, and many other things.

It can save the patient many physical appointments with doctors, and also prevent high hospital readmission rates through simple, engaging, and intelligent care.

Care Angel is one of the finest virtual nurses around. Apart from all of the above, it can also provide wellness checks through voice and AI.

Wrap-Up 

AI and ML in healthcare are still at its infancy. Adoption at a large-scale is missing as of yet. To be successful in the healthcare domain, AI and ML need the endorsement of healthcare providers like physicians and nurses.

However, considerable investment is being made in AI in healthcare, and its increasing at a good rate.

AI in healthcare is currently aimed at improving patient outcomes, taking care of the interests of various stakeholders involved, increasing accessibility, and reducing healthcare costs.

In the near future, however, AI and ML, along with technologies like Data Science will take up a much more holistic role to drive healthcare forward.

Interview – Customer Data Platform, more than CRM 2.0?

Interview with David M. Raab from the CDP Institute

David M. Raab is as a consultant specialized in marketing software and service vendor selection, marketing analytics and marketing technology assessment. Furthermore he is the founder of the Customer Data Platform Institute which is a vendor-neutral educational project to help marketers build a unified customer view that is available to all of their company systems.

Furthermore he is a Keynote-Speaker for the Predictive Analytics World Event 2019 in Berlin.

Data Science Blog: Mr. Raab, what exactly is a Customer Data Platform (CDP)? And where is the need for it?

The CDP Institute defines a Customer Data Platform as „packaged software that builds a unified, persistent customer database that is accessible by other systems“.  In plainer language, a CDP assembles customer data from all sources, combines it into customer profiles, and makes the profiles available for any use.  It’s important because customer data is collected in so many different systems today and must be unified to give customers the experience they expect.

Data Science Blog: Is it something like a CRM System 2.0? What Use Cases can be realized by a Customer Data Platform?

CRM systems are used to interact directly with customers, usually by telephone or in the field.  They work almost exclusively with data that is entered during those interactions.  This gives a very limited view of the customer since interactions through other channels such as order processing or Web sites are not included.  In fact, one common use case for CDP is to give CRM users a view of all customer interactions, typically by opening a window into the CDP database without needing to import the data into the CRM.  There are many other use cases for unified data, including customer segmentation, journey analysis, and personalization.  Anything that requires sharing data across different systems is a CDP use case.

Data Science Blog: When does a CDP make sense for a company? It is more relevant for retail and financial companies than for industrial companies, isn´t it?

CDP has been adopted most widely in retail and online media, where each customer has many interactions and there are many products to choose from.  This is a combination that can make good use of predictive modeling, which benefits greatly from having more complete data.  Financial services was slower to adopt, probably because they have fewer products but also because they already had pretty good customer data systems.  B2B has also been slow to adopt because so much of their customer relationship is handled by sales people.  We’ve more recently been seeing growth in additional sectors such as travel, healthcare, and education.  Those involve fewer transactions than retail but also rely on building strong customer relationships based on good data.

Data Science Blog: There are several providers for CDPs. Adobe, Tealium, Emarsys or Dynamic Yield, just to name some of them. Do they differ a lot between each other?

Yes they do.  All CDPs build the customer profiles I mentioned.  But some do more things, such as predictive modeling, message selection, and, increasingly, message delivery.  Of course they also vary in the industries they specialize in, regions they support, size of clients they work with, and many technical details.  This makes it hard to buy a CDP but also means buyers are more likely to find a system that fits their needs.

Data Science Blog: How established is the concept of the CDP in Europe in general? And how in comparison with the United States?

CDP is becoming more familiar in Europe but is not as well understood as in the U.S.  The European market spent a lot of money on Data Management Platforms (DMPs) which promised to do much of what a CDP does but were not able to because they do not store the level of detail that a CDP does.  Many DMPs also don’t work with personally identifiable data because the DMPs primarily support Web advertising, where many customers are anonymous.  The failures of DMPs have harmed CDPs because they have made buyers skeptical that any system can meet their needs, having already failed once.  But we are overcoming this as the market becomes better educated and more success stories are available.  What’s the same in Europe and the U.S. is that marketers face the same needs.  This will push European marketers towards CDPs as the best solution in many cases.

Data Science Blog: What are coming trends? What will be the main topic 2020?

We see many CDPs with broader functions for marketing execution: campaign management, personalization, and message delivery in particular.  This is because marketers would like to buy as few systems as possible, so they want broader scope in each systems.  We’re seeing expansion into new industries such as financial services, travel, telecommunications, healthcare, and education.  Perhaps most interesting will be the entry of Adobe, Salesforce, and Oracle, who have all promised CDP products late this year or early next year.  That will encourage many more people to consider buying CDPs.  We expect that market will expand quite rapidly, so current CDP vendors will be able to grow even as Adobe, Salesforce, and Oracle make new CDP sales.


You want to get in touch with Daniel M. Raab and understand more about the concept of a CDP? Meet him at the Predictive Analytics World 18th and 19th November 2019 in Berlin, Germany. As a Keynote-Speaker, he will introduce the concept of a Customer Data Platform in the light of Predictive Analytics. Click here to see the agenda of the event.


The Power of Analyzing Processes

Are you thinking BIG enough? Over the past few years, the quality of discussion regarding a ‘process’ and its interfaces between different departments has developed radically. Organizations increasingly reject guesswork, individual assessments, or blame-shifting and instead focus on objective facts: the display of throughput times, process variants, and their optimization.

But while data can hold valuable insights into business, users, customer bases, and markets, companies are sometimes unsure how best to analyze and harness their data. In fact, the problem isn’t usually a lack of data; it’s a breakdown in leveraging useful data. Being unsure how to interpret, explore, and analyze processes can paralyze any go-live, leading to a failure in the efficient interaction of processes and business operations. Without robust data analysis, your business could be losing money, talent, and even clients.

After all, analyzing processes is about letting data tell its true story for improved understanding.

The “as-is” processes

Analyzing the as-is current state helps organizations document, track, and optimize processes for better performance, greater efficiency, and improved outcomes. By contextualizing data, we gain the ability to navigate and organize processes to negate bottlenecks, set business preferences, and plan an optimized route through process mining initiatives. This focus can help across an entire organization, or on one or more specific processes or trends within a department or team.

There are several vital goals/motivations for implementing current state analysis, including:

  • Saving money and improving ROI;
  • Improving existing processes or creating new processes;
  • Increasing customer satisfaction and journeys;
  • Improving business coordination and organizational responsiveness;
  • Complying with new regulatory standards;
  • Adapting methods following a merger or acquisition.

The “to-be” processes

Simply put, if as-is maps where your processes are, to-be maps where you want them to… be. To-be process mapping documents what you want the process to look like, and by using the as-is diagram, you can work with stakeholders to identify developments and improvements of the current process, then outline those changes on your to-be roadmap.

This analysis can help you make optimal decisions for your business and innovative OpEx imperatives. For instance, at leading data companies like Google and Amazon, data is used in such a way that the analysis results make the decisions! Just think of the power Recommendation Engines, PageRank, and Demand Forecasting Systems have over the content we see. To achieve this, advanced techniques of machine learning and statistical modeling are applied, resulting in mechanically improved results from the data. Interestingly, because these techniques reference large-scale data sets and reflect analysis and results in real-time, they are applied to areas that extend beyond human decision-making.

Also, by analyzing and continuously monitoring qualitative and quantitative data, we gain insights across potential risks and ongoing improvement opportunities, too. The powerful combination of process discovery, process analysis, and conformance checking supports a collaborative approach to process improvement, giving you game-changing insights into your business. For example:

  • Which incidents would I like to detect and act upon proactively?
  • Where would task prioritization help improve overall performance?
  • Where do I know that increased transparency would help the company?
  • How can I utilize processes in place of gut feeling/experience?

Further, as the economic environment continues to change rapidly, and modern organizations keep adopting process-based approaches to ensure they are achieving their business goals, process analysis naturally becomes the perfect template for any company.

With this, process mining technology can help modern businesses manage process challenges beyond the boundaries of implementation. We can evaluate the proof of concept (PoC) for any proposed improvements, and extract relevant information from a homogenous data set. Of course, process modeling and business process management (BPM) are available to solve the potentially tricky integration phase.

Process mining and analysis initiatives

Process mining and discovery initiatives can also provide critical insights throughout the automation and any Robotic Process Automation (RPA) journey, from defining the strategy to continuous improvement and innovation. Data-based process mining can even extend process analysis across teams and individuals, decreasing incident resolution times, and subsequently improving working habits via the discovery and validation of automation opportunities.

A further example of where process mining and strategic process analysis/alignment is already paying dividends is IT incident management. Here, “incident” is an unplanned interruption to an IT service, which may be complete unavailability or merely a reduction in quality. The goal of the incident management process is to restore regular service operation as quickly as possible and to minimize the impact on business operations. Incident management is a critical process in Information Technology Library (ITIL).

Process mining can also further drive improvement in as-is incident management processes as well as exceptional and unwanted process steps, by increasing visibility and transparency across IT processes. Process mining will swiftly analyze the different working habits across teams and individuals, decreasing incident resolution times, and subsequently improving customer impact cases.

Positive and practical experiences with process mining across industries have also led to the further dynamic development of tools, use cases, and the end-user community. Even with very experienced process owners, the visualization of processes can skyrocket improvement via new ideas and discussion.

However, the potential performance gains are more extensive, with the benefits of using process mining for incident management, also including:

  • Finding out how escalation rules are working and how the escalation is done;
  • Calculating incident management KPIs, including SLA (%);
  • Discovering root causes for process problems;
  • Understanding the effect of the opening interface (email, web form, phone, etc.);
  • Calculating the cost of the incident process;
  • Aligning the incident management system with your incident management process.

Robotic Process Automation (RPA)

Robotic process automation (RPA) provides a virtual workforce to automatize manual, repetitive, and error-prone tasks. However, successful process automation requires specific knowledge about the intended (and potential) benefits, effective training of the robots, and continuous monitoring of their performance and processes.

With this, process mining supports organizations throughout the lifecycle of RPA initiatives by monitoring and benchmarking robots to ensure sustainable benefits. These insights are especially valuable for process miners and managers with a particular interest in process automation. By unlocking the experiences with process mining, a company better understands what is needed today, for tomorrow’s process initiatives.

To further upgrade the impact of robot-led automation, there is also a need for a solid understanding of legacy systems, and an overview of automation opportunities. Process mining tools provide key insights throughout the entire RPA journey, from defining the strategy to continuous improvement and innovation.

Benefits of process mining and analysis within the RPA lifecycle include:

  1. Overviews of processes within the company, based on specific criteria;
  2. Identification of processes suitable for RPA implementation during the preparation phase;
  3. Mining the optimal process flow/process path;
  4. Understanding the extent to which RPA can be implemented in legacy processes and systems;
  5. Monitoring and analysis of RPA performance during the transition/handover of customization;
  6. Monitoring and continuous improvement of RPA in the post-implementation phase.

The process of better business understanding

Every organization is different and brings with it a variety of process-related questions. Yet some patterns are usually repeated. For example, customers who introduce data supported process analysis as part of business transformation initiatives will typically face challenges in harmonizing processes from fragmented sectors and regional locations. Here it helps enormously to base actions on data and statistics from the respective processes, instead of relying on the instincts and estimations of individuals.

With this, process analysis which is supported by data, enables a fact-based discussion, and builds a bridge between employees, process experts and management. This helps avoid siloed thinking, as well as allowing the transparent design of handovers and process steps which cross departmental boundaries within an organization.

In other words, to unlock future success and transformation, we must be processing… today.

Find out more about process mining with Signavio Process Intelligence, and see how it can help your organization uncover the hidden value of process, generate fresh ideas, and save time and money.

Accelerate your AI Skills Today: A Million Dollar Job!

The skyrocketing salaries ($1m per year) of AI engineers is not a hype. It is the fact of current corporate world, where you will witness a shift that is inevitable.

We’ve already set our feet at the edge of the technological revolution. A revolution that is at the verge of altering the way we live and work. As the fact suggests, humanity has fundamentally developed human production in three revolutions, and we’re now entering the fourth revolution. In its scope, the fourth revolution projects a transformation that is unlike anything we humans have ever experienced.

  • The first revolution had the world transformed from rural to urban
  • the emergence of mass production in the second revolution
  • third introduced the digital revolution
  • The fourth industrial revolution is anxious to integrate technologies into our lives.

And all thanks to artificial intelligence (AI). An advanced technology that surrounds us, from virtual assistants to software that translates to self-driving cars.

The rise of AI at an exponential rate has disrupted almost every industry. So much so that AI is being rated as one-million-dollar profession.

Did this grab your attention? It did?

Now, what if we were to tell you that the salary compensation for AI experts has grown dramatically. AI and machine learning are fields that have a mountain of demand in the tech industry today but has sparse supply.

AI field is growing at a quicker pace and salaries are skyrocketing! Read it for yourself to know what AI experts, AI researchers and any other AI talent are commanding today.

  • A top-class AI research laboratory, OpenAI says that techies in the AI field are projected to earn a salary compensation ranging between $300 to $500k for fresh graduates. However, expert professionals could earn anywhere up to $1m.
  • Whopping salary package of above 100 million yen that amounts to $1m is being offered to AI geniuses by a Japanese firm, Start Today. A firm that operates a fashion shopping website named Zozotown.

Does this leave you with a question – Is this a right opportunity for you to jump in the field and make hay while the sun is shining? 

And the answer to this question is – yes, it is the right opportunity for any developer seeking a role in the AI industry. It can be your chance to bridge the skill shortage in the AI field either by upskilling or reskilling yourself in the field of AI.

There are a wide varieties of roles available for an AI enthusiast like you. And certain areas are like AI Engineers and AI Researchers are high in demand, as there are not many professionals who have robust AI knowledge.

According to a job report, “The Future of Jobs 2018,” a prediction was made suggesting that machines and algorithms will create around 133 million new job roles by 2022.

AI and machine learning will dominate the tech world. The World Economic Forum says that several sectors have started embracing AI and machine learning to tackle challenges in certain fields such as advertising, supply chain, manufacturing, smart cities, drones, and cybersecurity.

Unraveling the AI realm

From chatbots to financial planners, AI is impacting the way businesses function on a day-today basis. AI makes the work simpler, as it provides variables, which makes the work more streamlined.

Alright! You know that

  • the demand for AI professionals is rising exponentially and that there is just a trickle of supply
  • the AI professionals are demanding skyrocketing salaries

However, beyond that how much more do you know about AI?

Considering the fact that our lives have already been touched by AI (think Alexa, and Siri), it is just a matter of time when AI will become an indispensable part of our lives.

As Gartner predicts that 2020 will be an important year for business growth in AI. Thus, it is possible to witness significant sparks for employment growth. Though AI predicts to diminish 1.8 million jobs, it is also said to replace it with 2.3 million jobs that will be created. As we look forward to stepping into 2020, AI-related job roles are set to make positive progress of achieving 2 million net-new employments by 2025.

With AI promising to score fat paychecks that would reach millions, AI experts are struggling to find new ways to pick up nouveau skills. However, one of the biggest impacts that affect the job market today is the scarcity of talent in this field.

The best way to stay relevant and employable in AI is probably by “reskilling,” and “upskilling.” And  AI certifications is considered ideal for those in the current workforce.

Looking to upskill yourself – here’s how you can become an AI engineer today.

Top three ways to enhance your artificial intelligence career:

  1. Acquire skills in Statistics and Machine Learning: If you’re getting into the field of machine learning, it is crucial that you have in-depth knowledge of statistics. Statistics is considered a prerequisite to the ML field. Both the fields are tightly related. Machine learning models are created to make accurate predictions while statistical models do the job of interpreting the relationship between variables. Many ML techniques heavily rely on the theory obtained through statistics. Thus, having extensive knowledge in statistics help initiate the first step towards an AI career.
  2. Online certification programs in AI skills: Opting for AI certifications will boost your credibility amongst potential employers. Certifications will also enhance your earning potential and increase your marketability. If you’re looking for a change and to be a part of something impactful; join the AI bandwagon. The IT industry is growing at breakneck speed; it is now that businesses are realizing how important it is to hire professionals with certain skillsets. Specifically, those who are certified in AI are becoming sought after in the job market.
  3. Hands-on experience: There’s a vast difference in theory and practical knowledge. One needs to familiarize themselves with the latest tools and technologies used by the industry. This is possible only if the individual is willing to work on projects and build things from scratch.

Despite all the promises, AI does prove to be a threat to job holders, if they don’t upskill or reskill themselves. The upcoming AI revolution will definitely disrupt the way we work, however, it will leave room for humans to perform more creative jobs in the future corporate world.

So a word of advice is to be prepared and stay future ready.

Visual Question Answering with Keras – Part 1

This is Part I of II of the Article Series Visual Question Answering with Keras

Making Computers Intelligent to answer from images

If we look closer in the history of Artificial Intelligence (AI), the Deep Learning has gained more popularity in the recent years and has achieved the human-level performance in the tasks such as Speech Recognition, Image Classification, Object Detection, Machine Translation and so on. However, as humans, not only we but also a five-year child can normally perform these tasks without much inconvenience. But the development of such systems with these capabilities has always considered an ambitious goal for the researchers as well as for developers.

In this series of blog posts, I will cover an introduction to something called VQA (Visual Question Answering), its available datasets, the Neural Network approach for VQA and its implementation in Keras and the applications of this challenging problem in real life. 

Table of Contents:

1 Introduction

2 What is exactly Visual Question Answering?

3 Prerequisites

4 Datasets available for VQA

4.1 DAQUAR Dataset

4.2 CLEVR Dataset

4.3 FigureQA Dataset

4.4 VQA Dataset

5 Real-life applications of VQA

6 Conclusion


  1. Introduction:

Let’s say you are given a below picture along with one question. Can you answer it?

I expect confidently you all say it is the Kitchen without much inconvenience which is also the right answer. Even a five-year child who just started to learn things might answer this question correctly.

Alright, but can you write a computer program for such type of task that takes image and question about the image as an input and gives us answer as output?

Before the development of the Deep Neural Network, this problem was considered as one of the difficult, inconceivable and challenging problem for the AI researcher’s community. However, due to the recent advancement of Deep Learning the systems are capable of answering these questions with the promising result if we have a required dataset.

Now I hope you have got at least some intuition of a problem that we are going to discuss in this series of blog posts. Let’s try to formalize the problem in the below section.

  1. What is exactly Visual Question Answering?:

We can define, “Visual Question Answering(VQA) is a system that takes an image and natural language question about the image as an input and generates natural language answer as an output.”

VQA is a research area that requires an understanding of vision(Computer Vision)  as well as text(NLP). The main beauty of VQA is that the reasoning part is performed in the context of the image. So if we have an image with the corresponding question then the system must able to understand the image well in order to generate an appropriate answer. For example, if the question is the number of persons then the system must able to detect faces of the persons. To answer the color of the horse the system need to detect the objects in the image. Many of these common problems such as face detection, object detection, binary object classification(yes or no), etc. have been solved in the field of Computer Vision with good results.

To summarize a good VQA system must be able to address the typical problems of CV as well as NLP.

To get a better feel of VQA you can try online VQA demo by CloudCV. You just go to this link and try uploading the picture you want and ask the related question to the picture, the system will generate the answer to it.


  1. Prerequisites:

In the next post, I will walk you through the code for this problem using Keras. So I assume that you are familiar with:

  1. Fundamental concepts of Machine Learning
  2. Multi-Layered Perceptron
  3. Convolutional Neural Network
  4. Recurrent Neural Network (especially LSTM)
  5. Gradient Descent and Backpropagation
  6. Transfer Learning
  7. Hyperparameter Optimization
  8. Python and Keras syntax
  1. Datasets available for VQA:

As you know problems related to the CV or NLP the availability of the dataset is the key to solve the problem. The complex problems like VQA, the dataset must cover all possibilities of questions answers in real-world scenarios. In this section, I will cover some of the datasets available for VQA.

4.1 DAQUAR Dataset:

The DAQUAR dataset is the first dataset for VQA that contains only indoor scenes. It shows the accuracy of 50.2% on the human baseline. It contains images from the NYU_Depth dataset.

Example of DAQUAR dataset

Example of DAQUAR dataset

The main disadvantage of DAQUAR is the size of the dataset is very small to capture all possible indoor scenes.

4.2 CLEVR Dataset:

The CLEVR Dataset from Stanford contains the questions about the object of a different type, colors, shapes, sizes, and material.

It has

  • A training set of 70,000 images and 699,989 questions
  • A validation set of 15,000 images and 149,991 questions
  • A test set of 15,000 images and 14,988 questions

Image Source: https://cs.stanford.edu/people/jcjohns/clevr/?source=post_page


4.3 FigureQA Dataset:

FigureQA Dataset contains questions about the bar graphs, line plots, and pie charts. It has 1,327,368 questions for 100,000 images in the training set.

4.4 VQA Dataset:

As comapred to all datasets that we have seen so far VQA dataset is relatively larger. The VQA dataset contains open ended as well as multiple choice questions. VQA v2 dataset contains:

  • 82,783 training images from COCO (common objects in context) dataset
  • 40, 504 validation images and 81,434 validation images
  • 443,757 question-answer pairs for training images
  • 214,354 question-answer pairs for validation images.

As you might expect this dataset is very huge and contains 12.6 GB of training images only. I have used this dataset in the next post but a very small subset of it.

This dataset also contains abstract cartoon images. Each image has 3 questions and each question has 10 multiple choice answers.

  1. Real-life applications of VQA:

There are many applications of VQA. One of the famous applications is to help visually impaired people and blind peoples. In 2016, Microsoft has released the “Seeing AI” app for visually impaired people to describe the surrounding environment around them. You can watch this video for the prototype of the Seeing AI app.

Another application could be on social media or e-commerce sites. VQA can be also used for educational purposes.

  1. Conclusion:

I hope this explanation will give you a good idea of Visual Question Answering. In the next blog post, I will walk you through the code in Keras.

If you like my explanations, do provide some feedback, comments, etc. and stay tuned for the next post.

From BI to PI: The Next Step in the Evolution of Data-Driven Decisions

“Change is a constant.” “The pace of change is accelerating.” “The world is increasingly complex, and businesses have to keep up.” Organizations of all shapes and sizes have heard these ideas over and over—perhaps too often! However, the truth remains that adaptation is crucial to a successful business.


Read this article in German: Von der Datenanalyse zur Prozessverbesserung: So gelingt eine erfolgreiche Process-Mining-Initiative


Of course, the only way to ensure that the decisions you make are evolving in the right way is to understand the underlying building blocks of your organization. You can think of it as DNA; the business processes that underpin the way you work and combine to create a single unified whole. Knowing how those processes operate, and where the opportunities for improvement lie, can be the difference between success and failure.

Businesses with an eye on their growth understand this already. In the past, Business Intelligence was seen as the solution to this challenge. In more recent times, forward-thinking organizations see the need for monitoring solutions that can keep up with today’s rate of change, at the same time as they recognize that increasing complexity within business processes means traditional methods are no longer sufficient.

Adapting to a changing environment? The challenges of BI

Business Intelligence itself is not necessarily defunct or obsolete. However, the tools and solutions that enable Business Intelligence face a range of challenges in a fast-paced and constantly changing world. Some of these issues may include:

  • High data latency – Data latency refers to how long it takes for a business user to retrieve data from, for example, a business intelligence dashboard. In many cases, this can take more than 24 hours, a critical time period when businesses are attempting to take advantage of opportunities that may have a limited timeframe.
  • Incomplete data sets – The broad approach of Business Intelligence means investigations may run wide but not deep. This increases the chances that data will be missed, especially in instances where the tools themselves make the parameters for investigations difficult to change.
  • Discovery, not analysis – Business intelligence tools are primarily optimized for exploration, with a focus on actually finding data that may be useful to their users. Often, this is where the tools stop, offering no simple way for users to actually analyze the data, and therefore reducing the possibility of finding actionable insights.
  • Limited scalability – In general, Business Intelligence remains an arena for specialists and experts, leaving a gap in understanding for operational staff. Without a wide appreciation for processes and their analysis within an organization, the opportunities to increase the application of a particular Business Intelligence tool will be limited.
  • Unconnected metrics – Business Intelligence can be significantly restricted in its capacity to support positive change within a business through the use of metrics that are not connected to the business context. This makes it difficult for users to interpret and understand the results of an investigation, and apply these results to a useful purpose within their organization.

Process Intelligence: the next evolutionary step

To ensure companies can work efficiently and make the best decisions, a more effective method of process discovery is needed. Process Intelligence (PI) provides the critical background to answer questions that cannot be answered with Business Intelligence tools.

Process Intelligence offers visualization of end-to-end process sequences using raw data, and the right Process Intelligence tool means analysis of that raw data can be conducted straight away, so that processes are displayed accurately. The end-user is free to view and work with this accurate information as they please, without the need to do a preselection for the analysis.

By comparison, because Business Intelligence requires predefined analysis criteria, only once the criteria are defined can BI be truly useful. Organizations can avoid delayed analysis by using Process Intelligence to identify the root causes of process problems, then selecting the right criteria to determine the analysis framework.

Then, you can analyze your system processes and see the gaps and variants between the intended business process and what you actually have. And of course, the faster you discover what you have, the faster you can apply the changes that will make a difference in your business.

In short, Business Intelligence is suitable for gaining a broad understanding of the way a business usually functions. For some businesses, this will be sufficient. For others, an overview is not enough.

They understand that true insights lie in the detail, and are looking for a way of drilling down into exactly how each process within their organization actually works. Software that combines process discovery, process analysis, and conformance checking is the answer.

The right Process Intelligence tools means you will be able to automatically mine process models from the different IT systems operating within your business, as well as continuously monitor your end-to-end processes for insights into potential risks and ongoing improvement opportunities. All of this is in service of a collaborative approach to process improvement, which will lead to a game-changing understanding of how your business works, and how it can work better.

Early humans evolved from more primitive ancestors, and in the process, learned to use more and more sophisticated tools. For the modern human, working in a complex organization, the right tool is Process Intelligence.

Endless Potential with Signavio Process Intelligence

Signavio Process Intelligence allows you to unearth the truth about your processes and make better decisions based on true evidence found in your organization’s IT systems. Get a complete end-to-end perspective and understanding of exactly what is happening in your organization in a matter of weeks.

As part of Signavio Business Transformation Suite, Signavio Process Intelligence integrates perfectly with Signavio Process Manager and is accessible from the Signavio Collaboration Hub. As an entirely cloud-based process mining solution, the tool makes it easy to collaborate with colleagues from all over the world and harness the wisdom of the crowd.

Find out more about Signavio Process Intelligence, and see how it can help your organization generate more ideas, save time and money, and optimize processes.

The Data Scientist Job and the Future

A dramatic upswing of data science jobs facilitating the rise of data science professionals to encounter the supply-demand gap.

By 2024, a shortage of 250,000 data scientists is predicted in the United States alone. Data scientists have emerged as one of the hottest careers in the data world today. With digitization on the rise, IoT and cognitive technologies have generated a large number of data sets, thus, making it difficult for an organization to unlock the value of these data.

With the constant rise in data science, those fail to upgrade their skill set may be putting themselves at a competitive disadvantage. No doubt data science is still deemed as one of the best job titles today, but the battles for expert professionals in this field is fierce.

The hiring market for a data science professional has gone into overdrive making the competition even tougher. New online institutions have come up with credible certification programs for professionals to get skilled. Not to forget, organizations are in a hunt to hire candidates with data science and big data analytics skills, as these are the top skills that are going around in the market today. In addition to this, it is also said that typically it takes around 45 days for these job roles to be filled, which is five days longer than the average U.S. market.

Data science

One might come across several definitions for data science, however, a simple definition states that it is an accumulation of data, which is arranged and analyzed in a manner that will have an effect on businesses. According to Google, a data scientist is one who has the ability to analyze and interpret complex data, being able to make use of the statistic of a website and assist in business decision making. Also, one needs to be able to choose and build appropriate algorithms and predictive models that will help analyze data in a viable manner to uncover positive insights from it.

A data scientist job is now a buzzworthy career in the IT industry. It has driven a wider workforce to get skilled in this job role, as most organizations are becoming data-driven. It’s pretty obnoxious being a data professional will widen job opportunities and offer more chances of getting lucrative salary packages today. Similarly, let us look at a few points that define the future of data science to be bright.

  • Data science is still an evolving technology

A career without upskilling often remains redundant. To stay relevant in the industry, it is crucial that professionals get themselves upgraded in the latest technologies. Data science evolves to have an abundance of job opportunities in the coming decade. Since, the supply is low, it is a good call for professionals looking to get skilled in this field.

  • Organizations are still facing a challenge using data that is generated

Research by 2018 Data Security Confidence from Gemalto estimated that 65% of the organizations could not analyze or categorized the data they had stored. However, 89% said they could easily analyze the information prior they have a competitive edge. Being a data science professional, one can help organizations make progress with the data that is being gathered to draw positive insights.

  • In-demand skill-set

Most of the data scientists possess to have the in-demand skill set required by the current industry today. To be specific, since 2013 it is said that there has been a 256% increase in the data science jobs. Skills such as Machine Learning, R and Python programming, Predictive analytics, AI, and Data Visualization are the most common skills that employers seek from the candidates of today.

  • A humongous amount of data growing everyday

There are around 5 billion consumers that interact with the internet on a daily basis, this number is set to increase to 6 billion in 2025, thus, representing three-quarters of the world’s population.

In 2018, 33 zettabytes of data were generated and projected to rise to 133 zettabytes by 2025. The production of data will only keep increasing and data scientists will be the ones standing to guard these enterprises effectively.

  • Advancement in career

According to LinkedIn, data scientist was found to be the most promising career of 2019. The top reason for this job role to be ranked the highest is due to the salary compensation people were being awarded, a range of $130,000. The study also predicts that being a data scientist, there are high chances or earning a promotion giving a career advancement score of 9 out of 10.

Precisely, data science is still a fad job and will not cease until the foreseeable future.

A Bird’s Eye View: How Machine Learning Can Help You Charge Your E-Scooters

Bird scooters in Columbus, Ohio

Bird scooters in Columbus, Ohio

Ever since I started using bike-sharing to get around in Seattle, I have become fascinated with geolocation data and the transportation sharing economy. When I saw this project leveraging the mobility data RESTful API from the Los Angeles Department of Transportation, I was eager to dive in and get my hands dirty building a data product utilizing a company’s mobility data API.

Unfortunately, the major bike and scooter providers (Bird, JUMP, Lime) don’t have publicly accessible APIs. However, some folks have seemingly been able to reverse-engineer the Bird API used to populate the maps in their Android and iOS applications.

One interesting feature of this data is the nest_id, which indicates if the Bird scooter is in a “nest” — a centralized drop-off spot for charged Birds to be released back into circulation.

I set out to ask the following questions:

  1. Can real-time predictions be made to determine if a scooter is currently in a nest?
  2. For non-nest scooters, can new nest location recommendations be generated from geospatial clustering?

To answer these questions, I built a full-stack machine learning web application, NestGenerator, which provides an automated recommendation engine for new nest locations. This application can help power Bird’s internal nest location generation that runs within their Android and iOS applications. NestGenerator also provides real-time strategic insight for Bird chargers who are enticed to optimize their scooter collection and drop-off route based on proximity to scooters and nest locations in their area.

Bird

The electric scooter market has seen substantial growth with Bird’s recent billion dollar valuation  and their $300 million Series C round in the summer of 2018. Bird offers electric scooters that top out at 15 mph, cost $1 to unlock and 15 cents per minute of use. Bird scooters are in over 100 cities globally and they announced in late 2018 that they eclipsed 10 million scooter rides since their launch in 2017.

Bird scooters in Tel Aviv, Israel

Bird scooters in Tel Aviv, Israel

With all of these scooters populating cities, there’s much-needed demand for people to charge them. Since they are electric, someone needs to charge them! A charger can earn additional income for charging the scooters at their home and releasing them back into circulation at nest locations. The base price for charging each Bird is $5.00. It goes up from there when the Birds are harder to capture.

Data Collection and Machine Learning Pipeline

The full data pipeline for building “NestGenerator”

Data

From the details here, I was able to write a Python script that returned a list of Bird scooters within a specified area, their geolocation, unique ID, battery level and a nest ID.

I collected scooter data from four cities (Atlanta, Austin, Santa Monica, and Washington D.C.) across varying times of day over the course of four weeks. Collecting data from different cities was critical to the goal of training a machine learning model that would generalize well across cities.

Once equipped with the scooter’s latitude and longitude coordinates, I was able to leverage additional APIs and municipal data sources to get granular geolocation data to create an original scooter attribute and city feature dataset.

Data Sources:

  • Walk Score API: returns a walk score, transit score and bike score for any location.
  • Google Elevation API: returns elevation data for all locations on the surface of the earth.
  • Google Places API: returns information about places. Places are defined within this API as establishments, geographic locations, or prominent points of interest.
  • Google Reverse Geocoding API: reverse geocoding is the process of converting geographic coordinates into a human-readable address.
  • Weather Company Data: returns the current weather conditions for a geolocation.
  • LocationIQ: Nearby Points of Interest (PoI) API returns specified PoIs or places around a given coordinate.
  • OSMnx: Python package that lets you download spatial geometries and model, project, visualize, and analyze street networks from OpenStreetMap’s APIs.

Feature Engineering

After extensive API wrangling, which included a four-week prolonged data collection phase, I was finally able to put together a diverse feature set to train machine learning models. I engineered 38 features to classify if a scooter is currently in a nest.

Full Feature Set

Full Feature Set

The features boiled down into four categories:

  • Amenity-based: parks within a given radius, gas stations within a given radius, walk score, bike score
  • City Network Structure: intersection count, average circuity, street length average, average streets per node, elevation level
  • Distance-based: proximity to closest highway, primary road, secondary road, residential road
  • Scooter-specific attributes: battery level, proximity to closest scooter, high battery level (> 90%) scooters within a given radius, total scooters within a given radius


Log-Scale Transformation

For each feature, I plotted the distribution to explore the data for feature engineering opportunities. For features with a right-skewed distribution, where the mean is typically greater than the median, I applied these log transformations to normalize the distribution and reduce the variability of outlier observations. This approach was used to generate a log feature for proximity to closest scooter, closest highway, primary road, secondary road, and residential road.

An example of a log transformation

Statistical Analysis: A Systematic Approach

Next, I wanted to ensure that the features I included in my model displayed significant differences when broken up by nest classification. My thinking was that any features that did not significantly differ when stratified by nest classification would not have a meaningful predictive impact on whether a scooter was in a nest or not.

Distributions of a feature stratified by their nest classification can be tested for statistically significant differences. I used an unpaired samples t-test with a 0.01% significance level to compute a p-value and confidence interval to determine if there was a statistically significant difference in means for a feature stratified by nest classification. I rejected the null hypothesis if a p-value was smaller than the 0.01% threshold and if the 99.9% confidence interval did not straddle zero. By rejecting the null-hypothesis in favor of the alternative hypothesis, it’s deemed there is a significant difference in means of a feature by nest classification.

Battery Level Distribution Stratified by Nest Classification to run a t-test

Battery Level Distribution Stratified by Nest Classification to run a t-test

Log of Closest Scooter Distribution Stratified by Nest Classification to run a t-test

Throwing Away Features

Using the approach above, I removed ten features that did not display statistically significant results.

Statistically Insignificant Features Removed Before Model Development

Model Development

I trained two models, a random forest classifier and an extreme gradient boosting classifier since tree-based models can handle skewed data, capture important feature interactions, and provide a feature importance calculation. I trained the models on 70% of the data collected for all four cities and reserved the remaining 30% for testing.

After hyper-parameter tuning the models for performance on cross-validation data it was time to run the models on the 30% of test data set aside from the initial data collection.

I also collected additional test data from other cities (Columbus, Fort Lauderdale, San Diego) not involved in training the models. I took this step to ensure the selection of a machine learning model that would generalize well across cities. The performance of each model on the additional test data determined which model would be integrated into the application development.

Performance on Additional Cities Test Data

The Random Forest Classifier displayed superior performance across the board

The Random Forest Classifier displayed superior performance across the board

I opted to move forward with the random forest model because of its superior performance on AUC score and accuracy metrics on the additional cities test data. AUC is the Area under the ROC Curve, and it provides an aggregate measure of model performance across all possible classification thresholds.

AUC Score on Test Data for each Model

AUC Score on Test Data for each Model

Feature Importance

Battery level dominated as the most important feature. Additional important model features were proximity to high level battery scooters, proximity to closest scooter, and average distance to high level battery scooters.

Feature Importance for the Random Forest Classifier

Feature Importance for the Random Forest Classifier

The Trade-off Space

Once I had a working machine learning model for nest classification, I started to build out the application using the Flask web framework written in Python. After spending a few days of writing code for the application and incorporating the trained random forest model, I had enough to test out the basic functionality. I could finally run the application locally to call the Bird API and classify scooter’s into nests in real-time! There was one huge problem, though. It took more than seven minutes to generate the predictions and populate in the application. That just wasn’t going to cut it.

The question remained: will this model deliver in a production grade environment with the goal of making real-time classifications? This is a key trade-off in production grade machine learning applications where on one end of the spectrum we’re optimizing for model performance and on the other end we’re optimizing for low latency application performance.

As I continued to test out the application’s performance, I still faced the challenge of relying on so many APIs for real-time feature generation. Due to rate-limiting constraints and daily request limits across so many external APIs, the current machine learning classifier was not feasible to incorporate into the final application.

Run-Time Compliant Application Model

After going back to the drawing board, I trained a random forest model that relied primarily on scooter-specific features which were generated directly from the Bird API.

Through a process called vectorization, I was able to transform the geolocation distance calculations utilizing NumPy arrays which enabled batch operations on the data without writing any “for” loops. The distance calculations were applied simultaneously on the entire array of geolocations instead of looping through each individual element. The vectorization implementation optimized real-time feature engineering for distance related calculations which improved the application response time by a factor of ten.

Feature Importance for the Run-time Compliant Random Forest Classifier

Feature Importance for the Run-time Compliant Random Forest Classifier

This random forest model generalized well on test-data with an AUC score of 0.95 and an accuracy rate of 91%. The model retained its prediction accuracy compared to the former feature-rich model, but it gained 60x in application performance. This was a necessary trade-off for building a functional application with real-time prediction capabilities.

Geospatial Clustering

Now that I finally had a working machine learning model for classifying nests in a production grade environment, I could generate new nest locations for the non-nest scooters. The goal was to generate geospatial clusters based on the number of non-nest scooters in a given location.

The k-means algorithm is likely the most common clustering algorithm. However, k-means is not an optimal solution for widespread geolocation data because it minimizes variance, not geodetic distance. This can create suboptimal clustering from distortion in distance calculations at latitudes far from the equator. With this in mind, I initially set out to use the DBSCAN algorithm which clusters spatial data based on two parameters: a minimum cluster size and a physical distance from each point. There were a few issues that prevented me from moving forward with the DBSCAN algorithm.

  1. The DBSCAN algorithm does not allow for specifying the number of clusters, which was problematic as the goal was to generate a number of clusters as a function of non-nest scooters.
  2. I was unable to hone in on an optimal physical distance parameter that would dynamically change based on the Bird API data. This led to suboptimal nest locations due to a distortion in how the physical distance point was used in clustering. For example, Santa Monica, where there are ~15,000 scooters, has a higher concentration of scooters in a given area whereas Brookline, MA has a sparser set of scooter locations.

An example of how sparse scooter locations vs. highly concentrated scooter locations for a given Bird API call can create cluster distortion based on a static physical distance parameter in the DBSCAN algorithm. Left:Bird scooters in Brookline, MA. Right:Bird scooters in Santa Monica, CA.

An example of how sparse scooter locations vs. highly concentrated scooter locations for a given Bird API call can create cluster distortion based on a static physical distance parameter in the DBSCAN algorithm. Left:Bird scooters in Brookline, MA. Right:Bird scooters in Santa Monica, CA.

Given the granularity of geolocation scooter data I was working with, geospatial distortion was not an issue and the k-means algorithm would work well for generating clusters. Additionally, the k-means algorithm parameters allowed for dynamically customizing the number of clusters based on the number of non-nest scooters in a given location.

Once clusters were formed with the k-means algorithm, I derived a centroid from all of the observations within a given cluster. In this case, the centroids are the mean latitude and mean longitude for the scooters within a given cluster. The centroids coordinates are then projected as the new nest recommendations.

NestGenerator showcasing non-nest scooters and new nest recommendations utilizing the K-Means algorithm

NestGenerator showcasing non-nest scooters and new nest recommendations utilizing the K-Means algorithm.

NestGenerator Application

After wrapping up the machine learning components, I shifted to building out the remaining functionality of the application. The final iteration of the application is deployed to Heroku’s cloud platform.

In the NestGenerator app, a user specifies a location of their choosing. This will then call the Bird API for scooters within that given location and generate all of the model features for predicting nest classification using the trained random forest model. This forms the foundation for map filtering based on nest classification. In the app, a user has the ability to filter the map based on nest classification.

Drop-Down Map View filtering based on Nest Classification

Drop-Down Map View filtering based on Nest Classification

Nearest Generated Nest

To see the generated nest recommendations, a user selects the “Current Non-Nest Scooters & Predicted Nest Locations” filter which will then populate the application with these nest locations. Based on the user’s specified search location, a table is provided with the proximity of the five closest nests and an address of the Nest location to help inform a Bird charger in their decision-making.

NestGenerator web-layout with nest addresses and proximity to nearest generated nests

NestGenerator web-layout with nest addresses and proximity to nearest generated nests

Conclusion

By accurately predicting nest classification and clustering non-nest scooters, NestGenerator provides an automated recommendation engine for new nest locations. For Bird, this application can help power their nest location generation that runs within their Android and iOS applications. NestGenerator also provides real-time strategic insight for Bird chargers who are enticed to optimize their scooter collection and drop-off route based on scooters and nest locations in their area.

Code

The code for this project can be found on my GitHub

Comments or Questions? Please email me an E-Mail!


Interview – Knowledge Graphs and Semantic Technologies

“It’s incredibly empowering when data that is clear and understood – what we call ‘beautiful data’ – is available to the data workforce.”

Juan F. Sequeda is co-founder of Capsenta, a spin-off from his research, and Senior Director of Capsenta Labs. He is an expert on knowledge graphs, semantic web, semantic & graph data management and (ontology-based) data integration. In this interview Juan lets us know how SMEs can create value from data, what makes the Knowledge Graph so important and why CDOs and CIOs should use semantic technologies.

Data Science Blog: If you had to name five things that apply to SMEs as well as enterprises as they are on their journey through digital transformation: What are the most important steps to take in order to create value from data?

I would state four things:

  1. Focus on the business problem that needs to be solved instead of the technology.
  2. Getting value out of your data is a social-technical problem. Not everything can be solved by technology and automation. It is crucial to understand the social/human aspect of the problems.
  3. Avoid boiling the ocean. Be agile and iterate.
  4. Recall that it’s a marathon, not a sprint. Hence why you shouldn’t focus on boiling the ocean.

Data Science Blog: You help companies to make their company data meaningfully and thus increase their value. The magic word is the knowledge graph. What exactly is a Knowledge Graph?

Let’s recall that the term “knowledge graph”, that is being actively used today, was coined by Google in a 2012 blogpost. From an industry point of view, it’s a term that represents data integration, where not just entities but also relationships are first class citizens. In other words, it’s data integration based on graphs. That is why you see graph database companies use the term knowledge graph instead of data integration.

In the academic circle, there is a “debate” on what the term “knowledge graph” means. As academics, it’s clear that we should always strive to have well defined terms. Nevertheless, I find it ironic that academics are spending time debating on the definition of a term that appeared in a (marketing) blog post 7 years ago! I agree with Simeon Warner on this: “I care about putting more knowledge in my graph, instead of defining what is a knowledge graph”.

Whatever definition prevails, it should be open and inclusive.

On a final note, it is paramount that we remember our history in order to avoid reinventing the wheel. There is over half a century of research results that has led us to what we are calling Knowledge Graphs today. If you are interested, please check out our upcoming ISWC 2019 tutorial “Knowledge Graphs: How did we get here? A Half Day Tutorial on the History of Knowledge Graph’s Main Ideas“.

Data Science Blog: Speaking of Knowledge Graphs: According to SEMANTiCS 2019 Research and Innovation Chair Philippe Cudre-Mauroux the next generation of knowledge graphs will capture more detailed information. Towards which directions are you steering with gra.fo?

Gra.fo is a knowledge graph schema (i.e ontology) collaborative modeling tool combined with google doc style features such as real-time collaboration, comments, history and search.

Designing a knowledge graph schema is just the first step. You have to do something with it! The next step is to map the knowledge graph schema to underlying data sources in order to integrate data.

We are driving Gra.fo to also be a mapping management system. We recently released our first mapping features. You now have the ability to import existing R2RML mapping. The next step will be to create the mappings between relational databases and the schema all within Gra.fo. Furthermore, we will extend to support mappings from different types of sources.

Finally, there are so many features that our users are requesting. We are working on those and will also offer an API in order to empower users to develop their own apps and features.

Data Science Blog: At Capsenta, you are changing the way enterprises model, govern and integrate data. Put in brief, how can you explain the benefits of using semantic technologies and knowledge technologies to a CDO or CIO? Which clients could you serve and how did you help them?

Business users need to answer critical business questions quickly and accurately. However, the frequent bottleneck is the lack of understanding of the large and complex enterprise databases. Additionally, the IT experts who do understand are not always available. The ultimate goal is to empower business users to access the data in the way they think of their domain.

This is where Knowledge Graphs come into play.

At Capsenta, we use our Knowledge Graph technology to bridge this conceptualization gap between the complex and inscrutable data sources and the business intelligence and data analytic tools that domain experts use to answer critical business questions. Our goal is to deliver beautiful data so the business users and data scientist can run with the data.

We are helping large scale enterprises in e-commerce, oil & gas and life science industries to generate beautiful data.

Data Science Blog: What are reasons for which Knowledge Graphs should be part of any corporate strategy?

Graphs are very easy for people to understand and express the complex relationships between concepts. Bubbles and lines between them (i.e. a graph!) is what domain experts draw on the whiteboard all the time. We have even had C-level executives look at a Knowledge Graph and immediately see how it expresses a portion of their business and even offer suggestions for additional richness. Imagine that, C-level executives participating in an ontology engineering session because they understand the graph.

This is in sharp contrast to the data itself, which is almost always very difficult to understand and overwhelming in scope. Critical business value is available in a subset of this data. A Knowledge Graph bridges the conceptual gap between a critical portion of the inscrutable data itself and the business user’s view of their world.

It’s incredibly empowering when data that is clear and understood – what we call “beautiful data” – is available to the data workforce.

Data Science Blog: Data-driven process analyzes require interdisciplinary knowledge. What advice would you give to a process manager who wants to familiarize her-/himself with the topic?

Domain experts/business users frequently use multiple words/phrases to mean the same thing and also a specific phrase can mean different things to different people. Also, the domain experts/business users speak a very different language than the IT database owners.

How can the business have clear, accurate answers when there’s inconsistency in what people mean and are thinking?

This is the social problem of getting everyone on the same page. We’ve seen Knowledge Graphs dramatically help with this problem. The exercise of getting people to agree upon what they mean and encoding it in an intuitive Knowledge Graph is very powerful.

The Knowledge Graph also brings the IT stakeholders into the process by clarifying exactly what data or, typically, complex calculations of data is the actual, accurate value for each and every business concept and relationship expressed in the Knowledge Graph.

It is crucial to avoid boiling the ocean. That is why we have designed a pay-as-you-go methodology to start small and provide value as quickly and accurately as possible. Ideally, the team has available what we call a “Knowledge Engineer”. This is someone who can effectively speak with the business users/domain experts and also nerd out with the database folks.

About SEMANTiCS Conference

SEMANTiCS is an established knowledge hub where technology professionals, industry experts, researchers and decision makers can learn about new technologies, innovations and enterprise implementations in the fields of Linked Data and Semantic AI. Founded in 2005 the SEMANTiCS is the only European conference at the intersection of research and industry.

This year’s event is hosted by the Semantic Web Company, FIZ Karlsruhe – Leibniz Institute for Information Infrastructure GmbH, Fachhochschule St. Pölten Forschungs GmbH, KILT Competence Center am Institut für Angewandte Informatik e.V. and Vrije Universiteit Amsterdam.

Interview: Does Business Intelligence benefit from Cloud Data Warehousing?

Interview with Ross Perez, Senior Director, Marketing EMEA at Snowflake

Read this article in German:
“Profitiert Business Intelligence vom Data Warehouse in der Cloud?”

Does Business Intelligence benefit from Cloud Data Warehousing?

Ross Perez is the Senior Director, Marketing EMEA at Snowflake. He leads the Snowflake marketing team in EMEA and is charged with starting the discussion about analytics, data, and cloud data warehousing across EMEA. Before Snowflake, Ross was a product marketer at Tableau Software where he founded the Iron Viz Championship, the world’s largest and longest running data visualization competition.

Data Science Blog: Ross, Business Intelligence (BI) is not really a new trend. In 2019/2020, making data available for the whole company should not be a big thing anymore. Would you agree?

BI is definitely an old trend, reporting has been around for 50 years. People are accustomed to seeing statistics and data for the company at large, and even their business units. However, using BI to deliver analytics to everyone in the organization and encouraging them to make decisions based on data for their specific area is relatively new. In a lot of the companies Snowflake works with, there is a huge new group of people who have recently received access to self-service BI and visualization tools like Tableau, Looker and Sigma, and they are just starting to find answers to their questions.

Data Science Blog: Up until today, BI was just about delivering dashboards for reporting to the business. The data warehouse (DWH) was something like the backend. Today we have increased demand for data transparency. How should companies deal with this demand?

Because more people in more departments are wanting access to data more frequently, the demand on backend systems like the data warehouse is skyrocketing. In many cases, companies have data warehouses that weren’t built to cope with this concurrent demand and that means that the experience is slow. End users have to wait a long time for their reports. That is where Snowflake comes in: since we can use the power of the cloud to spin up resources on demand, we can serve any number of concurrent users. Snowflake can also house unlimited amounts of data, of both structured and semi-structured formats.

Data Science Blog: Would you say the DWH is the key driver for becoming a data-driven organization? What else should be considered here?

Absolutely. Without having all of your data in a single, highly elastic, and flexible data warehouse, it can be a huge challenge to actually deliver insight to people in the organization.

Data Science Blog: So much for the theory, now let’s talk about specific use cases. In general, it matters a lot whether you are storing and analyzing e.g. financial data or machine data. What do we have to consider for both purposes?

Financial data and machine data do look very different, and often come in different formats. For instance, financial data is often in a standard relational format. Data like this needs to be able to be easily queried with standard SQL, something that many Hadoop and noSQL tools were unable to provide. Luckily, Snowflake is an ansi-standard SQL data warehouse so it can be used with this type of data quite seamlessly.

On the other hand, machine data is often semi-structured or even completely unstructured. This type of data is becoming significantly more common with the rise of IoT, but traditional data warehouses were very bad at dealing with it since they were optimized for relational data. Semi-structured data like JSON, Avro, XML, Orc and Parquet can be loaded into Snowflake for analysis quite seamlessly in its native format. This is important, because you don’t want to have to flatten the data to get any use from it.

Both types of data are important, and Snowflake is really the first data warehouse that can work with them both seamlessly.

Data Science Blog: Back to the common business use case: Creating sales or purchase reports for the business managers, based on data from ERP-systems such as Microsoft or SAP. Which architecture for the DWH could be the right one? How many and which database layers do you see as necessary?

The type of report largely does not matter, because in all cases you want a data warehouse that can support all of your data and serve all of your users. Ideally, you also want to be able to turn it off and on depending on demand. That means that you need a cloud-based architecture… and specifically Snowflake’s innovative architecture that separates storage and compute, making it possible to pay for exactly what you use.

Data Science Blog: Where would you implement the main part of the business logic for the report? In the DWH or in the reporting tool? Does it matter which reporting tool we choose?

The great thing is that you can choose either. Snowflake, as an ansi-Standard SQL data warehouse, can support a high degree of data modeling and business logic. But you can also utilize partners like Looker and Sigma who specialize in data modeling for BI. We think it’s best that the customer chooses what is right for them.

Data Science Blog: Snowflake enables organizations to store and manage their data in the cloud. Does it mean companies lose control over their storage and data management?

Customers have complete control over their data, and in fact Snowflake cannot see, alter or change any aspect of their data. The benefit of a cloud solution is that customers don’t have to manage the infrastructure or the tuning – they decide how they want to store and analyze their data and Snowflake takes care of the rest.

Data Science Blog: How big is the effort for smaller and medium sized companies to set up a DWH in the cloud? Does this have to be an expensive long-term project in every case?

The nice thing about Snowflake is that you can get started with a free trial in a few minutes. Now, moving from a traditional data warehouse to Snowflake can take some time, depending on the legacy technology that you are using. But Snowflake itself is quite easy to set up and very much compatible with historical tools making it relatively easy to move over.