Article series: 5 Clean Coding Tips – 2. Name Variables in a Meaningful Way

This is the second of the article series “5 tips for clean coding” to follow as soon as you’ve made the first steps into your coding career, in this article series. Read the introduction here, to find out why it is important to write clean code if you missed it.

When it comes to naming variables, there are a few official rules in the PEP8 style guide. A variable must start with an underscore or a letter and can be followed by a number of underscores or letters or digits. They cannot be reserved words: True, False, or, not, lambda etc. The preferred naming style is lowercase or lowercase_with_underscore. This all refers to variable names on a visual level. However, for readability purposes, the semantic level is as important, or maybe even more so. If it was for python, the variables could be named like this:

b_a327647_3 = DataFrame() 
hw_abc7622 = DataFrame()  
a10001_kkl = DataFrame()

It wouldn’t make the slightest difference. But again, the code is not only for the interpreter to be read. It is for humans. Other people might need to look at your code to understand what you did, to be able to continue the work that you have already started. In any case, they need to be able to decipher what hides behind the variable names, that you’ve given the objects in your code. They will need to remember what they meant as they reappear in the code. And it might not be easy for them.

Remembering names is not an easy thing to do in all life situations. Let’s consider the following situation. You go to a party, there is a bunch of new people that you meet for the first time. They all have names and you try very hard to remember them all. Imagine how much easier would it be if you could call the new girl who came with John as the_girl_who_came_with_John. How much easier would it be to gossip to your friends about her? ‘Camilla is on the 5th glass of wine tonight, isn’t she?!.’ ‘Who are you talking about???’ Your friends might ask. ‘The_Girl_who_came_with_John.’ And they will all know. ‘It was nice to meet you girl_who_came_with_john, see you around.’ The good thing is that variables are not really like people. You can be a bit rude to them, they will not mind. You don’t have to force yourself or anyone else to remember an arbitrary name of a variable, that accidentally came to your mind in the moment of creation. Let your colleagues figure out what is what by a meaningful, straightforward description of it.

There is an important tradeoff to be aware of here. The lines of code should not exceed a certain length (79 characters, according to the PEP 8), therefore, it is recommended that you keep your names as short as possible. It is worth to give it a bit of thought about how you can name your variable in the most descriptive way, keeping it as short as possible. Keep in mind, that
the_blond_girl_in_a_dark_blue_dress_who_came_with_John_to_this_party might not be the best choice.

There are a few additional pieces of advice when it comes to naming your variables. First, try to always use pronounceable names. If you’ve ever been to an international party, you will know how much harder to remember is something that you cannot even repeat. Second, you probably have been taught over and over again that whenever you create a loop, you use i and j to denote the iterators.

for i in m:
    for j in n:

It is probably engraved deep into the folds in your brain to write for i in…. You need to try and scrape it out of your cortex. Think about what the i stands for, what it really does and name it accordingly. Is i maybe the row_index? Is it a list_element?

for element in list_of_words:
    for letter in word:

Additionally, think about when to use a noun and where a verb. Variables usually are things and functions usually do things. So, it might be better to name functions with verb expressions, for example: get_id() or raise_to_power().

Moreover, it is a good practice to name constant numbers in the code. First, because when you name them you explain the meaning of the number. Second, because maybe one day you will have to change that number. If it appears multiple times in your code, you will avoid searching and changing it in every place. PEP 8 states that the constants should be named with UPPER_CASE_NAME. It is also quite common practice to explain the meaning of the constants with an inline comment at the end of the line, where the number appears. However, this approach will increase the line length and will require repeating the comment if the number appears more than one time in the code.

How Important is Customer Lifetime Value?

This is the third article of article series Getting started with the top eCommerce use cases. If you are interested in reading the first article you can find it here.

Customer Lifetime Value

Many researches have shown that cost for acquiring a new customer is higher than the cost of retention of an existing customer which makes Customer Lifetime Value (CLV or LTV) one of the most important KPI’s. Marketing is about building a relationship with your customer and quality service matters a lot when it comes to customer retention. CLV is a metric which determines the total amount of money a customer is expected to spend in your business.

CLV allows marketing department of the company to understand how much money a customer is going  to spend over their  life cycle which helps them to determine on how much the company should spend to acquire each customer. Using CLV a company can better understand their customer and come up with different strategies either to retain their existing customers by sending them personalized email, discount voucher, provide them with better customer service etc. This will help a company to narrow their focus on acquiring similar customers by applying customer segmentation or look alike modeling.

One of the main focus of every company is Growth in this competitive eCommerce market today and price is not the only factor when a customer makes a decision. CLV is a metric which revolves around a customer and helps to retain valuable customers, increase revenue from less valuable customers and improve overall customer experience. Don’t look at CLV as just one metric but the journey to calculate this metric involves answering some really important questions which can be crucial for the business. Metrics and questions like:

  1. Number of sales
  2. Average number of times a customer buys
  3. Full Customer journey
  4. How many marketing channels were involved in one purchase?
  5. When the purchase was made?
  6. Customer retention rate
  7. Marketing cost
  8. Cost of acquiring a new customer

and so on are somehow associated with the calculation of CLV and exploring these questions can be quite insightful. Lately, a lot of companies have started to use this metric and shift their focuses in order to make more profit. Amazon is the perfect example for this, in 2013, a study by Consumers Intelligence Research Partners found out that prime members spends more than a non-prime member. So Amazon started focusing on Prime members to increase their profit over the past few years. The whole article can be found here.

How to calculate CLV?

There are several methods to calculate CLV and few of them are listed below.

Method 1: By calculating average revenue per customer


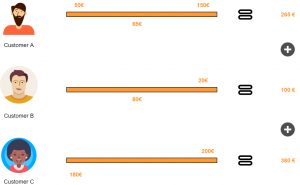
Figure 1: Using average revenue per customer


Let’s suppose three customers brought 745€ as profit to a company over a period of 2 months then:

CLV (2 months) = Total Profit over a period of time / Number of Customers over a period of time

CLV (2 months) = 745 / 3 = 248 €

Now the company can use this to calculate CLV for an year however, this is a naive approach and works only if the preferences of the customer are same for the same period of time. So let’s explore other approaches.

Method 2

This method requires to first calculate KPI’s like retention rate and discount rate.


CLV = Gross margin per lifespan ( Retention rate per month / 1 + Discount rate – Retention rate per month)

Where

Retention rate = Customer at the end of the month – Customer during the month / Customer at the beginning of the month ) * 100

Method 3

This method will allow us to look at other metrics also and can be calculated in following steps:

  1. Calculate average number of transactions per month (T)
  2. Calculate average order value (OV)
  3. Calculate average gross margin (GM)
  4. Calculate customer lifespan in months (ALS)

After calculating these metrics CLV can be calculated as:


CLV = T*OV*GM*ALS / No. of Clients for the period

where

Transactions (T) = Total transactions / Period

Average order value (OV) = Total revenue / Total orders

Gross margin (GM) = (Total revenue – Cost of sales/ Total revenue) * 100 [but how you calculate cost of sales is debatable]

Customer lifespan in months (ALS) = 1 / Churn Rate %


CLV can be calculated using any of the above mentioned methods depending upon how robust your company wants the analysis to be. Some companies are also using Machine learning models to predict CLV, maybe not directly but they use ML models to predict customer churn rate, retention rate and other marketing KPI’s. Some companies take advantage of all the methods by taking an average at the end.

Matrix search: Finding the blocks of neighboring fields in a matrix with Python

Task

In this article we will look at a solution in python to the following grid search task:

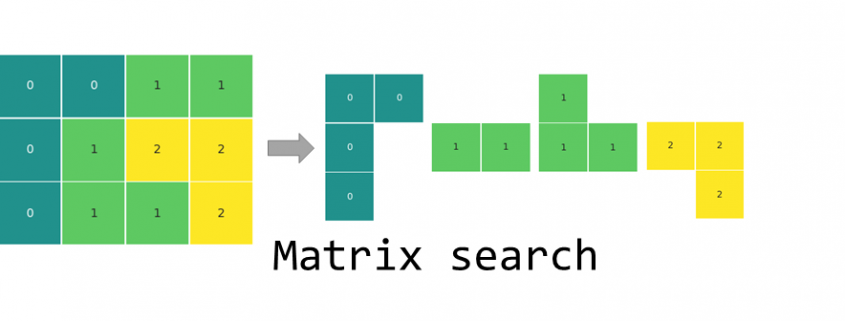
Find the biggest block of adjoining elements of the same kind and into how many blocks the matrix is divided. As adjoining blocks, we will consider field touching by the sides and not the corners.

Input data

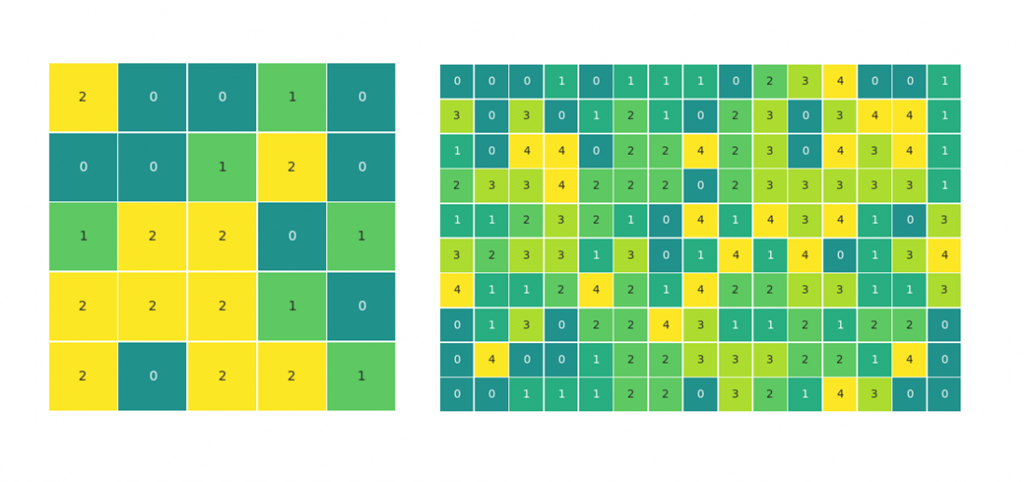
For the ease of the explanation, we will be looking at a simple 3×4 matrix with elements of three different kinds, 0, 1 and 2 (see above). To test the code, we will simulate data to achieve different matrix sizes and a varied number of element types. It will also allow testing edge cases like, where all elements are the same or all elements are different.

To simulate some test data for later, we can use the numpy randint() method:

import numpy as np
matrix = [[0,0,1,1], [0,1,2,2], [0,1,1,2]]

matrix_test1 = np.random.randint(3, size = (5,5))
matrix_test2 = np.random.randint(5, size = (10,15))

The code

def find_blocks(matrix):
    visited = []
    block_list = []     
    for x in range(len(matrix)):
        for y in range(len(matrix[0])):
            if (x, y) not in visited:
                field_count, visited = explore_block(x, y, visited)
                block_list.append(field_count)                 
    return print('biggest block: {0}, number of blocks: {1}'
                 .format(max(block_list), len(block_list)))

def explore_block(x, y, visited):
    queue = {(x,y)}
    field_count = 1
    while queue:  
        x,y = queue.pop()
        visited.append((x,y))
        if x+1<len(matrix) and (x+1,y) not in visited and (x+1,y) not in queue:
            if matrix[x+1][y] == matrix[x][y]:
                field_count += 1
                queue.add((x+1,y))         
        if x-1>=0 and (x-1,y) not in visited and (x-1,y) not in queue:
            if matrix[x-1][y] == matrix[x][y]:
                field_count += 1
                queue.add((x-1,y))                    
        if y-1>=0 and (x,y-1) not in visited and (x,y-1) not in queue:
            if matrix[x][y-1] == matrix[x][y]:
                field_count += 1
                queue.add((x,y-1))                    
        if y+1<len(matrix[0]) and (x,y+1) not in visited and (x,y+1) not in queue:
            if matrix[x][y+1] == matrix[x][y]:
                field_count += 1
                queue.add((x,y+1))                                              
    return field_count, visited

How the code works

In summary, the algorithm loops through all fields of the matrix looking for unseen fields that will serve as a starting point for a local exploration of each block of color – the find_blocks() function. The local exploration is done by looking at the neighboring fields and if they are within the same kind, moving to them to explore further fields – the explore_block() function. The fields that have already been seen and counted are stored in the visited list.

find_blocks() function:

  1. Finds a starting point of a new block
  2. Runs a the explore_block() function for local exploration of the block
  3. Appends the size of the explored block
  4. Updates the list of visited points
  5. Returns the result, once all fields of the matrix have been visited.

explore_block() function:

  1. Takes the coordinates of the starting field for a new block and the list of visited points
  2. Creates the queue set with the starting point
  3. Sets the size of the current block (field_count) to 1
  4. Starts a while loop that is executed for as long as the queue is not empty
    1. Takes an element of the queue and uses its coordinates as the current location for further exploration
    2. Adds the current field to the visited list
    3. Explores the neighboring fields and if they belong to the same block, they are added to the queue
    4. The fields are taken off the queue for further exploration one by one until the queue is empty
  5. Returns the field_count of the explored block and the updated list of visited fields

Execute the function

find_blocks(matrix)

The returned result is biggest block: 4, number of blocks: 4.

Run the test matrices:

find_blocks(matrix_test1)
find_blocks(matrix_test2)

Visualization

The matrices for the article were visualized with the seaborn heatmap() method.

import seaborn as sns
import matplotlib.pyplot as plt
# use annot=False for a matrix without the number labels
sns.heatmap(matrix, annot=True, center = 0, linewidths=.5, cmap = "viridis",
            xticklabels=False, yticklabels=False, cbar=False, square=True)
plt.show()

Introduction to Recommendation Engines

This is the second article of article series Getting started with the top eCommerce use cases. If you are interested in reading the first article you can find it here.

What are Recommendation Engines?

Recommendation engines are the automated systems which helps select out similar things whenever a user selects something online. Be it Netflix, Amazon, Spotify, Facebook or YouTube etc. All of these companies are now using some sort of recommendation engine to improve their user experience. A recommendation engine not only helps to predict if a user prefers an item or not but also helps to increase sales, ,helps to understand customer behavior, increase number of registered users and helps a user to do better time management. For instance Netflix will suggest what movie you would want to watch or Amazon will suggest what kind of other products you might want to buy. All the mentioned platforms operates using the same basic algorithm in the background and in this article we are going to discuss the idea behind it.

What are the techniques?

There are two fundamental algorithms that comes into play when there’s a need to generate recommendations. In next section these techniques are discussed in detail.

Content-Based Filtering

The idea behind content based filtering is to analyse a set of features which will provide a similarity between items themselves i.e. between two movies, two products or two songs etc. These set of features once compared gives a similarity score at the end which can be used as a reference for the recommendations.

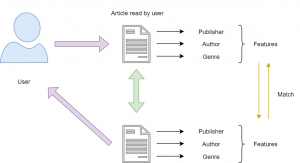
There are several steps involved to get to this similarity score and the first step is to construct a profile for each item by representing some of the important features of that item. In other terms, this steps requires to define a set of characteristics that are discovered easily. For instance, consider that there’s an article which a user has already read and once you know that this user likes this article you may want to show him recommendations of similar articles. Now, using content based filtering technique you could find the similar articles. The easiest way to do that is to set some features for this article like publisher, genre, author etc. Based on these features similar articles can be recommended to the user (as illustrated in Figure 1). There are three main similarity measures one could use to find the similar articles mentioned below.


Figure 1: Content-Based Filtering


Minkowski distance

Minkowski distance between two variables can be calculated as:

(x,y)= (\sum_{i=1}^{n}{|X_{i} - Y_{i}|^{p}})^{1/p}


Cosine Similarity

Cosine similarity between two variables can be calculated as :

  \mbox{Cosine Similarity} = \frac{\sum_{i=1}^{n}{x_{i} y_{i}}} {\sqrt{\sum_{i=1}^{n}{x_{i}^{2}}} \sqrt{\sum_{i=1}^{n}{y_{i}^{2}}}} \


Jaccard Similarity


  J(X,Y) = |X ∩ Y| / |X ∪ Y|


These measures can be used to create a matrix which will give you the similarity between each movie and then a function can be defined to return the top 10 similar articles.


Collaborative filtering

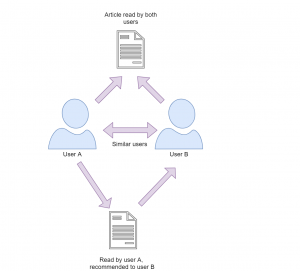
This filtering method focuses on finding how similar two users or two products are by analyzing user behavior or preferences rather than focusing on the content of the items. For instance consider that there are three users A,B and C.  We want to recommend some movies to user A, our first approach would be to find similar users and compare which movies user A has not yet watched and recommend those movies to user A.  This approach where we try to find similar users is called as User-User Collaborative Filtering.  

The other approach that could be used here is when you try to find similar movies based on the ratings given by others, this type is called as Item-Item Collaborative Filtering. The research shows that item-item collaborative filtering works better than user-user collaborative filtering as user behavior is really dynamic and changes over time. Also, there are a lot more users and increasing everyday but on the other side item characteristics remains the same. To calculate the similarities we can use Cosine distance.


Figure 2: Collaborative Filtering


Recently some companies have started to take advantage of both content based and collaborative filtering techniques to make a hybrid recommendation engine. The results from both models are combined into one hybrid model which provides more accurate recommendations. Five steps are involved to make a recommendation engine work which are collection of data, storing of data, analyzing the data, filtering the data and providing recommendations. There are a lot of attributes that are involved in order to collect user data including browsing history, page views, search logs, order history, marketing channel touch points etc. which requires a strong data architecture.  The collection of data is pretty straightforward but it can be overwhelming to analyze this amount of data. Storing this data could get tricky on the other hand as you need a scalable database for this kind of data. With the rise of graph databases this area is also improving for many use cases including recommendation engines. Graph databases like Neo4j can also help to analyze and find similar users and relationship among them. Analyzing the data can be carried in different ways, depending on how strong and scalable your architecture you can run real time, batch or near real time analysis. The fourth step involves the filtering of the data and here you can use any of the above mentioned approach to find similarities to finally provide the recommendations.

Having a good recommendation engine can be time consuming initially but it is definitely beneficial in the longer run. It not only helps to generate revenue but also helps to to improve your product catalog and customer service.

Multi-touch attribution: A data-driven approach

Customers shopping behavior has changed drastically when it comes to online shopping, as nowadays, customer likes to do a thorough market research about a product before making a purchase.

What is Multi-touch attribution?

This makes it really hard for marketers to correctly determine the contribution for each marketing channel to which a customer was exposed to. The path a customer takes from his first search to the purchase is known as a Customer Journey and this path consists of multiple marketing channels or touchpoints. Therefore, it is highly important to distribute the budget between these channels to maximize return. This problem is known as multi-touch attribution problem and the right attribution model helps to steer the marketing budget efficiently. Multi-touch attribution problem is well known among marketers. You might be thinking that if this is a well known problem then there must be an algorithm out there to deal with this. Well, there are some traditional models  but every model has its own limitation which will be discussed in the next section.

Types of attribution models

Most of the eCommerce companies have a performance marketing department to make sure that the marketing budget is spent in an agile way. There are multiple heuristics attribution models pre-existing in google analytics however there are several issues with each one of them. These models are:

Traditional attribution models

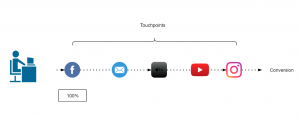
First touch attribution model

100% credit is given to the first channel as it is considered that the first marketing channel was responsible for the purchase.

Figure 1: First touch attribution model

Last touch attribution model

100% credit is given to the last channel as it is considered that the first marketing channel was responsible for the purchase.

Figure 2: Last touch attribution model

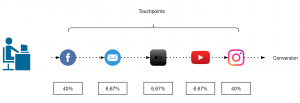
Linear-touch attribution model

In this attribution model, equal credit is given to all the marketing channels present in customer journey as it is considered that each channel is equally responsible for the purchase.

Figure 3: Linear attribution model

U-shaped or Bath tub attribution model

This is most common in eCommerce companies, this model assigns 40% to first and last touch and 20% is equally distributed among the rest.

Figure 4: Bathtub or U-shape attribution model

Data driven attribution models

Traditional attribution models follows somewhat a naive approach to assign credit to one or all the marketing channels involved. As it is not so easy for all the companies to take one of these models and implement it. There are a lot of challenges that comes with multi-touch attribution problem like customer journey duration, overestimation of branded channels, vouchers and cross-platform issue, etc.

Switching from traditional models to data-driven models gives us more flexibility and more insights as the major part here is defining some rules to prepare the data that fits your business. These rules can be defined by performing an ad hoc analysis of customer journeys. In the next section, I will discuss about Markov chain concept as an attribution model.

Markov chains

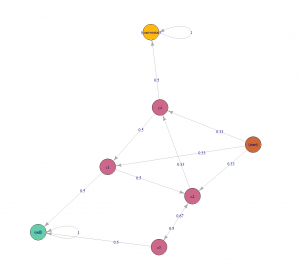
Markov chains concepts revolves around probability. For attribution problem, every customer journey can be seen as a chain(set of marketing channels) which will compute a markov graph as illustrated in figure 5. Every channel here is represented as a vertex and the edges represent the probability of hopping from one channel to another. There will be an another detailed article, explaining the concept behind different data-driven attribution models and how to apply them.

Figure 5: Markov chain example

Challenges during the Implementation

Transitioning from a traditional attribution models to a data-driven one, may sound exciting but the implementation is rather challenging as there are several issues which can not be resolved just by changing the type of model. Before its implementation, the marketers should perform a customer journey analysis to gain some insights about their customers and try to find out/perform:

  1. Length of customer journey.
  2. On an average how many branded and non branded channels (distinct and non-distinct) in a typical customer journey?
  3. Identify most upper funnel and lower funnel channels.
  4. Voucher analysis: within branded and non-branded channels.

When you are done with the analysis and able to answer all of the above questions, the next step would be to define some rules in order to handle the user data according to your business needs. Some of the issues during the implementation are discussed below along with their solution.

Customer journey duration

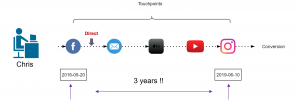
Assuming that you are a retailer, let’s try to understand this issue with an example. In May 2016, your company started a Fb advertising campaign for a particular product category which “attracted” a lot of customers including Chris. He saw your Fb ad while working in the office and clicked on it, which took him to your website. As soon as he registered on your website, his boss called him (probably because he was on Fb while working), he closed everything and went for the meeting. After coming back, he started working and completely forgot about your ad or products. After a few days, he received an email with some offers of your products which also he ignored until he saw an ad again on TV in Jan 2019 (after 3 years). At this moment, he started doing his research about your products and finally bought one of your products from some Instagram campaign. It took Chris almost 3 years to make his first purchase.

Figure 6: Chris journey

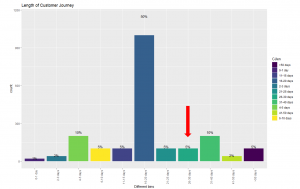
Now, take a minute and think, if you analyse the entire journey of customers like Chris, you would realize that you are still assigning some of the credit to the touchpoints that happened 3 years ago. This can be solved by using an attribution window. Figure 6 illustrates that 83% of the customers are making a purchase within 30 days which means the attribution window here could be 30 days. In simple words, it is safe to remove the touchpoints that happens after 30 days of purchase. This parameter can also be changed to 45 days or 60 days, depending on the use case.

Figure 7: Length of customer journey

Removal of direct marketing channel

A well known issue that every marketing analyst is aware of is, customers who are already aware of the brand usually comes to the website directly. This leads to overestimation of direct channel and branded channels start getting more credit. In this case, you can set a threshold (say 7 days) and remove these branded channels from customer journey.

Figure 8: Removal of branded channels

Cross platform problem

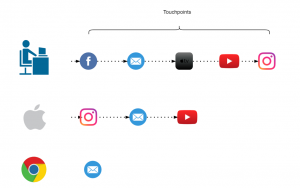
If some of your customers are using different devices to explore your products and you are not able to track them then it will make retargeting really difficult. In a perfect world these customers belong to same journey and if these can’t be combined then, except one, other paths would be considered as “non-converting path”. For attribution problem device could be thought of as a touchpoint to include in the path but to be able to track these customers across all devices would still be challenging. A brief introduction to deterministic and probabilistic ways of cross device tracking can be found here.

Figure 9: Cross platform clash

How to account for Vouchers?

To better account for vouchers, it can be added as a ‘dummy’ touchpoint of the type of voucher (CRM,Social media, Affiliate or Pricing etc.) used. In our case, we tried to add these vouchers as first touchpoint and also as a last touchpoint but no significant difference was found. Also, if the marketing channel of which the voucher was used was already in the path, the dummy touchpoint was not added.

Figure 10: Addition of Voucher as a touchpoint

Understanding Dropout and implementing it on MNIST dataset

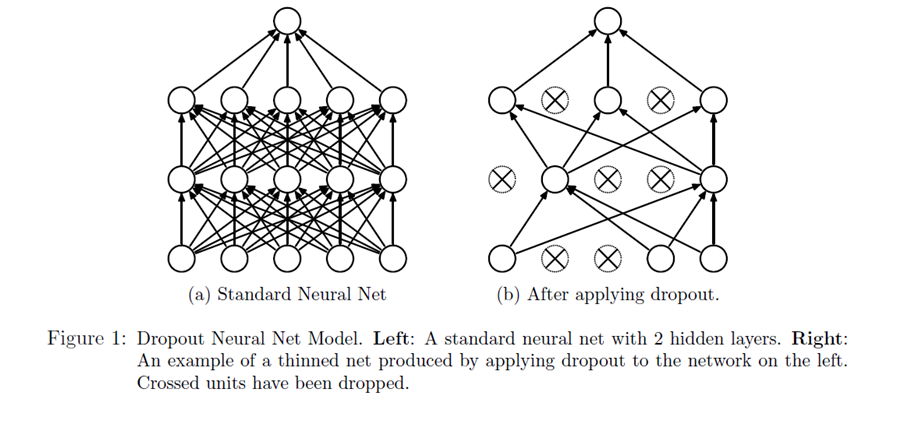
Over-fitting is a major problem in deep learning and a plethora of techniques have been introduced to prevent it. One of the most effective one is called “dropout”.  Let’s use the analogy of a person going to gym for understanding this. Let’s say the person going to gym mostly uses his dominant arm, say his right arm to pick up weights. After some time, he notices that his dominant arm is developing a large muscle, but not the other arm. So, what can he do? Obviously, he needs to involve both his arms while training. Sometimes he should stop using his right arm, and use the left arm to lift weights and vice versa.

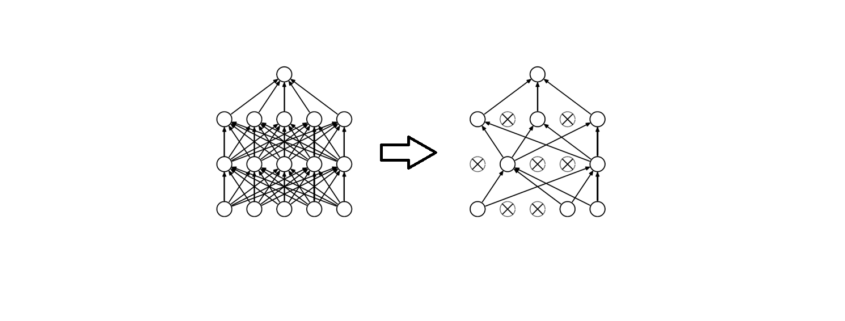
Something like this happens commonly in neural networks. Sometime one part of the network has very large weights and ends up dominating the training. While other part of the network remains weak and does not really play a role in the training. So, what dropout does to solve this problem, is it randomly shuts off some nodes and stop the gradients flowing through it. So, our forward and back propagation happen without those nodes. In that case the rest of the nodes need to pick up the slack and be more active in the training. We define a probability of the nodes getting dropped. For example, P=0.5 means there is a 50% chance a node will be dropped.

Figure 1 demonstrates the dropout technique, taken from the original research paper.

Dropout in a neuronal Net

Our network can never rely on any given node because it can be squashed at any given time. Hence the network is forced to learn redundant representation for everything to make sure at least some of the information remains. Redundant representation leads our network to be more robust. It also acts as ensemble of many networks, since at every epoch random nodes are dropped, each time our network will be different. Ensemble of different networks perform better than a single network since they capture more randomness. Please note, only non-output nodes are dropped.

Let’s, look at the python code to implement dropout in a neural network:

from tensorflow.examples.tutorials.mnist import input_data
mnist = input_data.read_data_sets(".", one_hot=True, reshape=False)

import tensorflow as tf

# Parameters
learning_rate = 0.00001
epochs = 10
batch_size = 128

# Number of samples to calculate validation and accuracy
test_valid_size = 256

# Network Parameters
n_classes = 10  # MNIST total classes (0-9 digits)
dropout = 0.75  # Dropout, probability to keep units


# layers weight & bias
weights = {
    'wc1': tf.Variable(tf.random_normal([5, 5, 1, 32])),
    'wc2': tf.Variable(tf.random_normal([5, 5, 32, 64])),
    'wd1': tf.Variable(tf.random_normal([7*7*64, 1024])),
    'out': tf.Variable(tf.random_normal([1024, n_classes]))}

biases = {
    'bc1': tf.Variable(tf.random_normal([32])),
    'bc2': tf.Variable(tf.random_normal([64])),
    'bd1': tf.Variable(tf.random_normal([1024])),
    'out': tf.Variable(tf.random_normal([n_classes]))}

#function that implements Convolution layer
def conv2d(x, W, b, strides=1):
    x = tf.nn.conv2d(x, W, strides=[1, strides, strides, 1], padding='SAME')
    x = tf.nn.bias_add(x, b)
    return tf.nn.relu(x)

#defining a function to implement maxpool layers
def maxpool2d(x, k=2):
    return tf.nn.max_pool(x, ksize=[1, k, k, 1], strides=[1, k, k, 1], padding='SAME')

#Function that defines all the convolution layers.
def conv_net(x, weights, biases, dropout):
    # Layer 1 - 28*28*1 to 14*14*32
    conv1 = conv2d(x, weights['wc1'], biases['bc1'])
    conv1 = maxpool2d(conv1, k=2)

    # Layer 2 - 14*14*32 to 7*7*64
    conv2 = conv2d(conv1, weights['wc2'], biases['bc2'])
    conv2 = maxpool2d(conv2, k=2)


    # Fully connected layer - 7*7*64 to 1024
    fc1 = tf.reshape(conv2, [-1, weights['wd1'].get_shape().as_list()[0]])
    fc1 = tf.add(tf.matmul(fc1, weights['wd1']), biases['bd1'])
    fc1 = tf.nn.relu(fc1)
    fc1 = tf.nn.dropout(fc1, dropout)  # Implementing the dropout layer

    # Output Layer - class prediction - 1024 to 10
    out = tf.add(tf.matmul(fc1, weights['out']), biases['out'])
    return out

# tf Graph input
x = tf.placeholder(tf.float32, [None, 28, 28, 1])
y = tf.placeholder(tf.float32, [None, n_classes])
keep_prob = tf.placeholder(tf.float32) # Keep probability for dropout layers

# Model
logits = conv_net(x, weights, biases, keep_prob)

# Define loss and optimizer
cost = tf.reduce_mean(tf.nn.softmax_cross_entropy_with_logits(logits=logits, labels=y))
optimizer = tf.train.GradientDescentOptimizer(learning_rate=learning_rate).minimize(cost)

# Accuracy
correct_pred = tf.equal(tf.argmax(logits, 1), tf.argmax(y, 1))
accuracy = tf.reduce_mean(tf.cast(correct_pred, tf.float32))

# Initializing the variables
init = tf.global_variables_initializer()

# Launch the graph
with tf.Session() as sess:
    sess.run(init)

    for epoch in range(epochs):
        for batch in range(mnist.train.num_examples//batch_size):
            batch_x, batch_y = mnist.train.next_batch(batch_size)
            sess.run(optimizer, feed_dict={x: batch_x, y: batch_y, keep_prob: dropout})

            # Calculate batch loss and accuracy
            loss = sess.run(cost, feed_dict={x: batch_x, y: batch_y, keep_prob: 1.})
            valid_acc = sess.run(accuracy, feed_dict={
                x: mnist.validation.images[:test_valid_size],
                y: mnist.validation.labels[:test_valid_size],
                keep_prob: 1.}) #we want to keep all nodes while training so keep prob is 1.

            print('Epoch {:>2}, Batch {:>3} - Loss: {:>10.4f} Validation Accuracy: {:.6f}'.format(
                epoch + 1,
                batch + 1,
                loss,
                valid_acc))

    # Calculate Test Accuracy
    test_acc = sess.run(accuracy, feed_dict={
        x: mnist.test.images[:test_valid_size],
        y: mnist.test.labels[:test_valid_size],
        keep_prob: 1.})
    print('Testing Accuracy: {}'.format(test_acc))


Language Detecting with sklearn by determining Letter Frequencies

Of course, there are better and more efficient methods to detect the language of a given text than counting its lettes. On the other hand this is a interesting little example to show the impressing ability of todays machine learning algorithms to detect hidden patterns in a given set of data.

For example take the sentence:

“Ceci est une phrase française.”

It’s not to hard to figure out that this sentence is french. But the (lowercase) letters of the same sentence in a random order look like this:

“eeasrsçneticuaicfhenrpaes”

Still sure it’s french? Regarding the fact that this string contains the letter “ç” some people could have remembered long passed french lessons back in school and though might have guessed right. But beside the fact that the french letter “ç” is also present for example in portuguese, turkish, catalan and a few other languages, this is still a easy example just to explain the problem. Just try to guess which language might have generated this:

“ogldviisnntmeyoiiesettpetorotrcitglloeleiengehorntsnraviedeenltseaecithooheinsnstiofwtoienaoaeefiitaeeauobmeeetdmsflteightnttxipecnlgtetgteyhatncdisaceahrfomseehmsindrlttdthoaranthahdgasaebeaturoehtrnnanftxndaeeiposttmnhgttagtsheitistrrcudf”

While this looks simply confusing to the human eye and it seems practically impossible to determine the language it was generated from, this string still contains as set of hidden but well defined patterns from which the language could be predictet with almost complete (ca. 98-99%) certainty.

First of all, we need a set of texts in the languages our model should be able to recognise. Luckily with the package NLTK there comes a big set of example texts which actually are protocolls of the european parliament and therefor are publicly availible in 11 differen languages:

  •  Danish
  •  Dutch
  •  English
  •  Finnish
  •  French
  •  German
  •  Greek
  •  Italian
  •  Portuguese
  •  Spanish
  •  Swedish

Because the greek version is not written with the latin alphabet, the detection of the language greek would just be too simple, so we stay with the other 10 languages availible. To give you a idea of the used texts, here is a little sample:

“Resumption of the session I declare resumed the session of the European Parliament adjourned on Friday 17 December 1999, and I would like once again to wish you a happy new year in the hope that you enjoyed a pleasant festive period.
Although, as you will have seen, the dreaded ‘millennium bug’ failed to materialise, still the people in a number of countries suffered a series of natural disasters that truly were dreadful.”

Train and Test

The following code imports the nessesary modules and reads the sample texts from a set of text files into a pandas.Dataframe object and prints some statistics about the read texts:

from pathlib import Path
import random
from collections import Counter, defaultdict
import numpy as np
import pandas as pd
from sklearn.neighbors import *
from matplotlib import pyplot as plt
from mpl_toolkits import mplot3d
%matplotlib inline


def read(file):
    '''Returns contents of a file'''
    with open(file, 'r', errors='ignore') as f:
        text = f.read()
    return text

def load_eu_texts():
    '''Read texts snipplets in 10 different languages into pd.Dataframe

    load_eu_texts() -> pd.Dataframe
    
    The text snipplets are taken from the nltk-data corpus.
    '''
    basepath = Path('/home/my_username/nltk_data/corpora/europarl_raw/langs/')
    df = pd.DataFrame(columns=['text', 'lang', 'len'])
    languages = [None]
    for lang in basepath.iterdir():
        languages.append(lang.as_posix())
        t = '\n'.join([read(p) for p in lang.glob('*')])
        d = pd.DataFrame()
        d['text'] = ''
        d['text'] = pd.Series(t.split('\n'))
        d['lang'] = lang.name.title()
        df = df.append(d.copy(), ignore_index=True)
    return df

def clean_eutextdf(df):
    '''Preprocesses the texts by doing a set of cleaning steps
    
    clean_eutextdf(df) -> cleaned_df
    '''
    # Cuts of whitespaces a the beginning and and
    df['text'] = [i.strip() for i in df['text']]
    # Generate a lowercase Version of the text column
    df['ltext'] = [i.lower() for i in df['text']]

    # Determining the length of each text
    df['len'] = [len(i) for i in df['text']]
    # Drops all texts that are not at least 200 chars long
    df = df.loc[df['len'] > 200]
    return df

# Execute the above functions to load the texts
df = clean_eutextdf(load_eu_texts())

# Print a few stats of the read texts
textline = 'Number of text snippplets: ' + str(df.shape[0])
print('\n' + textline + '\n' + ''.join(['_' for i in range(len(textline))]))
c = Counter(df['lang'])
for l in c.most_common():
    print('%-25s' % l[0] + str(l[1]))
df.sample(10)
Number of text snippplets: 56481
________________________________
French                   6466
German                   6401
Italian                  6383
Portuguese               6147
Spanish                  6016
Finnish                  5597
Swedish                  4940
Danish                   4914
Dutch                    4826
English                  4791
lang	len	text	ltext
135233	Finnish	346	Vastustan sitä , toisin kuin tämän parlamentin...	vastustan sitä , toisin kuin tämän parlamentin...
170400	Danish	243	Desuden ødelægger det centraliserede europæisk...	desuden ødelægger det centraliserede europæisk...
85466	Italian	220	In primo luogo , gli accordi di Sharm el-Sheik...	in primo luogo , gli accordi di sharm el-sheik...
15926	French	389	Pour ce qui est concrètement du barrage de Ili...	pour ce qui est concrètement du barrage de ili...
195321	English	204	Discretionary powers for national supervisory ...	discretionary powers for national supervisory ...
160557	Danish	304	Det er de spørgmål , som de lande , der udgør ...	det er de spørgmål , som de lande , der udgør ...
196310	English	355	What remains of the concept of what a company ...	what remains of the concept of what a company ...
110163	Portuguese	327	Actualmente , é do conhecimento dos senhores d...	actualmente , é do conhecimento dos senhores d...
151681	Danish	203	Dette er vigtigt for den tillid , som samfunde...	dette er vigtigt for den tillid , som samfunde...
200540	English	257	Therefore , according to proponents , such as ...	therefore , according to proponents , such as ...

Above you see a sample set of random rows of the created Dataframe. After removing very short text snipplets (less than 200 chars) we are left with 56481 snipplets. The function clean_eutextdf() then creates a lower case representation of the texts in the coloum ‘ltext’ to facilitate counting the chars in the next step.
The following code snipplet now extracs the features – in this case the relative frequency of each letter in every text snipplet – that are used for prediction:

def calc_charratios(df):
    '''Calculating ratio of any (alphabetical) char in any text of df for each lyric
    
    calc_charratios(df) -> list, pd.Dataframe
    '''
    CHARS = ''.join({c for c in ''.join(df['ltext']) if c.isalpha()})
    print('Counting Chars:')
    for c in CHARS:
        print(c, end=' ')
        df[c] = [r.count(c) for r in df['ltext']] / df['len']
    return list(CHARS), df

features, df = calc_charratios(df)

Now that we have calculated the features for every text snipplet in our dataset, we can split our data set in a train and test set:

def split_dataset(df, ratio=0.5):
    '''Split the dataset into a train and a test dataset
    
    split_dataset(featuredf, ratio) -> pd.Dataframe, pd.Dataframe
    '''
    df = df.sample(frac=1).reset_index(drop=True)
    traindf = df[:][:int(df.shape[0] * ratio)]
    testdf = df[:][int(df.shape[0] * ratio):]
    return traindf, testdf

featuredf = pd.DataFrame()
featuredf['lang'] = df['lang']
for feature in features:
    featuredf[feature] = df[feature]
traindf, testdf = split_dataset(featuredf, ratio=0.80)

x = np.array([np.array(row[1:]) for index, row in traindf.iterrows()])
y = np.array([l for l in traindf['lang']])
X = np.array([np.array(row[1:]) for index, row in testdf.iterrows()])
Y = np.array([l for l in testdf['lang']])

After doing that, we can train a k-nearest-neigbours classifier and test it to get the percentage of correctly predicted languages in the test data set. Because we do not know what value for k may be the best choice, we just run the training and testing with different values for k in a for loop:

def train_knn(x, y, k):
    '''Returns the trained k nearest neighbors classifier
    
    train_knn(x, y, k) -> sklearn.neighbors.KNeighborsClassifier
    '''
    clf = KNeighborsClassifier(k)
    clf.fit(x, y)
    return clf

def test_knn(clf, X, Y):
    '''Tests a given classifier with a testset and return result
    
    text_knn(clf, X, Y) -> float
    '''
    predictions = clf.predict(X)
    ratio_correct = len([i for i in range(len(Y)) if Y[i] == predictions[i]]) / len(Y)
    return ratio_correct

print('''k\tPercentage of correctly predicted language
__________________________________________________''')
for i in range(1, 16):
    clf = train_knn(x, y, i)
    ratio_correct = test_knn(clf, X, Y)
    print(str(i) + '\t' + str(round(ratio_correct * 100, 3)) + '%')
k	Percentage of correctly predicted language
__________________________________________________
1	97.548%
2	97.38%
3	98.256%
4	98.132%
5	98.221%
6	98.203%
7	98.327%
8	98.247%
9	98.371%
10	98.345%
11	98.327%
12	98.3%
13	98.256%
14	98.274%
15	98.309%

As you can see in the output the reliability of the language classifier is generally very high: It starts at about 97.5% for k = 1, increases for with increasing values of k until it reaches a maximum level of about 98.5% at k ≈ 10.

Using the Classifier to predict languages of texts

Now that we have trained and tested the classifier we want to use it to predict the language of example texts. To do that we need two more functions, shown in the following piece of code. The first one extracts the nessesary features from the sample text and predict_lang() predicts the language of a the texts:

def extract_features(text, features):
    '''Extracts all alphabetic characters and add their ratios as feature
    
    extract_features(text, features) -> np.array
    '''
    textlen = len(text)
    ratios = []
    text = text.lower()
    for feature in features:
        ratios.append(text.count(feature) / textlen)
    return np.array(ratios)

def predict_lang(text, clf=clf):
    '''Predicts the language of a given text and classifier
    
    predict_lang(text, clf) -> str
    '''
    extracted_features = extract_features(text, features)
    return clf.predict(np.array(np.array([extracted_features])))[0]

text_sample = df.sample(10)['text']

for example_text in text_sample:
    print('%-20s'  % predict_lang(example_text, clf) + '\t' + example_text[:60] + '...')
Italian             	Auspico che i progetti riguardanti i programmi possano contr...
English             	When that time comes , when we have used up all our resource...
Portuguese          	Creio que o Parlamento protesta muitas vezes contra este mét...
Spanish             	Sobre la base de esta posición , me parece que se puede enco...
Dutch               	Ik voel mij daardoor aangemoedigd omdat ik een brede consens...
Spanish             	Señor Presidente , Señorías , antes que nada , quisiera pron...
Italian             	Ricordo altresì , signora Presidente , che durante la preced...
Swedish             	Betänkande ( A5-0107 / 1999 ) av Berend för utskottet för re...
English             	This responsibility cannot only be borne by the Commissioner...
Portuguese          	A nossa leitura comum é que esse partido tem uma posição man...

With this classifier it is now also possible to predict the language of the randomized example snipplet from the introduction (which is acutally created from the first paragraph of this article):

example_text = "ogldviisnntmeyoiiesettpetorotrcitglloeleiengehorntsnraviedeenltseaecithooheinsnstiofwtoienaoaeefiitaeeauobmeeetdmsflteightnttxipecnlgtetgteyhatncdisaceahrfomseehmsindrlttdthoaranthahdgasaebeaturoehtrnnanftxndaeeiposttmnhgttagtsheitistrrcudf"
predict_lang(example_text)
'English'

The KNN classifier of sklearn also offers the possibility to predict the propability with which a given classification is made. While the probability distribution for a specific language is relativly clear for long sample texts it decreases noticeably the shorter the texts are.

def dict_invert(dictionary):
    ''' Inverts keys and values of a dictionary
    
    dict_invert(dictionary) -> collections.defaultdict(list)
    '''
    inverse_dict = defaultdict(list)
    for key, value in dictionary.items():
        inverse_dict[value].append(key)
    return inverse_dict

def get_propabilities(text, features=features):
    '''Prints the probability for every language of a given text
    
    get_propabilities(text, features)
    '''
    results = clf.predict_proba(extract_features(text, features=features).reshape(1, -1))
    for result in zip(clf.classes_, results[0]):
        print('%-20s' % result[0] + '%7s %%' % str(round(float(100 * result[1]), 4)))


example_text = 'ogldviisnntmeyoiiesettpetorotrcitglloeleiengehorntsnraviedeenltseaecithooheinsnstiofwtoienaoaeefiitaeeauobmeeetdmsflteightnttxipecnlgtetgteyhatncdisaceahrfomseehmsindrlttdthoaranthahdgasaebeaturoehtrnnanftxndaeeiposttmnhgttagtsheitistrrcudf'
print(example_text)
get_propabilities(example_text + '\n')
print('\n')
example_text2 = 'Dies ist ein kurzer Beispielsatz.'
print(example_text2)
get_propabilities(example_text2 + '\n')
ogldviisnntmeyoiiesettpetorotrcitglloeleiengehorntsnraviedeenltseaecithooheinsnstiofwtoienaoaeefiitaeeauobmeeetdmsflteightnttxipecnlgtetgteyhatncdisaceahrfomseehmsindrlttdthoaranthahdgasaebeaturoehtrnnanftxndaeeiposttmnhgttagtsheitistrrcudf
Danish                  0.0 %
Dutch                   0.0 %
English               100.0 %
Finnish                 0.0 %
French                  0.0 %
German                  0.0 %
Italian                 0.0 %
Portuguese              0.0 %
Spanish                 0.0 %
Swedish                 0.0 %


Dies ist ein kurzer Beispielsatz.
Danish                  0.0 %
Dutch                   0.0 %
English                 0.0 %
Finnish                 0.0 %
French              18.1818 %
German              72.7273 %
Italian              9.0909 %
Portuguese              0.0 %
Spanish                 0.0 %
Swedish                 0.0 %

Background and Insights

Why does a relative simple model like counting letters acutally work? Every language has a specific pattern of letter frequencies which can be used as a kind of fingerprint: While there are almost no y‘s in the german language this letter is quite common in english. In french the letter k is not very common because it is replaced with q in most cases.

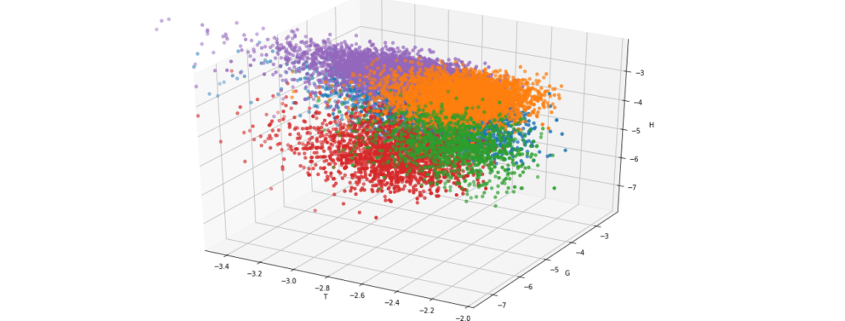
For a better understanding look at the output of the following code snipplet where only three letters already lead to a noticable form of clustering:

projection='3d')
legend = []
X, Y, Z = 'e', 'g', 'h'

def iterlog(ln):
    retvals = []
    for n in ln:
        try:
            retvals.append(np.log(n))
        except:
            retvals.append(None)
    return retvals

for X in ['t']:
    ax = plt.axes(projection='3d')
    ax.xy_viewLim.intervalx = [-3.5, -2]
    legend = []
    for lang in [l for l in df.groupby('lang') if l[0] in {'German', 'English', 'Finnish', 'French', 'Danish'}]:
        sample = lang[1].sample(4000)

        legend.append(lang[0])
        ax.scatter3D(iterlog(sample[X]), iterlog(sample[Y]), iterlog(sample[Z]))

    ax.set_title('log(10) of the Relativ Frequencies of "' + X.upper() + "', '" + Y.upper() + '" and "' + Z.upper() + '"\n\n')
    ax.set_xlabel(X.upper())
    ax.set_ylabel(Y.upper())
    ax.set_zlabel(Z.upper())
    plt.legend(legend)
    plt.show()
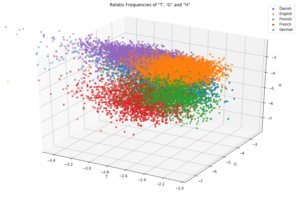
 

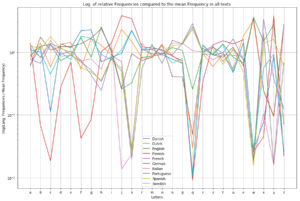
Even though every single letter frequency by itself is not a very reliable indicator, the set of frequencies of all present letters in a text is a quite good evidence because it will more or less represent the letter frequency fingerprint of the given language. Since it is quite hard to imagine or visualize the above plot in more than three dimensions, I used a little trick which shows that every language has its own typical fingerprint of letter frequencies:

legend = []
fig = plt.figure(figsize=(15, 10))
plt.axes(yscale='log')
    
langs = defaultdict(list)

for lang in [l for l in df.groupby('lang') if l[0] in set(df['lang'])]:
    for feature in 'abcdefghijklmnopqrstuvwxyz':
        langs[lang[0]].append(lang[1][feature].mean())

mean_frequencies = {feature:df[feature].mean() for feature in 'abcdefghijklmnopqrstuvwxyz'}
for i in langs.items():
    legend.append(i[0])
    j = np.array(i[1]) / np.array([mean_frequencies[c] for c in 'abcdefghijklmnopqrstuvwxyz'])
    plt.plot([c for c in 'abcdefghijklmnopqrstuvwxyz'], j)
plt.title('Log. of relative Frequencies compared to the mean Frequency in all texts')
plt.xlabel('Letters')
plt.ylabel('(log(Lang. Frequencies / Mean Frequency)')
plt.legend(legend)
plt.grid()
plt.show()
What more?

Beside the fact, that letter frequencies alone, allow us to predict the language of every example text (at least in the 10 languages with latin alphabet we trained for) with almost complete certancy there is even more information hidden in the set of sample texts.

As you might know, most languages in europe belong to either the romanian or the indogermanic language family (which is actually because the romans conquered only half of europe). The border between them could be located in belgium, between france and germany and in swiss. West of this border the romanian languages, which originate from latin, are still spoken, like spanish, portouguese and french. In the middle and northern part of europe the indogermanic languages are very common like german, dutch, swedish ect. If we plot the analysed languages with a different colour sheme this border gets quite clear and allows us to take a look back in history that tells us where our languages originate from:

legend = []
fig = plt.figure(figsize=(15, 10))
plt.axes(yscale='linear')
    
langs = defaultdict(list)
for lang in [l for l in df.groupby('lang') if l[0] in {'German', 'English', 'French', 'Spanish', 'Portuguese', 'Dutch', 'Swedish', 'Danish', 'Italian'}]:
    for feature in 'abcdefghijklmnopqrstuvwxyz':
        langs[lang[0]].append(lang[1][feature].mean())

colordict = {l[0]:l[1] for l in zip([lang for lang in langs], ['brown', 'tomato', 'orangered',
                                                               'green', 'red', 'forestgreen', 'limegreen',
                                                               'darkgreen', 'darkred'])}
mean_frequencies = {feature:df[feature].mean() for feature in 'abcdefghijklmnopqrstuvwxyz'}
for i in langs.items():
    legend.append(i[0])
    j = np.array(i[1]) / np.array([mean_frequencies[c] for c in 'abcdefghijklmnopqrstuvwxyz'])
    plt.plot([c for c in 'abcdefghijklmnopqrstuvwxyz'], j, color=colordict[i[0]])
#     plt.plot([c for c in 'abcdefghijklmnopqrstuvwxyz'], i[1], color=colordict[i[0]])
plt.title('Log. of relative Frequencies compared to the mean Frequency in all texts')
plt.xlabel('Letters')
plt.ylabel('(log(Lang. Frequencies / Mean Frequency)')
plt.legend(legend)
plt.grid()
plt.show()
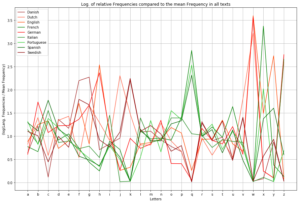
As you can see the more common letters, especially the vocals like a, e, i, o and u have almost the same frequency in all of this languages. Far more interesting are letters like q, k, c and w: While k is quite common in all of the indogermanic languages it is quite rare in romanic languages because the same sound is written with the letters q or c.
As a result it could be said, that even “boring” sets of data (just give it a try and read all the texts of the protocolls of the EU parliament…) could contain quite interesting patterns which – in this case – allows us to predict quite precisely which language a given text sample is written in, without the need of any translation program or to speak the languages. And as an interesting side effect, where certain things in history happend (or not happend): After two thousand years have passed, modern machine learning techniques could easily uncover this history because even though all these different languages developed, they still have a set of hidden but common patterns that since than stayed the same.

How To Remotely Send R and Python Execution to SQL Server from Jupyter Notebooks

Introduction

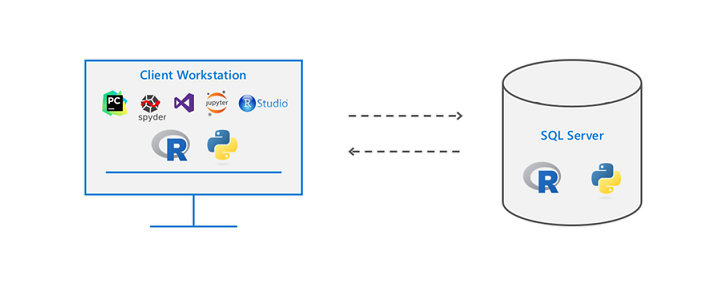
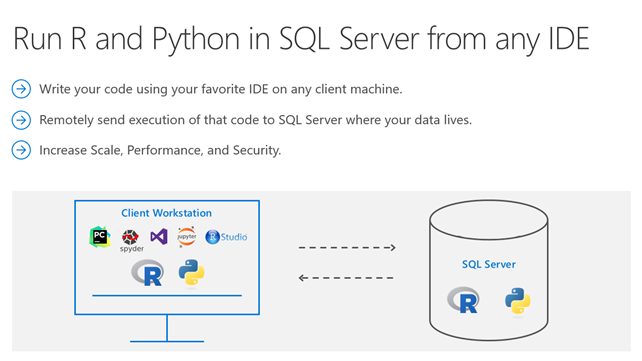
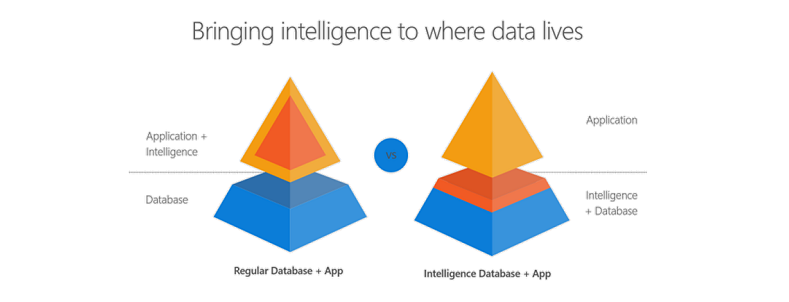
Did you know that you can execute R and Python code remotely in SQL Server from Jupyter Notebooks or any IDE? Machine Learning Services in SQL Server eliminates the need to move data around. Instead of transferring large and sensitive data over the network or losing accuracy on ML training with sample csv files, you can have your R/Python code execute within your database. You can work in Jupyter Notebooks, RStudio, PyCharm, VSCode, Visual Studio, wherever you want, and then send function execution to SQL Server bringing intelligence to where your data lives.

This tutorial will show you an example of how you can send your python code from Juptyter notebooks to execute within SQL Server. The same principles apply to R and any other IDE as well. If you prefer to learn through videos, this tutorial is also published on YouTube here:


Environment Setup Prerequisites

  1. Install ML Services on SQL Server

In order for R or Python to execute within SQL, you first need the Machine Learning Services feature installed and configured. See this how-to guide.

  1. Install RevoscalePy via Microsoft’s Python Client

In order to send Python execution to SQL from Jupyter Notebooks, you need to use Microsoft’s RevoscalePy package. To get RevoscalePy, download and install Microsoft’s ML Services Python Client. Documentation Page or Direct Download Link (for Windows).

After downloading, open powershell as an administrator and navigate to the download folder. Start the installation with this command (feel free to customize the install folder): .\Install-PyForMLS.ps1 -InstallFolder “C:\Program Files\MicrosoftPythonClient”

Be patient while the installation can take a little while. Once installed navigate to the new path you installed in. Let’s make an empty folder and open Jupyter Notebooks: mkdir JupyterNotebooks; cd JupyterNotebooks; ..\Scripts\jupyter-notebook

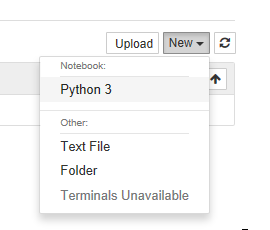
Create a new notebook with the Python 3 interpreter:


To test if everything is setup, import revoscalepy in the first cell and execute. If there are no error messages you are ready to move forward.

Database Setup (Required for this tutorial only)

For the rest of the tutorial you can clone this Jupyter Notebook from Github if you don’t want to copy paste all of the code. This database setup is a one time step to ensure you have the same data as this tutorial. You don’t need to perform any of these setup steps to use your own data.

  1. Create a database

Modify the connection string for your server and use pyodbc to create a new database.

import pyodbc  
# creating a new db to load Iris sample in 
new_db_name = "MLRemoteExec" connection_string = "Driver=SQL Server;Server=localhost\MSSQLSERVER2017;Database={0};Trusted_Connection=Yes;" 

cnxn = pyodbc.connect(connection_string.format("master"), autocommit=True) 

cnxn.cursor().execute("IF EXISTS(SELECT * FROM sys.databases WHERE [name] = '{0}') DROP DATABASE {0}".format(new_db_name)) 

cnxn.cursor().execute("CREATE DATABASE " + new_db_name)

cnxn.close()

print("Database created") 
  1. Import Iris sample from SkLearn

Iris is a popular dataset for beginner data science tutorials. It is included by default in sklearn package.

from sklearn import datasetsimport pandas as pd
# SkLearn has the Iris sample dataset built in to the packageiris = datasets.load_iris()
df = pd.DataFrame(iris.data, columns=iris.feature_names)
  1. Use RecoscalePy APIs to create a table and load the Iris data

(You can also do this with pyodbc, sqlalchemy or other packages)

from revoscalepy import RxSqlServerData, rx_data_step
# Example of using RX APIs to load data into SQL table. You can also do this with pyodbc
table_ref = RxSqlServerData(connection_string=connection_string.format(new_db_name), table="Iris")rx_data_step(input_data = df, output_file = table_ref, overwrite = True)print("New Table Created: Iris")
print("Sklearn Iris sample loaded into Iris table")

Define a Function to Send to SQL Server

Write any python code you want to execute in SQL. In this example we are creating a scatter matrix on the iris dataset and only returning the bytestream of the .png back to Jupyter Notebooks to render on our client.

def send_this_func_to_sql():
    from revoscalepy import RxSqlServerData, rx_import
    from pandas.tools.plotting import scatter_matrix
    import matplotlib.pyplot as plt
    import io    
# remember the scope of the variables in this func are within our SQL Server Python Runtime
    connection_string = "Driver=SQL Server;Server=localhost\MSSQLSERVER2017; Database=MLRemoteExec;Trusted_Connection=Yes;"

# specify a query and load into pandas dataframe df
    sql_query = RxSqlServerData(connection_string=connection_string, sql_query = "select * from Iris")

    df = rx_import(sql_query)
    scatter_matrix(df)

# return bytestream of image created by scatter_matrix
    buf = io.BytesIO()
    plt.savefig(buf, format="png")
    buf.seek(0)
    return buf.getvalue()

Send execution to SQL

Now that we are finally set up, check out how easy sending remote execution really is! First, import revoscalepy. Create a sql_compute_context, and then send the execution of any function seamlessly to SQL Server with RxExec. No raw data had to be transferred from SQL to the Jupyter Notebook. All computation happened within the database and only the image file was returned to be displayed.

from IPython import display
import matplotlib.pyplot as plt 
from revoscalepy import RxInSqlServer, rx_exec# create a remote compute context with connection to SQL Server

sql_compute_context = RxInSqlServer(connection_string=connection_string.format(new_db_name))

# use rx_exec to send the function execution to SQL Server

image = rx_exec(send_this_func_to_sql, compute_context=sql_compute_context)[0]

# only an image was returned to my jupyter client. All data remained secure and was manipulated in my db.

display.Image(data=image)

While this example is trivial with the Iris dataset, imagine the additional scale, performance, and security capabilities that you now unlocked. You can use any of the latest open source R/Python packages to build Deep Learning and AI applications on large amounts of data in SQL Server. We also offer leading edge, high-performance algorithms in Microsoft’s RevoScaleR and RevoScalePy APIs. Using these with the latest innovations in the open source world allows you to bring unparalleled selection, performance, and scale to your applications.

Learn More

Check out SQL Machine Learning Services Documentation to learn how you can easily deploy your R/Python code with SQL stored procedures making them accessible in your ETL processes or to any application. Train and store machine learning models in your database bringing intelligence to where your data lives.

Other YouTube Tutorials:

Bringing intelligence to where data lives: Python & R embedded in T-SQL

Introduction

Did you know that you can write R and Python code within your T-SQL statements? Machine Learning Services in SQL Server eliminates the need for data movement. Instead of transferring large and sensitive data over the network or losing accuracy with sample csv files, you can have your R/Python code execute within your database. Easily deploy your R/Python code with SQL stored procedures making them accessible in your ETL processes or to any application. Train and store machine learning models in your database bringing intelligence to where your data lives.

You can install and run any of the latest open source R/Python packages to build Deep Learning and AI applications on large amounts of data in SQL Server. We also offer leading edge, high-performance algorithms in Microsoft’s RevoScaleR and RevoScalePy APIs. Using these with the latest innovations in the open source world allows you to bring unparalleled selection, performance, and scale to your applications.

If you are excited to try out SQL Server Machine Learning Services, check out the hands on tutorial below. If you do not have Machine Learning Services installed in SQL Server,you will first want to follow the getting started tutorial I published here: 

How-To Tutorial

In this tutorial, I will cover the basics of how to Execute R and Python in T-SQL statements. If you prefer learning through videos, I also published the tutorial on YouTube.

Basics

Open up SQL Server Management Studio and make a connection to your server. Open a new query and paste this basic example: (While I use Python in these samples, you can do everything with R as well)

EXEC sp_execute_external_script @language = N'Python',
@script = N'print(3+4)'

Sp_execute_external_script is a special system stored procedure that enables R and Python execution in SQL Server. There is a “language” parameter that allows us to choose between Python and R. There is a “script” parameter where we can paste R or Python code. If you do not see an output print 7, go back and review the setup steps in this article.

Parameter Introduction

Now that we discussed a basic example, let’s start adding more pieces:

EXEC sp_execute_external_script  @language =N'Python', 
@script = N' 
OutputDataSet = InputDataSet;
',
@input_data_1 =N'SELECT 1 AS Col1';

Machine Learning Services provides more natural communications between SQL and R/Python with an input data parameter that accepts any SQL query. The input parameter name is called “input_data_1”.
You can see in the python code that there are default variables defined to pass data between Python and SQL. The default variable names are “OutputDataSet” and “InputDataSet” You can change these default names like this example:

EXEC sp_execute_external_script  @language =N'Python', 
@script = N' 
MyOutput = MyInput;
',
@input_data_1_name = N'MyInput',
@input_data_1 =N'SELECT 1 AS foo',
@output_data_1_name =N'MyOutput';

As you executed these examples, you might have noticed that they each return a result with “(No column name)”? You can specify a name for the columns that are returned by adding the WITH RESULT SETS clause to the end of the statement which is a comma separated list of columns and their datatypes.

EXEC sp_execute_external_script  @language =N'Python', 
@script=N' 
MyOutput = MyInput;
',
@input_data_1_name = N'MyInput',
@input_data_1 =N'
SELECT 1 AS foo,
2 AS bar
',
@output_data_1_name =N'MyOutput'
WITH RESULT SETS ((MyColName int, MyColName2 int));

Input/Output Data Types

Alright, let’s discuss a little more about the input/output data types used between SQL and Python. Your input SQL SELECT statement passes a “Dataframe” to python relying on the Python Pandas package. Your output from Python back to SQL also needs to be in a Pandas Dataframe object. If you need to convert scalar values into a dataframe here is an example:

EXEC sp_execute_external_script  @language =N'Python', 
@script=N' 
import pandas as pd
c = 1/2
d = 1*2
s = pd.Series([c,d])
df = pd.DataFrame(s)
OutputDataSet = df
'

Variables c and d are both scalar values, which you can add to a pandas Series if you like, and then convert them to a pandas dataframe. This one shows a little bit more complicated example, go read up on the python pandas package documentation for more details and examples:
EXEC sp_execute_external_script  @language =N'Python', 
@script=N' 
import pandas as pd
s = {"col1": [1, 2], "col2": [3, 4]}
df = pd.DataFrame(s)
OutputDataSet = df
'

You now know the basics to execute Python in T-SQL!

Did you know you can also write your R and Python code in your favorite IDE like RStudio and Jupyter Notebooks and then remotely send the execution of that code to SQL Server? Check out these documentation links to learn more: https://aka.ms/R-RemoteSQLExecution https://aka.ms/PythonRemoteSQLExecution

Check out the SQL Server Machine Learning Services documentation page for more documentation, samples, and solutions. Check out these E2E tutorials on github as well.

Would love to hear from you! Leave a comment below to ask a question, or start a discussion!

Statistical Relational Learning – Part 2

In the first part of this series onAn Introduction to Statistical Relational Learning”, I touched upon the basic Machine Learning paradigms, some background and intuition of the concepts and concluded with how the MLN template looks like. In this blog, we will dive in to get an in depth knowledge on the MLN template; again with the help of sample examples. I would then conclude by highlighting the various toolkit available and some of its differentiating features.
MLN Template – explained

A Markov logic network can be thought of as a group of formulas incorporating first-order logic and also tied with a weight. But what exactly does this weight signify?

Weight Learning

According to the definition, it is the log odds between a world where F is true and a world where F is false,

and captures the marginal distribution of the corresponding predicate.

Each formula can be associated with some weight value, that is a positive or negative real number. The higher the value of weight, the stronger the constraint represented by the formula. In contrast to classical logic, all worlds (i.e., Herbrand Interpretations) are possible with a certain probability [1]. The main idea behind this is that the probability of a world increases as the number of formulas it violates decreases.

Markov logic networks with its probabilistic approach combined to logic posit that a world is less likely if it violates formulas unlike in pure logic where a world is false if it violates even a single formula. Consider the case when a formula with high weight i.e. more significance is violated implying that it is less likely in occurrence.

Another important concept during the first phase of Weight Learning while applying an MLN template is “Grounding”. Grounding means to replace each variable/function in predicate with constants from the domain.

Weight Learning – An Example

Note: All examples are highlighted in the Alchemy MLN format

Let us consider an example where we want to identify the relationship between 2 different types of verb-noun pairs i.e noun subject and direct object.

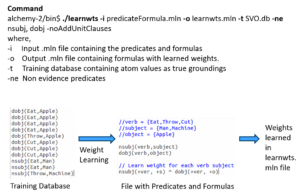
The input predicateFormula.mln file contains

  1. The predicates nsubj(verb, subject) and dobj(verb, object) and
  2. Formula of nsubj(+ver, +s) and dobj(+ver, +o)

These predicates or rules are to learn all possible SVO combinations i.e. what is the probability of a Subject-Verb-Object combination. The + sign ensures a cross product between the domains and learns all combinations. The training database consists of the nsubj and dobj tuples i.e. relations is the evidence used to learn the weights.

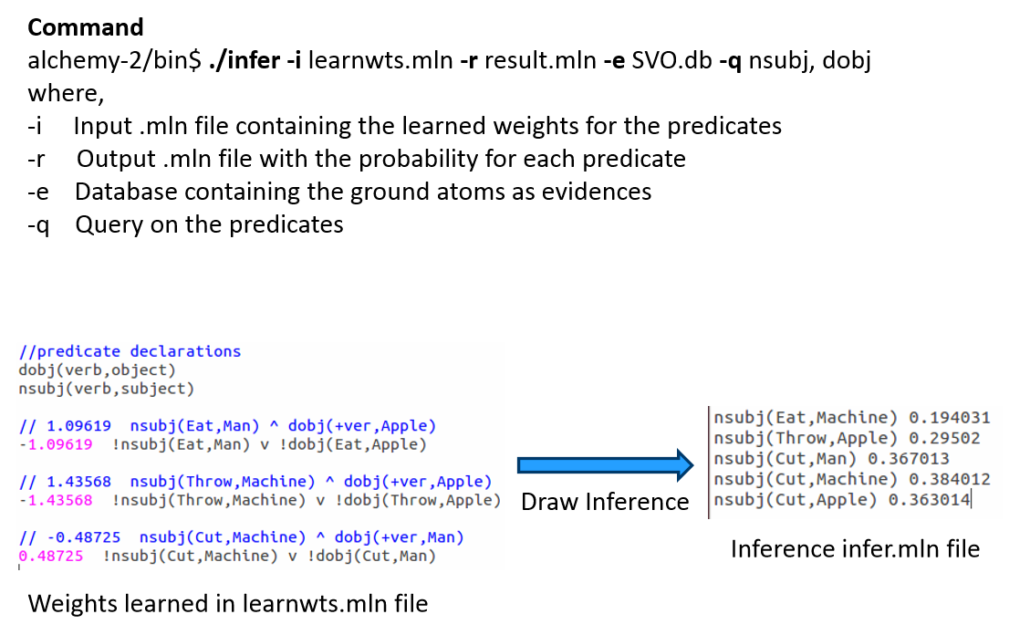
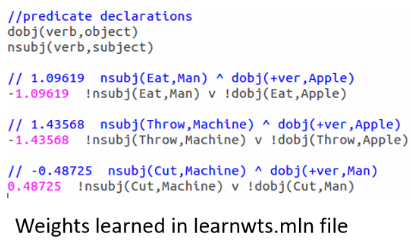
When we run the above command for this set of rules against the training evidence, we learn the weights as here:

Note that the formula is now grounded by all occurrences of nsubj and dobj tuples from the training database or evidence and the weights are attached to it at the start of each such combination.

But it should be noted that there is no network yet and this is just a set of weighted first-order logic formulas. The MLN template we created so far will generate Markov networks from all of our ground formulas. Internally, it is represented as a factor graph.where each ground formula is a factor and all the ground predicates found in the ground formula are linked to the factor.

Inference

The definition goes as follows:

Estimate probability distribution encoded by a graphical model, for a given data (or observation).

Out of the many Inference algorithms, the two major ones are MAP & Marginal Inference. For example, in a MAP Inference we find the most likely state of world given evidence, where y is the query and x is the evidence.

which is in turn equivalent to this formula.

Another is the Marginal Inference which computes the conditional probability of query predicates, given some evidence. Some advanced inference algorithms are Loopy Belief Propagation, Walk-SAT, MC-SAT, etc.

The probability of a world is given by the weighted sum of all true groundings of a formula i under an exponential function, divided by the partition function Z i.e. equivalent to the sum of the values of all possible assignments. The partition function acts a normalization constant to get the probability values between 0 and 1.

Inference – An Example

Let us draw inference on the the same example as earlier.

After learning the weights we run inference (with or without partial evidence) and query the relations of interest (nsubj here), to get inferred values.

Tool-kits

Let’s look at some of the MLN tool-kits at disposal to do learning and large scale inference. I have tried to make an assorted list of all tools here and tried to highlight some of its main features & problems.

For example, BUGS i.e. Bayesian Logic uses a Swift Compiler but is Not relational! ProbLog has a Python wrapper and is based on Horn clauses but has No Learning feature. These tools were invented in the initial days, much before the present day MLN looks like.

ProbCog developed at Technical University of Munich (TUM) & the AI Lab at Bremen covers not just MLN but also Bayesian Logic Networks (BLNs), Bayesian Networks & ProLog. In fact, it is now GUI based. Thebeast gives a shell to analyze & inspect model feature weights & missing features.

Alchemy from University of Washington (UoW) was the 1st First Order (FO) probabilistic logic toolkit. RockIt from University of Mannheim has an online & rest based interface and uses only Conjunctive Normal Forms (CNF) i.e. And-Or format in its formulas.

Tuffy scales this up by using a Relational Database Management System (RDBMS) whereas Felix allows Large Scale inference! Elementary makes use of secondary storage and Deep Dive is the current state of the art. All of these tools are part of the HAZY project group at Stanford University.

Lastly, LoMRF i.e. Logical Markov Random Field (MRF) is Scala based and has a feature to analyse different hypothesis by comparing the difference in .mln files!


Hope you enjoyed the read. The content starts from basic concepts and ends up highlighting key tools. In the final part of this 3 part blog series I would explain an application scenario and highlight the active research and industry players. Any feedback as a comment below or through a message is more than welcome!

Back to Part I – Statistical Relational Learning

Additional Links:

[1] Knowledge base files in Logical Markov Random Fields (LoMRF)

[2] (still) nothing clever Posts categorized “Machine Learning” – Markov Logic Networks

[3] A gentle introduction to statistical relational learning: maths, code, and examples