Tag Archive for: Text Mining

Bag of Words: Convert text into vectors

In this blog, we will study about the model that represents and converts text to numbers i.e. the Bag of Words (BOW). The bag-of-words model has seen great success in solving problems which includes language modeling and document classification as it is simple to understand and implement.

After completing this particular blog, you all will have an overview of: What does the bag-of-words model mean by and why is its importance in representing text. How we can develop a bag-of-words model for a collection of documents. How to use the bag of words to prepare a vocabulary and deploy in a model using programming language.


The problem and its solution…

The biggest problem with modeling text is that it is unorganised, and most of the statistical algorithms, i.e., the machine learning and deep learning techniques prefer well defined numeric data. They cannot work with raw text directly, therefore we have to convert text into numbers.

Word embeddings are commonly used in many Natural Language Processing (NLP) tasks because they are found to be useful representations of words and often lead to better performance in the various tasks performed. A huge number of approaches exist in this regard, among which some of the most widely used are Bag of Words, Fasttext, TF-IDF, Glove and word2vec. For easy user implementation, several libraries exist, such as Scikit-Learn and NLTK, which can implement these techniques in one line of code. But it is important to understand the working principle behind these word embedding techniques. As already said before, in this blog, we see how to implement Bag of words and the best way to do so is to implement these techniques from scratch in Python . Before we start with coding, let’s try to understand the theory behind the model approach.

 Theory Behind Bag of Words Approach

In simple words, Bag of words can be defined as a Natural Language Processing technique used for text modelling or we can say that it is a method of feature extraction with text data from documents.  It involves mainly two things firstly, a vocabulary of known words and, then a measure of the presence of known words.

The process of converting NLP text into numbers is called vectorization in machine learning language.A lot of different ways are available in converting text into vectors which are:

Counting the number of times each word appears in a document, and Calculating the frequency that each word appears in a document out of all the words in the document.

Understanding using an example

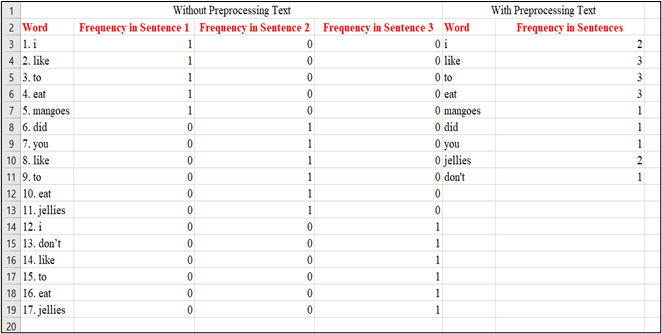
To understand the bag of words approach, let’s see how this technique converts text into vectors with the help of an example. Suppose we have a corpus with three sentences:

  1. “I like to eat mangoes”
  2. “Did you like to eat jellies?”
  3. “I don’t like to eat jellies”

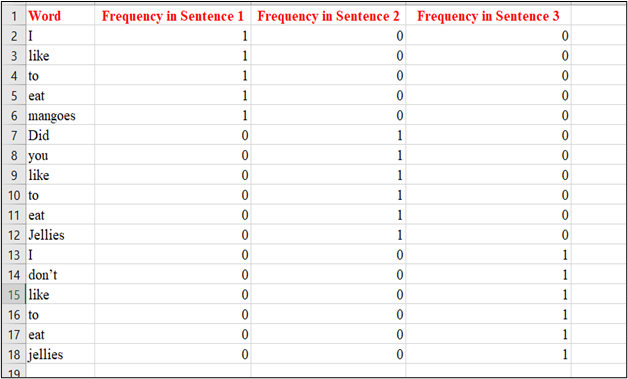
Step 1: Firstly, we go through all the words in the above three sentences and make a list of all of the words present in our model vocabulary.

  1. I
  2. like
  3. to
  4. eat
  5. mangoes
  6. Did
  7. you
  8. like
  9. to
  10. eat
  11. Jellies
  12. I
  13. don’t
  14. like
  15. to
  16. eat
  17. jellies

Step 2: Let’s find out the frequency of each word without preprocessing our text.

But is this not the best way to perform a bag of words. In the above example, the words Jellies and jellies are considered twice no doubt they hold the same meaning. So, let us make some changes and see how we can use ‘bag of words’ by preprocessing our text in a more effective way.

Step 3: Let’s find out the frequency of each word with preprocessing our text. Preprocessing is so very important because it brings our text into such a form that is easily understandable, predictable and analyzable for our task.

Firstly, we need to convert the above sentences into lowercase characters as case does not hold any information. Then it is very important to remove any special characters or punctuations if present in our document, or else it makes the conversion more messy.

From the above explanation, we can say the major advantage of Bag of Words is that it is very easy to understand and quite simple to implement in our datasets. But this approach has some disadvantages too such as:

  1. Bag of words leads to a high dimensional feature vector due to the large size of word vocabulary.
  2. Bag of words assumes all words are independent of each other ie’, it doesn’t leverage co-occurrence statistics between words.
  3. It leads to a highly sparse vector as there is nonzero value in dimensions corresponding to words that occur in the sentence.

Bag of Words Model in Python Programming

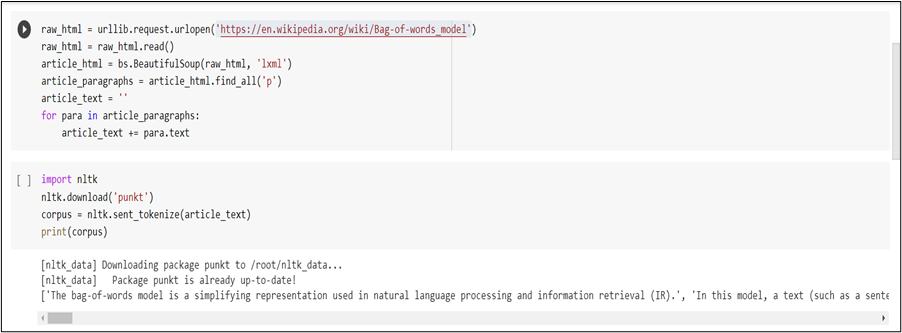
The first thing that we need to create is a proper dataset for implementing our Bag of Words model. In the above sections, we have manually created a bag of words model with three sentences. However, now we shall find a random corpus on Wikipedia such as ‘https://en.wikipedia.org/wiki/Bag-of-words_model‘.

Step 1: The very first step is to import the required libraries: nltk, numpy, random, string, bs4, urllib.request and re.

Step 2: Once we are done with importing the libraries, now we will be using the Beautifulsoup4 library to parse the data from Wikipedia.Along with that we shall be using Python’s regex library, re, for preprocessing tasks of our document. So, we will scrape the Wikipedia article on Bag of Words.

Step 3: As we can observe, in the above code snippet we have imported the raw HTML for the Wikipedia article from which we have filtered the text within the paragraph text and, finally,have created a complete corpus by merging up all the paragraphs.

Step 4: The very next step is to split the corpus into individual sentences by using the sent_tokenize function from the NLTK library.

Step 5: Our text contains a number of punctuations which are unnecessary for our word frequency dictionary. In the below code snippet, we will see how to convert our text into lower case and then remove all the punctuations from our text, which will result in multiple empty spaces which can be again removed using regex.

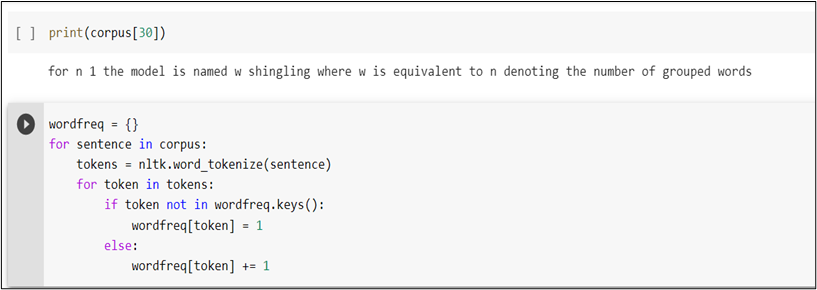
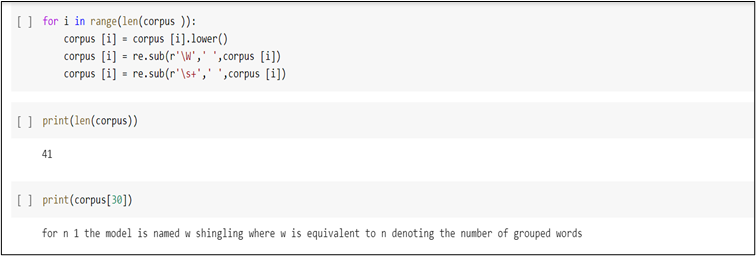
Step 6: Once the preprocessing is done, let’s find out the number of sentences present in our corpus and then, print one sentence from our corpus to see how it looks.

Step 7: We can observe that the text doesn’t contain any special character or multiple empty spaces, and so our own corpus is ready. The next step is to tokenize each sentence in the corpus and create a dictionary containing each word and their corresponding frequencies.

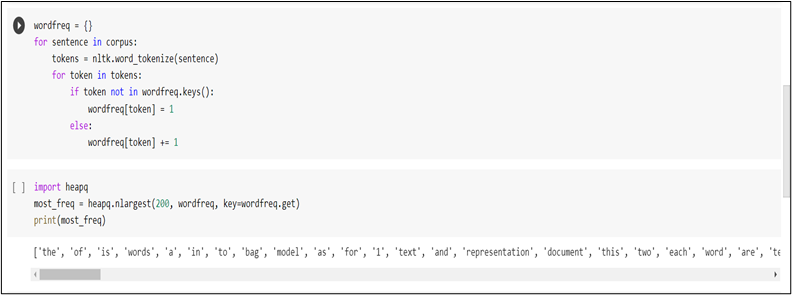
As you can see above, we have created a dictionary called wordfreq. Next, we iterate through each word in the sentence and check if it exists in the wordfreq dictionary.  On its existence,we will add the word as the key and set the value of the word as 1.

Step 8: Our corpus has more than 500 words in total and so we shall filter down to the 200 most frequently occurring words by using Python’s heap library.


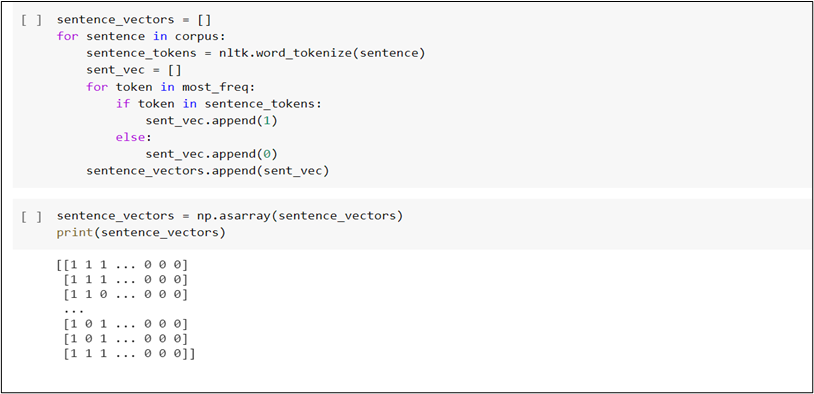
Step 9: Now, comes the final step of converting the sentences in our corpus into their corresponding vector representation. Let’s check the below code snippet to understand it. Our model is in the form of a list of lists which can be easily converted matrix form using this script:

On the difficulty of language: prerequisites for NLP with deep learning

1 Preface

This section is virtually just my essay on language. You can skip this if you want to get down on more technical topic.

As I do not study in natural language processing (NLP) field, I would not be able to provide that deep insight into this fast changing deep leaning field throughout my article series. However at least I do understand language is a difficult and profound field, not only in engineering but also in many other study fields. Some people might be feeling that technologies are eliminating languages, or one’s motivations to understand other cultures. First of all, I would like you to keep it in mind that I am not a geek who is trying to turn this multilingual world into a homogeneous one and rebuild Tower of Babel, with deep learning. I would say I am more keen on social or anthropological sides of language.

I think you would think more about languages if you have mastered at least one foreign language. As my mother tongue is Japanese, which is totally different from many other Western languages in terms of characters and ambiguity, I understand translating is not what learning a language is all about. Each language has unique characteristics, and I believe they more or less influence one’s personalities. For example, many Western languages make the verb, I mean the conclusion, of sentences clear in the beginning part of the sentences. That is also true of Chinese, I heard. However in Japanese, the conclusion comes at the end, so that is likely to give an impression that Japanese people are being obscure or indecisive. Also, Japanese sentences usually omit their subjects. In German as well, the conclusion of a sentences tend to come at the end, but I am almost 100% sure that no Japanese people would feel German people make things unclear. I think that comes from the structures of German language, which tends to make the number, verb, relations of words crystal clear.

Let’s take an example to see how obscure Japanese is. A Japanese sentence 「頭が赤い魚を食べる猫」can be interpreted in five ways, depending on where you put emphases on.
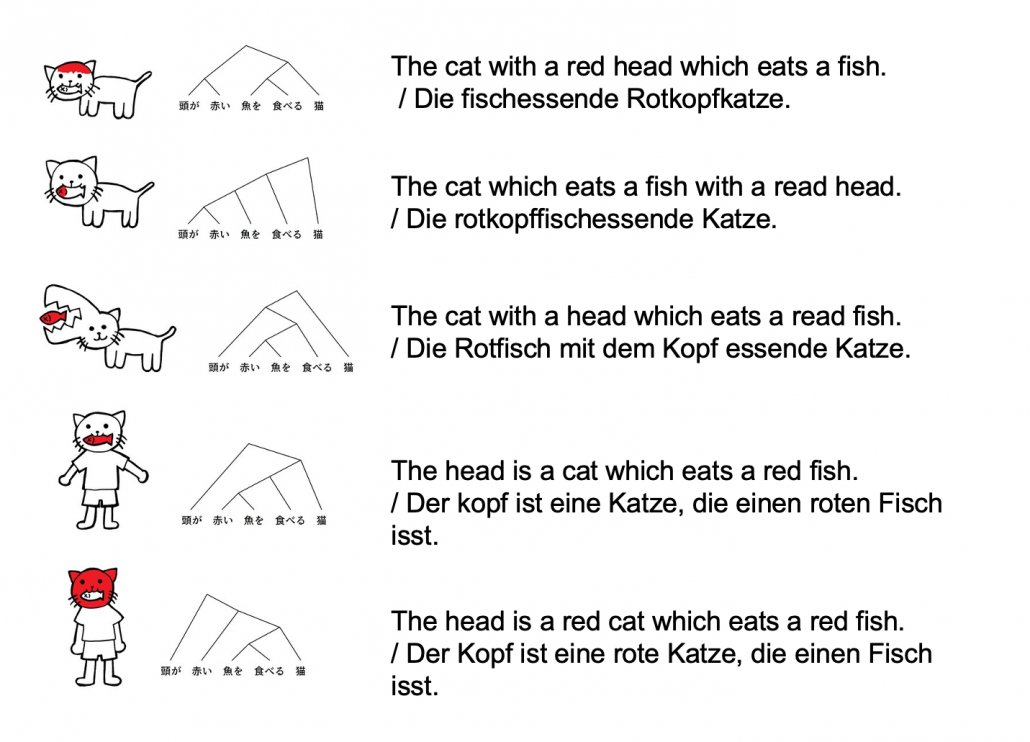
Common sense tells you that the sentence is likely to mean the first two cases, but I am sure they can mean those five possibilities. There might be similarly obscure sentences in other languages, but I bet few languages can be as obscure as Japanese. Also as you can see from the last two sentences, you can omit subjects in Japanese. This rule is nothing exceptional. Japanese people usually don’t use subjects in normal conversations. And when you read classical Japanese, which Japanese high school students have to do just like Western students learn some of classical Latin, the writings omit subjects much more frequently.

*However interestingly we have rich vocabulary of subjects. The subject “I” can be translated to 「私」、「僕」、「俺」、「自分」、「うち」etc, depending on your personality, who you are talking to, and the time when it is written in.

I believe one can see the world only in the framework of their language, and it seems one’s personality changes depending on the language they use. I am not sure whether the language originally determines how they think, or how they think forms the language. But at least I would like you to keep it in mind that if you translate a conversation, for example a random conversation at a bar in Berlin, into Japanese, that would linguistically sound Japanese, but not anthropologically. Imagine that such kind of random conversation in Berlin or something is like playing a catch, I mean throwing a ball named “your opinion.” On the other hand,  normal conversations of Japanese people are in stead more of, I would say,  “resonance” of several tuning forks. They do their bests to show that they are listening to each other, by excessively nodding or just repeating “Really?”, but usually it seems hardly any constructive dialogues have been made.

*I sometimes feel you do not even need deep learning to simulate most of such Japanese conversations. Several-line Python codes would be enough.

My point is, this article series is mainly going to cover only a few techniques of NLP in deep learning field: sequence to sequence model (seq2seq model) , and especially Transformer. They are, at least for now, just mathematical models and mappings of a small part of this profound field of language (as far as I can cover in this article series). But still, examples of language would definitely help you understand Transformer model in the long run.

2 Tokens and word embedding

*Throughout my article series, “words” just means the normal words you use in daily life. “Tokens” means more general unit of NLP tasks. For example the word “Transformer” might be denoted as a single token “Transformer,” or maybe as a combination of two tokens “Trans” and “former.”

One challenging part of handling language data is its encodings. If you started learning programming in a language other than English, you would have encountered some troubles of using keyboards with different arrangements or with characters. Some comments on your codes in your native languages are sometimes not readable on some software. You can easily get away with that by using only English, but when it comes to NLP you have to deal with this difficulty seriously. How to encode characters in each language should be a first obstacle of NLP. In this article we are going to rely on a library named BPEmb, which provides word embedding in various languages, and you do not have to care so much about encodings in languages all over the world with this library.

In the first section, you might have noticed that Japanese sentence is not separated with spaces like Western languages. This is also true of Chinese language, and that means we need additional tasks of separating those sentences at least into proper chunks of words. This is not only a matter of engineering, but also of some linguistic fields. Also I think many people are not so conscious of how sentences in their native languages are grammatically separated.

The next point is, unlike other scientific data, such as temperature, velocity, voltage, or air pressure, language itself is not measured as numerical data. Thus in order to process language, including English, you first have to map language to certain numerical data, and after some processes you need to conversely map the output numerical data into language data. This section is going to be mainly about one-hot encoding and word embedding, the ways to convert word/token into numerical data. You might already have heard about this

You might have learnt about word embedding to some extent, but I hope you could get richer insight into this topic through this article.

2.1 One-hot encoding

One-hot encoding would be the most straightforward way to encode words/tokens. Assume that you have a dictionary whose size is |\mathcal{V}|, and it includes words from “a”, “ablation”, “actually” to “zombie”, “?”, “!”

In a mathematical manner, in order to choose a word out of those |\mathcal{V}| words, all you need is a |\mathcal{V}| dimensional vector, one of whose elements is 1, and the others are 0. When you want to choose the No. i word, which is “indeed” in the example below, its corresponding one-hot vector is \boldsymbol{v} = (0, \dots, 1, \dots, 0 ), where only the No. i element is 1. One-hot encoding is also easy to understand, and that’s all. It is easy to imagine that people have already come up with more complicated and better way to encoder words. And one major way to do that is word embedding.

2.2 Word embedding
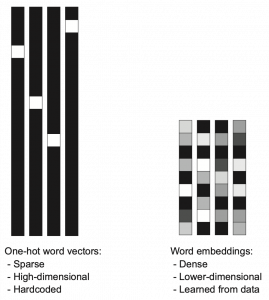
Source: Francois Chollet, Deep Learning with Python,(2018), Manning

Actually word embedding is related to one-hot encoding, and if you understand how to train a simple neural network, for example densely connected layers, you would understand word embedding easily. The key idea of word embedding is denoting each token with a D dimensional vector, whose dimension is fewer than the vocabulary size |\mathcal{V}|. The elements of the resulting word embedding vector are real values, I mean not only 0 or 1. Obviously you can encode much richer variety of tokens with such vectors. The figure at the left side is from “Deep Learning with Python” by François Chollet, and I think this is an almost perfect and simple explanation of the comparison of one-hot encoding and word embedding. But the problem is how to get such convenient vectors. The answer is very simple: you have only to train a network whose inputs are one-hot vector of the vocabulary.

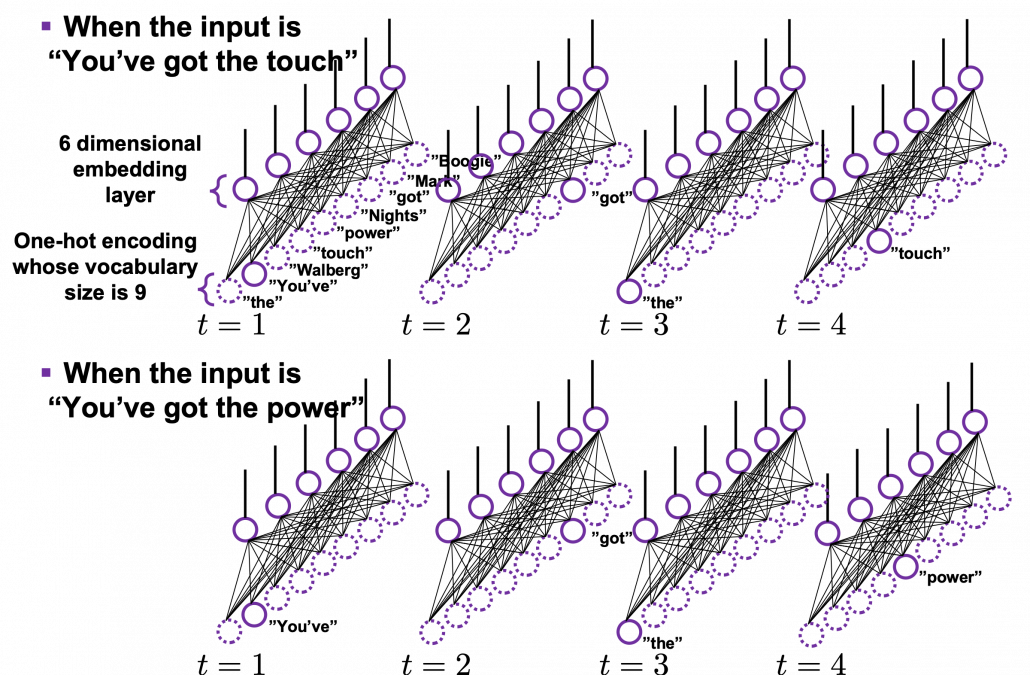
The figure below is a simplified model of word embedding of a certain word. When the word is input into a neural network, only the corresponding element of the one-hot vector is 1, and that virtually means the very first input layer is composed of one neuron whose value is 1. And the only one neuron propagates to the next D dimensional embedding layer. These weights are the very values which most other study materials call “an embedding vector.”

When you input each word into a certain network, for example RNN or Transformer, you map the input one-hot vector into the embedding layer/vector. The examples in the figure are how inputs are made when the input sentences are “You’ve got the touch” and “You’ve got the power.”   Assume that you have a dictionary of one-hot encoding, whose vocabulary is {“the”, “You’ve”, “Walberg”, “touch”, “power”, “Nights”, “got”, “Mark”, “Boogie”}, and the dimension of word embeding is 6. In this case |\mathcal{V}| = 9, D=6. When the inputs are “You’ve got the touch” or “You’ve got the power” , you put the one-hot vector corresponding to “You’ve”, “got”, “the”, “touch” or “You’ve”, “got”, “the”, “power” sequentially every time step t.

In order to get word embedding of certain vocabulary, you just need to train the network. We know that the words “actually” and “indeed” are used in similar ways in writings. Thus when we propagate those words into the embedding layer, we can expect that those embedding layers are similar. This is how we can mathematically get effective word embedding of certain vocabulary.

More interestingly, if word embedding is properly trained, you can mathematically “calculate” words. For example, \boldsymbol{v}_{king} - \boldsymbol{v}_{man} + \boldsymbol{v}_{woman} \approx \boldsymbol{v}_{queen}, \boldsymbol{v}_{Japan} - \boldsymbol{v}_{Tokyo} + \boldsymbol{v}_{Vietnam} \approx \boldsymbol{v}_{Hanoi}.

*I have tried to demonstrate this type of calculation on several word embedding, but none of them seem to work well. At least you should keep it in mind that word embedding learns complicated linear relations between words.

I should explain word embedding techniques such as word2vec in detail, but the main focus of this article is not NLP, so the points I have mentioned are enough to understand Transformer model with NLP examples in the upcoming articles.


3 Language model

Language models is one of the most straightforward, but crucial ideas in NLP. This is also a big topic, so this article is going to cover only basic points. Language model is a mathematical model of the probabilities of which words to come next, given a context. For example if you have a sentence “In the lecture, he opened a _.”, a language model predicts what comes at the part “_.” It is obvious that this is contextual. If you are talking about general university students, “_” would be “textbook,” but if you are talking about Japanese universities, especially in liberal art department, “_” would be more likely to be “smartphone. I think most of you use this language model everyday. When you type in something on your computer or smartphone, you would constantly see text predictions, or they might even correct your spelling or grammatical errors. This is language modelling. You can make language models in several ways, such as n-gram and neural language models, but in this article I can explain only general formulations for such models.

*I am not sure which algorithm is used in which services. That must be too fast changing and competitive for me to catch up.

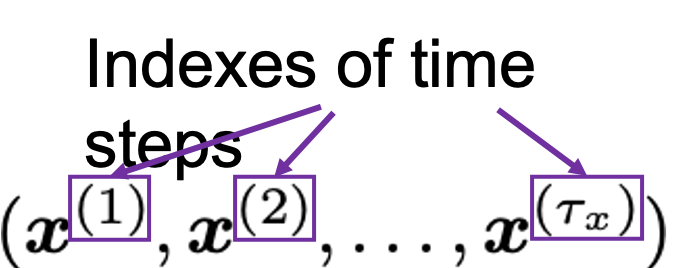
As I mentioned in the first article series on RNN, a sentence is usually processed as sequence data in NLP. One single sentence is denoted as \boldsymbol{X} = (\boldsymbol{x}^{(1)}, \dots, \boldsymbol{x}^{(\tau)}), a list of vectors. The vectors are usually embedding vectors, and the (t) is the index of the order of tokens. For example the sentence “You’ve go the power.” can be expressed as \boldsymbol{X} = (\boldsymbol{x}^{(1)}, \boldsymbol{x}^{(2)}, \boldsymbol{x}^{(3)}, \boldsymbol{x}^{(4)}), where \boldsymbol{x}^{(1)}, \boldsymbol{x}^{(2)}, \boldsymbol{x}^{(3)}, \boldsymbol{x}^{(4)} denote “You’ve”, “got”, “the”, “power”, “.” respectively. In this case \tau = 4.

In practice a sentence \boldsymbol{X} usually includes two tokens BOS and EOS at the beginning and the end of the sentence. They mean “Beginning Of Sentence” and “End Of Sentence” respectively. Thus in many cases \boldsymbol{X} = (\boldsymbol{BOS} , \boldsymbol{x}^{(1)}, \dots, \boldsymbol{x}^{(\tau)}, \boldsymbol{EOS} ). \boldsymbol{BOS} and \boldsymbol{EOS} are also both vectors, at least in the Tensorflow tutorial.

P(\boldsymbol{X} = (\boldsymbol{BOS}, \boldsymbol{x}^{(1)}, \dots, \boldsymbol{x}^{(\tau)}, \boldsymbol{EOS}) is the probability of incidence of the sentence. But it is easy to imagine that it would be very hard to directly calculate how likely the sentence \boldsymbol{X} appears out of all possible sentences. I would rather say it is impossible. Thus instead in NLP we calculate the probability P(\boldsymbol{X}) as a product of the probability of incidence or a certain word, given all the words so far. When you’ve got the words (\boldsymbol{x}^{(1)}, \dots, \boldsymbol{x}^{(t-1}) so far, the probability of the incidence of \boldsymbol{x}^{(t)}, given the context is  P(\boldsymbol{x}^{(t)}|\boldsymbol{x}^{(1)}, \dots, \boldsymbol{x}^{(t-1)}). P(\boldsymbol{BOS}) is a probability of the the sentence \boldsymbol{X} being (\boldsymbol{BOS}), and the probability of \boldsymbol{X} being (\boldsymbol{BOS}, \boldsymbol{x}^{(1)}) can be decomposed this way: P(\boldsymbol{BOS}, \boldsymbol{x}^{(1)}) = P(\boldsymbol{x}^{(1)}|\boldsymbol{BOS})P(\boldsymbol{BOS}).

Just as well P(\boldsymbol{BOS}, \boldsymbol{x}^{(1)}, \boldsymbol{x}^{(2)}) = P(\boldsymbol{x}^{(2)}| \boldsymbol{BOS}, \boldsymbol{x}^{(1)}) P( \boldsymbol{BOS}, \boldsymbol{x}^{(1)})= P(\boldsymbol{x}^{(2)}| \boldsymbol{BOS}, \boldsymbol{x}^{(1)}) P(\boldsymbol{x}^{(1)}| \boldsymbol{BOS}) P( \boldsymbol{BOS}).

Hence, the general probability of incidence of a sentence \boldsymbol{X} is P(\boldsymbol{X})=P(\boldsymbol{BOS}, \boldsymbol{x}^{(1)}, \boldsymbol{x}^{(2)}, \dots, \boldsymbol{x}^{(\tau -1)}, \boldsymbol{x}^{(\tau)}, \boldsymbol{EOS}) = P(\boldsymbol{EOS}| \boldsymbol{BOS}, \boldsymbol{x}^{(1)}, \dots, \boldsymbol{x}^{(\tau)}) P(\boldsymbol{x}^{(\tau)}| \boldsymbol{BOS}, \boldsymbol{x}^{(1)}, \dots, \boldsymbol{x}^{(\tau - 1)}) \cdots P(\boldsymbol{x}^{(2)}| \boldsymbol{BOS}, \boldsymbol{x}^{(1)}) P(\boldsymbol{x}^{(1)}| \boldsymbol{BOS}) P(\boldsymbol{BOS}).

Let \boldsymbol{x}^{(0)} be \boldsymbol{BOS} and \boldsymbol{x}^{(\tau + 1)} be \boldsymbol{EOS}. Plus, let P(\boldsymbol{x}^{(t+1)}|\boldsymbol{X}_{[0, t]}) be P(\boldsymbol{x}^{(t+1)}|\boldsymbol{x}^{(0)}, \dots, \boldsymbol{x}^{(t)}), then P(\boldsymbol{X}) = P(\boldsymbol{x}^{(0)})\prod_{t=0}^{\tau}{P(\boldsymbol{x}^{(t+1)}|\boldsymbol{X}_{[0, t]})}. Language models calculate which words to come sequentially in this way.

Here’s a question: how would you evaluate a language model?

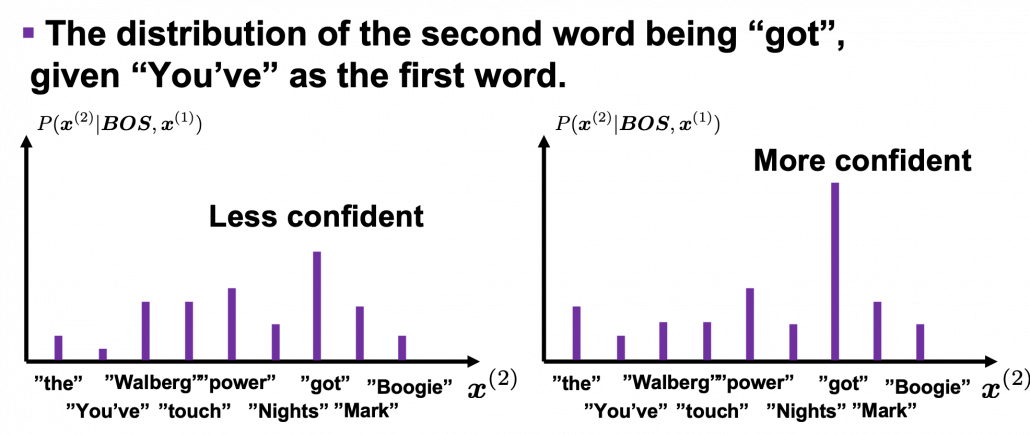
I would say the answer is, when the language model generates words, the more confident the language model is, the better the language model is. Given a context, when the distribution of the next word is concentrated on a certain word, we can say the language model is confident about which word to come next, given the context.

*For some people, it would be more understandable to call this “entropy.”

Let’s take the vocabulary {“the”, “You’ve”, “Walberg”, “touch”, “power”, “Nights”, “got”, “Mark”, “Boogie”} as an example. Assume that P(\boldsymbol{X}) = P(\boldsymbol{BOS}, \boldsymbol{You've}, \boldsymbol{got}, \boldsymbol{the}, \boldsymbol{touch}, \boldsymbol{EOS}) = P(\boldsymbol{BOS}, \boldsymbol{x}^{(1)}, \boldsymbol{x}^{(2)}, \boldsymbol{x}^{(3)}, \boldsymbol{x}^{(4)}, \boldsymbol{EOS})= P(\boldsymbol{x}^{(0)})\prod_{t=0}^{4}{P(\boldsymbol{x}^{(t+1)}|\boldsymbol{X}_{[0, t]})}. Given a context (\boldsymbol{BOS}, \boldsymbol{x}^{(1)}), the probability of incidence of \boldsymbol{x}^{(2)} is P(\boldsymbol{x}^{2}|\boldsymbol{BOS}, \boldsymbol{x}^{(1)}). In the figure below, the distribution at the left side is less confident because probabilities do not spread widely, on the other hand the one at the right side is more confident that next word is “got” because the distribution concentrates on “got”.

*You have to keep it in mind that the sum of all possible probability P(\boldsymbol{x}^{(2)} | \boldsymbol{BOS}, \boldsymbol{x}^{(1)}) is 1, that is, P(\boldsymbol{the}| \boldsymbol{BOS}, \boldsymbol{x}^{(1)}) + P(\boldsymbol{You've}| \boldsymbol{BOS}, \boldsymbol{x}^{(1)}) + \cdots + P(\boldsymbol{Boogie}| \boldsymbol{BOS}, \boldsymbol{x}^{(1)}) = 1.

While the language model generating the sentence “BOS You’ve got the touch EOS”, it is better if the language model keeps being confident. If it is confident, P(\boldsymbol{X})= P(\boldsymbol{BOS}) P(\boldsymbol{x}^{(1)}|\boldsymbol{BOS}}P(\boldsymbol{x}^{(3)}|\boldsymbol{BOS}, \boldsymbol{x}^{(1)}, \boldsymbol{x}^{(2)}) P(\boldsymbol{x}^{(4)}|\boldsymbol{BOS}, \boldsymbol{x}^{(1)}, \boldsymbol{x}^{(2)}, \boldsymbol{x}^{(3)}) P(\boldsymbol{EOS}|\boldsymbol{BOS}, \boldsymbol{x}^{(1)}, \boldsymbol{x}^{(2)}, \boldsymbol{x}^{(3)}, \boldsymbol{x}^{(4)})} gets higher. Thus (-1) \{ log_{b}{P(\boldsymbol{BOS})} + log_{b}{P(\boldsymbol{x}^{(1)}|\boldsymbol{BOS}}) + log_{b}{P(\boldsymbol{x}^{(3)}|\boldsymbol{BOS}, \boldsymbol{x}^{(1)}, \boldsymbol{x}^{(2)})} + log_{b}{P(\boldsymbol{x}^{(4)}|\boldsymbol{BOS}, \boldsymbol{x}^{(1)}, \boldsymbol{x}^{(2)}, \boldsymbol{x}^{(3)})} + log_{b}{P(\boldsymbol{EOS}|\boldsymbol{BOS}, \boldsymbol{x}^{(1)}, \boldsymbol{x}^{(2)}, \boldsymbol{x}^{(3)}, \boldsymbol{x}^{(4)})} \} gets lower, where usually b=2 or b=e.

This is how to measure how confident language models are, and the indicator of the confidence is called perplexity. Assume that you have a data set for evaluation \mathcal{D} = (\boldsymbol{X}_1, \dots, \boldsymbol{X}_n, \dots, \boldsymbol{X}_{|\mathcal{D}|}), which is composed of |\mathcal{D}| sentences in total. Each sentence \boldsymbol{X}_n = (\boldsymbol{x}^{(0)})\prod_{t=0}^{\tau ^{(n)}}{P(\boldsymbol{x}_{n}^{(t+1)}|\boldsymbol{X}_{n, [0, t]})} has \tau^{(n)} tokens in total excluding \boldsymbol{BOS}, \boldsymbol{EOS}. And let |\mathcal{V}| be the size of the vocabulary of the language model. Then the perplexity of the language model is b^z, where z = \frac{-1}{|\mathcal{V}|}\sum_{n=1}^{|\mathcal{D}|}{\sum_{t=0}^{\tau ^{(n)}}{log_{b}P(\boldsymbol{x}_{n}^{(t+1)}|\boldsymbol{X}_{n, [0, t]})}. The b is usually 2 or e.

For example, assume that \mathcal{V} is vocabulary {“the”, “You’ve”, “Walberg”, “touch”, “power”, “Nights”, “got”, “Mark”, “Boogie”}. Also assume that the evaluation data set for perplexity of a language model is \mathcal{D} = (\boldsymbol{X}_1, \boldsymbol{X}_2), where \boldsymbol{X_1} =(\boldsymbol{You've}, \boldsymbol{got}, \boldsymbol{the}, \boldsymbol{touch}) \boldsymbol{X_2} = (\boldsymbol{You've}, \boldsymbol{got}, \boldsymbol{the }, \boldsymbol{power}). In this case |\mathcal{V}|=9, |\mathcal{D}|=2. I have already showed you how to calculate the perplexity of the sentence “You’ve got the touch.” above. You just need to do a similar thing on another sentence “You’ve got the power”, and then you can get the perplexity of the language model.

*If the network is not properly trained, it would also be confident of generating wrong outputs. However, such network still would give high perplexity because it is “confident” at any rate. I’m sorry I don’t know how to tackle the problem. Please let me put this aside, and let’s get down on Transformer model soon.

Appendix

Let’s see how word embedding is implemented with a very simple example in the official Tensorflow tutorial. It is a simple binary classification task on IMDb Dataset. The dataset is composed to comments on movies by movie critics, and you have only to classify if the commentary is positive or negative about the movie. For example when you get you get an input “To be honest, Michael Bay is a terrible as an action film maker. You cannot understand what is going on during combat scenes, and his movies rely too much on advertisements. I got a headache when Mark Walberg used a Chinese cridit card in Texas. However he is very competent when it comes to humorous scenes. He is very talented as a comedy director, and I have to admit I laughed a lot.“, the neural netowork has to judge whether the statement is positive or negative.

This networks just takes an average of input embedding vectors and regress it into a one dimensional value from 0 to 1. The shape of embedding layer is (8185, 16). Weights of neural netowrks are usually implemented as matrices, and you can see that each row of the matrix corresponds to emmbedding vector of each token.
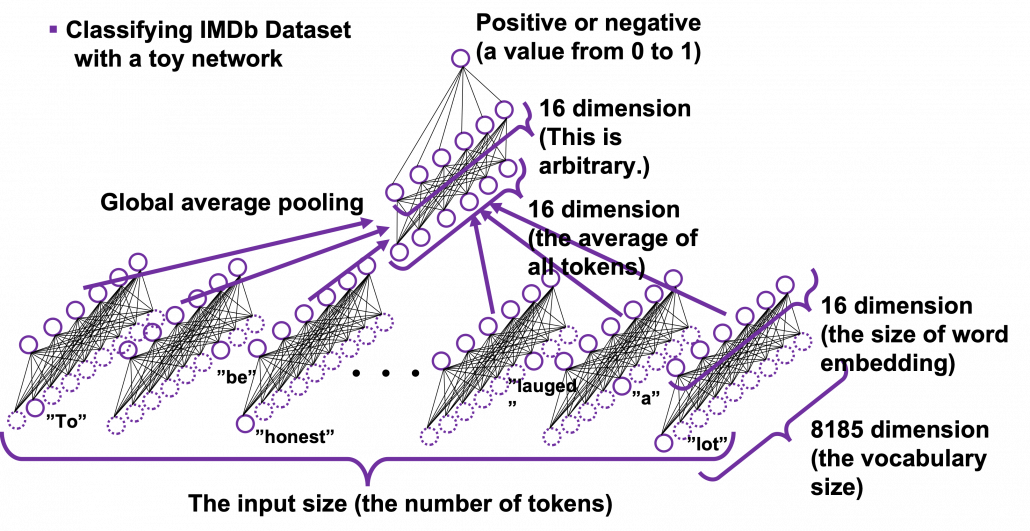
*It is easy to imagine that this technique is problematic. This network virtually taking a mean of input embedding vectors. That could mean if the input sentence includes relatively many tokens with negative meanings, it is inclined to be classified as negative. But for example, if the sentence is “This masterpiece is a dark comedy by Charlie Chaplin which depicted stupidity of the evil tyrant gaining power in the time. It thoroughly mocked Germany in the time as an absurd group of fanatics, but such propaganda could have never been made until ‘Casablanca.'” , this can be classified as negative, because only the part “masterpiece” is positive as a token, and there are much more words with negative meanings themselves.

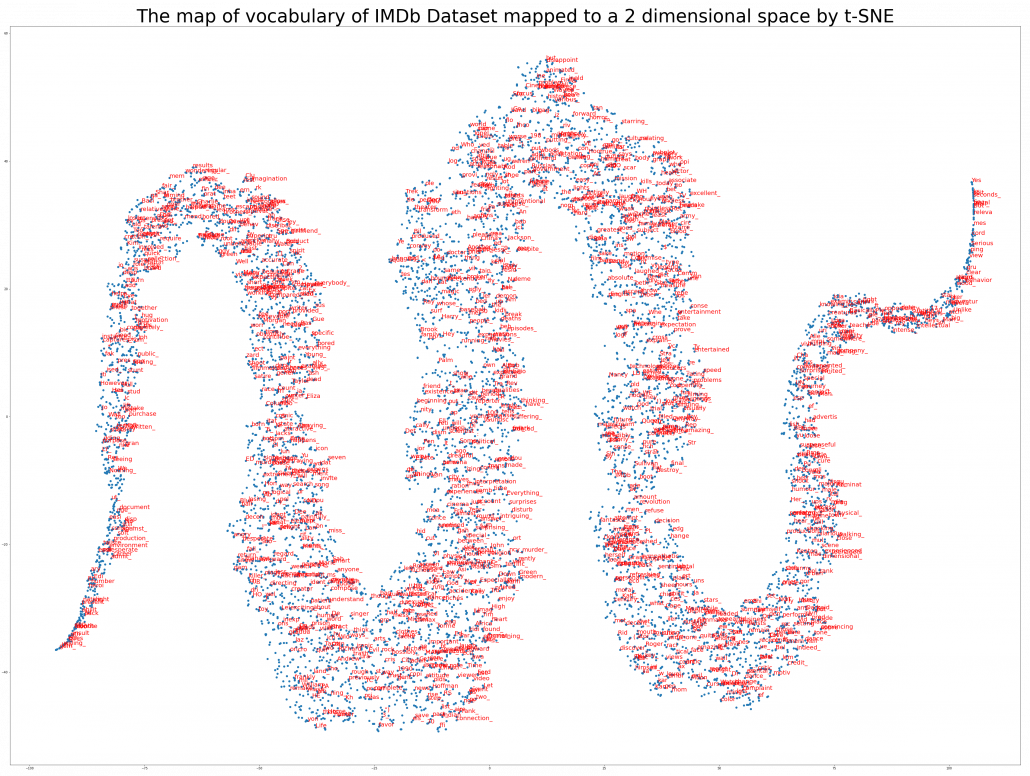
The official Tensorflow tutorial provides visualization of word embedding with Embedding Projector, but I would like you to take more control over the data by yourself. Please just copy and paste the codes below, installing necessary libraries. You would get a map of vocabulary used in the text classification task. It seems you cannot find clear tendency of the clusters of the tokens. You can try other dimension reduction methods to get maps of the vocabulary by for example using Scikit Learn.
import tensorflow as tf
from tensorflow import keras
from tensorflow.keras import layers
import tensorflow_datasets as tfds
tfds.disable_progress_bar()

(train_data, test_data), info = tfds.load(
    'imdb_reviews/subwords8k', 
    split = (tfds.Split.TRAIN, tfds.Split.TEST), 
    with_info=True, as_supervised=True)

train_batches = train_data.shuffle(1000).padded_batch(10)
test_batches = test_data.shuffle(1000).padded_batch(10)

embedding_dim=16

encoder = info.features['text'].encoder

model = keras.Sequential([
  layers.Embedding(encoder.vocab_size, embedding_dim),
  layers.GlobalAveragePooling1D(),
  layers.Dense(16, activation='relu'),
  layers.Dense(1)
])

print("\n\nThe size of the vocabulary generated from IMDb Dataset is " + str(encoder.vocab_size) + '\n\n')

model.summary()

model.compile(optimizer='adam',
              loss=tf.keras.losses.BinaryCrossentropy(from_logits=True),
              metrics=['accuracy'])

history = model.fit(
    train_batches,
    epochs=10,
    validation_data=test_batches, validation_steps=20)

word_embedding_vectors = model.layers[0].get_weights()[0]

print("\n\nThe shape of the trained weigths of the embedding layer is " + str(word_embedding_vectors.shape) + '\n\n')

from sklearn.manifold import TSNE
X_reduced = TSNE(n_components = 2, init='pca', random_state=0).fit_transform(word_embedding_vectors)

import numpy as np
embedding_dict = zip(encoder.subwords, np.arange(len(encoder.subwords)))
embedding_dict = dict(embedding_dict)

import matplotlib.pyplot as plt

plt.figure(figsize=(60, 45))
plt.scatter(X_reduced[:, 0], X_reduced[:, 1])

for i in range(0, len(encoder.subwords), 5):
    plt.text(X_reduced[i, 0], X_reduced[i, 1], encoder.subwords[i], fontsize=20, color='red')
plt.title("The map of vocabulary of IMDb Dataset mapped to a 2 dimensional space by t-SNE", fontsize=60)
#plt.savefig('imdb_tsne_map.png')
plt.show()


Simple RNN

Prerequisites for understanding RNN at a more mathematical level

Writing the A gentle introduction to the tiresome part of understanding RNN Article Series on recurrent neural network (RNN) is nothing like a creative or ingenious idea. It is quite an ordinary topic. But still I am going to write my own new article on this ordinary topic because I have been frustrated by lack of sufficient explanations on RNN for slow learners like me.

I think many of readers of articles on this website at least know that RNN is a type of neural network used for AI tasks, such as time series prediction, machine translation, and voice recognition. But if you do not understand how RNNs work, especially during its back propagation, this blog series is for you.

After reading this articles series, I think you will be able to understand RNN in more mathematical and abstract ways. But in case some of the readers are allergic or intolerant to mathematics, I tried to use as little mathematics as possible.

Ideal prerequisite knowledge:

  • Some understanding on densely connected layers (or fully connected layers, multilayer perception) and how their forward/back propagation work.
  •  Some understanding on structure of Convolutional Neural Network.

*In this article “Densely Connected Layers” is written as “DCL,” and “Convolutional Neural Network” as “CNN.”

1, Difficulty of Understanding RNN

I bet a part of difficulty of understanding RNN comes from the variety of its structures. If you search “recurrent neural network” on Google Image or something, you will see what I mean. But that cannot be helped because RNN enables a variety of tasks.

Another major difficulty of understanding RNN is understanding its back propagation algorithm. I think some of you found it hard to understand chain rules in calculating back propagation of densely connected layers, where you have to make the most of linear algebra. And I have to say backprop of RNN, especially LSTM, is a monster of chain rules. I am planing to upload not only a blog post on RNN backprop, but also a presentation slides with animations to make it more understandable, in some external links.

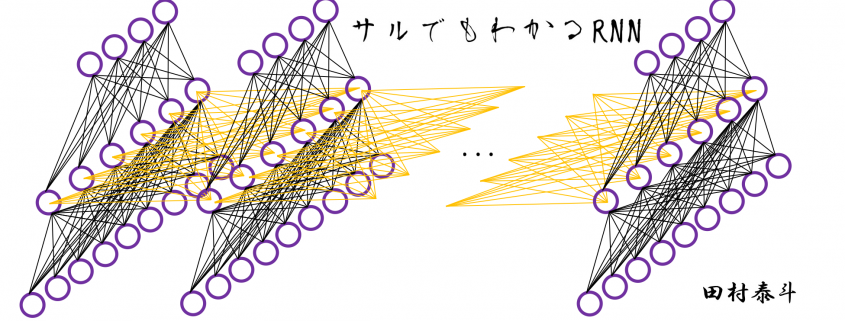
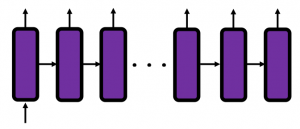
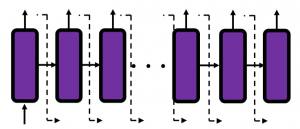
In order to avoid such confusions, I am going to introduce a very simplified type of RNN, which I call a “simple RNN.” The RNN displayed as the head image of this article is a simple RNN.

2, How Neurons are Connected

    \begin{equation*}   1 = 3 - 2 \end{equation*}

How to connect neurons and how to activate them is what neural networks are all about. Structures of those neurons are easy to grasp as long as that is about DCL or CNN. But when it comes to the structure of RNN, many study materials try to avoid showing that RNNs are also connections of neurons, as well as DCL or CNN(*If you are not sure how neurons are connected in CNN, this link should be helpful. Draw a random digit in the square at the corner.). In fact the structure of RNN is also the same, and as long as it is a simple RNN, and it is not hard to visualize its structure.

Even though RNN is also connections of neurons, usually most RNN charts are simplified, using blackboxes. In case of simple RNN, most study material would display it as the chart below.

But that also cannot be helped because fancier RNN have more complicated connections of neurons, and there are no longer advantages of displaying RNN as connections of neurons, and you would need to understand RNN in more abstract way, I mean, as you see in most of textbooks.

I am going to explain details of simple RNN in the next article of this series.

3, Neural Networks as Mappings

If you still think that neural networks are something like magical spider webs or models of brain tissues, forget that. They are just ordinary mappings.

If you have been allergic to mathematics in your life, you might have never heard of the word “mapping.” If so, at least please keep it in mind that the equation y=f(x), which most people would have seen in compulsory education, is a part of mapping. If you get a value x, you get a value y corresponding to the x.

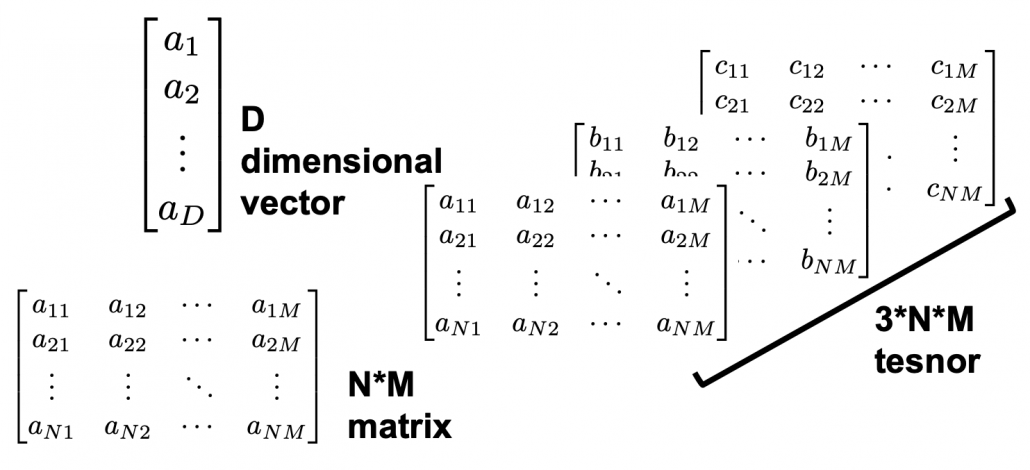
But in case of deep learning, x is a vector or a tensor, and it is denoted with \boldsymbol{x} . If you have never studied linear algebra , imagine that a vector is a column of Excel data (only one column), a matrix is a sheet of Excel data (with some rows and columns), and a tensor is some sheets of Excel data (each sheet does not necessarily contain only one column.)

CNNs are mainly used for image processing, so their inputs are usually image data. Image data are in many cases (3, hight, width) tensors because usually an image has red, blue, green channels, and the image in each channel can be expressed as a hight*width matrix (the “height” and the “width” are number of pixels, so they are discrete numbers).

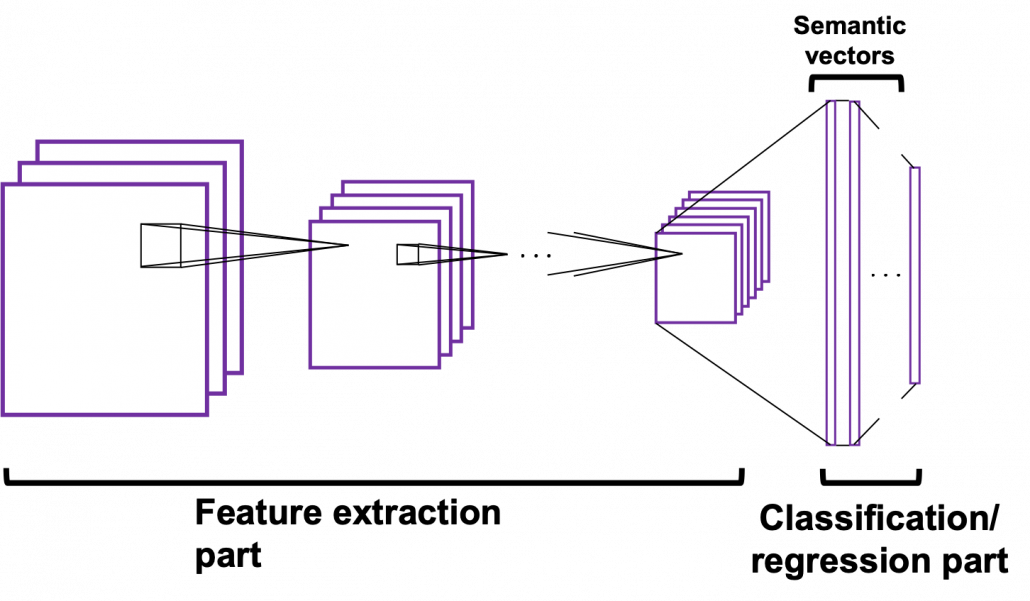
The convolutional part of CNN (which I call “feature extraction part”) maps the tensors to a vector, and the last part is usually DCL, which works as classifier/regressor. At the end of the feature extraction part, you get a vector. I call it a “semantic vector” because the vector has information of “meaning” of the input image. In this link you can see maps of pictures plotted depending on the semantic vector. You can see that even if the pictures are not necessarily close pixelwise, they are close in terms of the “meanings” of the images.

In the example of a dog/cat classifier introduced by François Chollet, the developer of Keras, the CNN maps (3, 150, 150) tensors to 2-dimensional vectors, (1, 0) or (0, 1) for (dog, cat).

Wrapping up the points above, at least you should keep two points in mind: first, DCL is a classifier or a regressor, and CNN is a feature extractor used for image processing. And another important thing is, feature extraction parts of CNNs map images to vectors which are more related to the “meaning” of the image.

Importantly, I would like you to understand RNN this way. An RNN is also just a mapping.

*I recommend you to at least take a look at the beautiful pictures in this link. These pictures give you some insight into how CNN perceive images.

4, Problems of DCL and CNN, and needs for RNN

Taking an example of RNN task should be helpful for this topic. Probably machine translation is the most famous application of RNN, and it is also a good example of showing why DCL and CNN are not proper for some tasks. Its algorithms is out of the scope of this article series, but it would give you a good insight of some features of RNN. I prepared three sentences in German, English, and Japanese, which have the same meaning. Assume that each sentence is divided into some parts as shown below and that each vector corresponds to each part. In machine translation we want to convert a set of the vectors into another set of vectors.

Then let’s see why DCL and CNN are not proper for such task.

  • The input size is fixed: In case of the dog/cat classifier I have mentioned, even though the sizes of the input images varies, they were first molded into (3, 150, 150) tensors. But in machine translation, usually the length of the input is supposed to be flexible.
  • The order of inputs does not mater: In case of the dog/cat classifier the last section, even if the input is “cat,” “cat,” “dog” or “dog,” “cat,” “cat” there’s no difference. And in case of DCL, the network is symmetric, so even if you shuffle inputs, as long as you shuffle all of the input data in the same way, the DCL give out the same outcome . And if you have learned at least one foreign language, it is easy to imagine that the orders of vectors in sequence data matter in machine translation.

*It is said English language has phrase structure grammar, on the other hand Japanese language has dependency grammar. In English, the orders of words are important, but in Japanese as long as the particles and conjugations are correct, the orders of words are very flexible. In my impression, German grammar is between them. As long as you put the verb at the second position and the cases of the words are correct, the orders are also relatively flexible.

5, Sequence Data

We can say DCL and CNN are not useful when you want to process sequence data. Sequence data are a type of data which are lists of vectors. And importantly, the orders of the vectors matter. The number of vectors in sequence data is usually called time steps. A simple example of sequence data is meteorological data measured at a spot every ten minutes, for instance temperature, air pressure, wind velocity, humidity. In this case the data is recorded as 4-dimensional vector every ten minutes.

But this “time step” does not necessarily mean “time.” In case of natural language processing (including machine translation), which you I mentioned in the last section, the numberings of each vector denoting each part of sentences are “time steps.”

And RNNs are mappings from a sequence data to another sequence data.

*At least I found a paper on the RNN’s capability of universal approximation on many-to-one RNN task. But I have not found any papers on universal approximation of many-to-many RNN tasks. Please let me know if you find any clue on whether such approximation is possible. I am desperate to know that. 

6, Types of RNN Tasks

RNN tasks can be classified into some types depending on the lengths of input/output sequences (the “length” means the times steps of input/output sequence data).

If you want to predict the temperature in 24 hours, based on several time series data points in the last 96 hours, the task is many-to-one. If you sample data every ten minutes, the input size is 96*6=574 (the input data is a list of 574 vectors), and the output size is 1 (which is a value of temperature). Another example of many-to-one task is sentiment classification. If you want to judge whether a post on SNS is positive or negative, the input size is very flexible (the length of the post varies.) But the output size is one, which is (1, 0) or (0, 1), which denotes (positive, negative).

*The charts in this section are simplified model of RNN used for each task. Please keep it in mind that they are not 100% correct, but I tried to make them as exact as possible compared to those in other study materials.

Music/text generation can be one-to-many tasks. If you give the first sound/word you can generate a phrase.

Next, let’s look at many-to-many tasks. Machine translation and voice recognition are likely to be major examples of many-to-many tasks, but here name entity recognition seems to be a proper choice. Name entity recognition is task of finding proper noun in a sentence . For example if you got two sentences “He said, ‘Teddy bears on sale!’ ” and ‘He said, “Teddy Roosevelt was a great president!” ‘ judging whether the “Teddy” is a proper noun or a normal noun is name entity recognition.

Machine translation and voice recognition, which are more popular, are also many-to-many tasks, but they use more sophisticated models. In case of machine translation, the inputs are sentences in the original language, and the outputs are sentences in another language. When it comes to voice recognition, the input is data of air pressure at several time steps, and the output is the recognized word or sentence. Again, these are out of the scope of this article but I would like to introduce the models briefly.

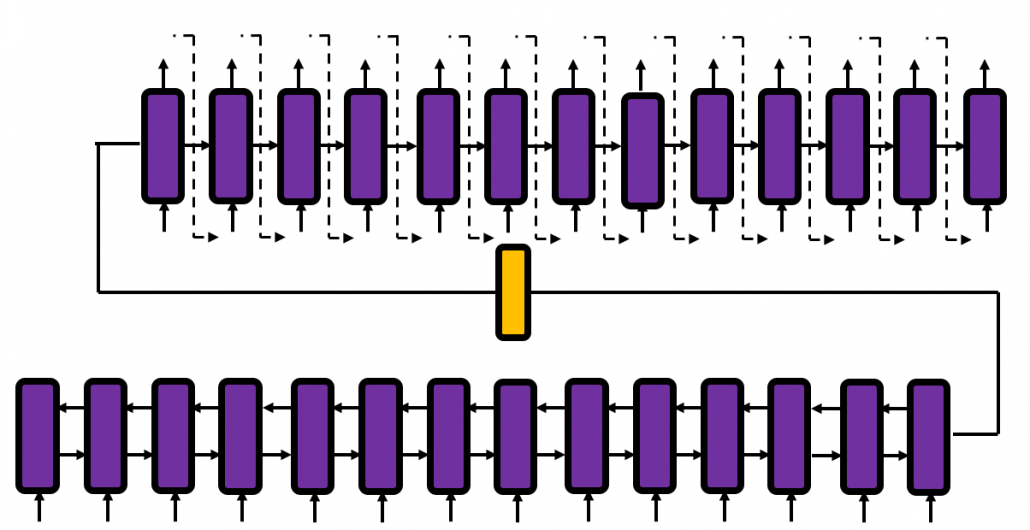
Machine translation uses a type of RNN named sequence-to-sequence model (which is often called seq2seq model). This model is also very important for other natural language processes tasks in general, such as text summarization. A seq2seq model is divided into the encoder part and the decoder part. The encoder gives out a hidden state vector and it used as the input of the decoder part. And decoder part generates texts, using the output of the last time step as the input of next time step.

Voice recognition is also a famous application of RNN, but it also needs a special type of RNN.

*To be honest, I don’t know what is the state-of-the-art voice recognition algorithm. The example in this article is a combination of RNN and a collapsing function made using Connectionist Temporal Classification (CTC). In this model, the output of RNN is much longer than the recorded words or sentences, so a collapsing function reduces the output into next output with normal length.

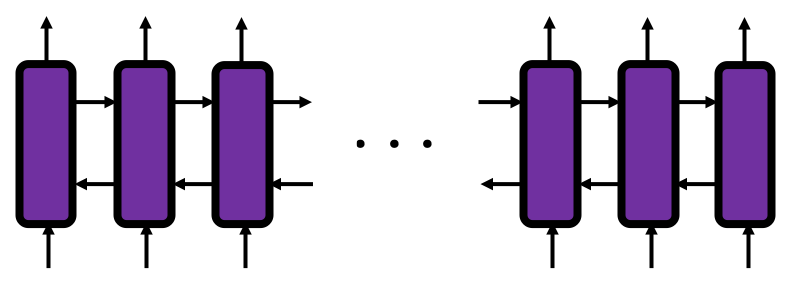
You might have noticed that RNNs in the charts above are connected in both directions. Depending on the RNN tasks you need such bidirectional RNNs.  I think it is also easy to imagine that such networks are necessary. Again, machine translation is a good example.

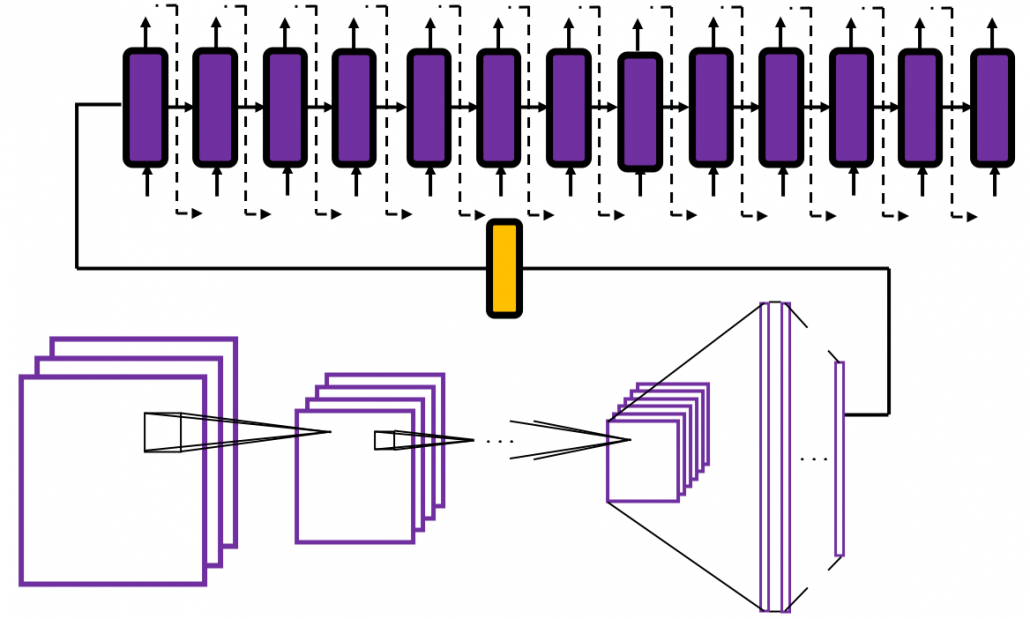
And interestingly, image captioning, which enables a computer to describe a picture, is one-to-many-task. As the output is a sentence, it is easy to imagine that the output is “many.” If it is a one-to-many task, the input is supposed to be a vector.

Where does the input come from? I told you that I was obsessed with the beauty of the last vector of the feature extraction part of CNN. Surprisingly the the “beautiful” vector, which I call a “semantic vector” is the input of image captioning task (after some transformations, depending on the network models).

I think this articles includes major things you need to know as prerequisites when you want to understand RNN at more mathematical level. In the next article, I would like to explain the structure of a simple RNN, and how it forward propagate.

* I make study materials on machine learning, sponsored by DATANOMIQ. I do my best to make my content as straightforward but as precise as possible. I include all of my reference sources. If you notice any mistakes in my materials, please let me know (email: yasuto.tamura@datanomiq.de). And if you have any advice for making my materials more understandable to learners, I would appreciate hearing it.

Fuzzy Matching mit dem Jaro-Winkler-Score zur Auswertung von Markenbekanntheit und Werbeerinnerung

Für Unternehmen sind Markenbekanntheit und Werbeerinnerung wichtige Zielgrößen, denn anhand dieser lässt sich ableiten, ob Konsumenten ein Produkt einer Marke kaufen werden oder nicht. Zielgrößen wie diese werden von Marktforschungsinstituten über Befragungen ermittelt. Dafür wird in regelmäßigen Zeitabständen eine gleichbleibende Anzahl an Personen befragt, ob diese sich an Marken einer bestimmten Branche erinnern oder sich an Werbung erinnern. Die Personen füllen dafür in der Regel einen Onlinefragebogen aus.

Die Ergebnisse der Befragung liegen in einer Datenmatrix (siehe Tabelle) vor und müssen zur Auswertung zunächst bearbeitet werden.

Laufende Nummer Marke 1 Marke 2 Marke 3 Marke 4
1 ING-Diba Citigroup Sparkasse
2 Sparkasse Consorsbank
3 Commerbank Deutsche Bank Sparkasse ING-DiBa
4 Sparkasse Targobank

Ziel ist es aus diesen Daten folgende 0/1 codierte Matrix zu generieren. Wenn eine Marke bekannt ist, wird in die zur Marke gehörende Spalte eine Eins eingetragen, ansonsten eine Null.

Alle Marken ING-Diba Citigroup Sparkasse Targobank
ING-Diba, Citigroup, Sparkasse 1 1 1 0
Sparkasse, Consorsbank 0 0 1 0
Commerzbank, Deutsche Bank, Sparkasse, ING-Diba 1 0 0 0
Sparkasse, Targobank 0 0 1 1

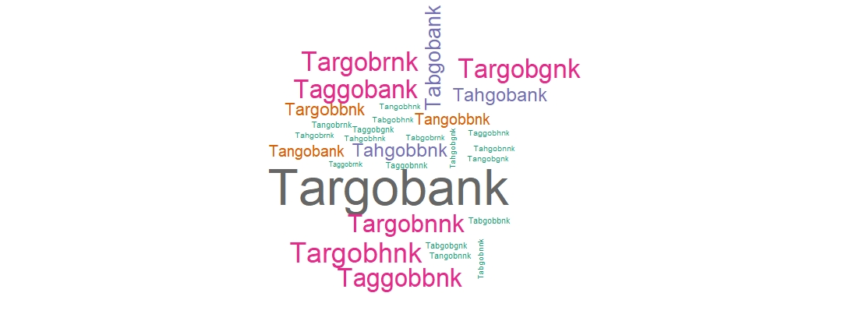
Der Workflow um diese Datentransformation durchzuführen ist oftmals mittels eines Teilstrings einer Marke zu suchen ob diese in einem über alle Nennungen hinweg zusammengeführten String vorkommt oder nicht (z.B. „argo“ bei Targobank). Das Problem dieser Herangehensweise ist, dass viele falsch geschriebenen Wörter so nicht erfasst werden und die Erfahrung zeigt, dass falsch geschriebene Marken in vielfältigster Weise auftreten. Hier mussten in der Vergangenheit Mitarbeiter sich in stundenlangem Kampf durch die Ergebnisse wühlen und falsch zugeordnete oder nicht zugeordnete Marken händisch korrigieren und alle Variationen der Wörter notieren, um für die nächste Befragung das Suchpattern zu optimieren.

Eine Alternative diesen aufwändigen Workflow stellt die Ermittlung von falsch geschriebenen Wörtern mittels des Jaro-Winkler-Scores dar. Dafür muss zunächst die Jaro-Winkler-Distanz zwischen zwei Strings berechnet werden. Diese berechnet sich wie folgt:

d_j = \frac{1}{3}(\frac{m}{|s_1|}+\frac{m}{|s_2|}+\frac{m - t}{m})

  • m: Anzahl der übereinstimmenden Buchstaben
  • s: Länge des Strings
  • t: Hälfte der Anzahl der Umstellungen der Buchstaben die nötig sind, damit Strings identisch sind. („Ta“ und „gobank“ befinden sich bereits in der korrekten Reihenfolge, somit gilt: t = 0)

Aus dem Ergebnis lässt sich der Jaro-Winkler Score berechnen:
d_w = \d_j + (l_p (1 - d_j))
ist dabei die Jaro-Winkler-Distanz, l die Länge der übereinstimmenden Buchstaben von Beginn des Wortes bis zum maximal vierten Buchstaben und p ein konstanter Faktor von 0,1.

Für die Strings „Targobank“ und „Tangobank“ ergibt sich die Jaro-Winkler-Distanz:

d_j = \frac{1}{3}(\frac{8}{9}+\frac{8}{9}+\frac{8 - 0}{9})

Daraus wird im nächsten Schritt der Jaro-Winkler Score berechnet:

d_w = 0,9259 + (2 \cdot 0,1 (1 - 0,9259)) = 0,9407407

Bisherige Erfahrungen haben gezeigt, dass sich Scores ab 0,8 bzw. 0,9 am besten zur Suche von ähnlichen Wörtern eignen. Ein Schwellenwert darunter findet sehr viele Wörter, die sich z.B. auch anderen Wörtern zuordnen lassen. Ein Schwellenwert über 0,9 identifiziert falsch geschriebene Wörter oftmals nicht mehr.

Nach diesem theoretischen Exkurs möchte ich nun zeigen, wie sich das Ganze praktisch anwenden lässt. Da sich das Ganze um ein fiktives Beispiel handelt, werden zur Demonstration der Praxistauglichkeit Fakedaten mit folgendem Code erzeugt. Dabei wird angenommen, dass Personen unterschiedlich viele Banken kennen und diese mit einer bestimmten Wahrscheinlichkeit falsch schreiben.

# Erstellung von Fakeantworten
set.seed(1234)
library(stringi)
library(tidyr)
library(RecordLinkage)
library(xlsx)
library(tm)
library(qdap)
library(stringr)
library(openxlsx)

konsonant <- c("r", "n", "g", "h", "b")
vokal <- c("a", "e", "o", "i", "u")

# Funktion, die mit einer zu bestimmenden Wahrscheinlichkeit, einen zufälligen Buchstaben erzeugt.
generate_wrong_words <- function(x, p, k = TRUE) {
  if(runif(1, 0, 1) > p) { # Zufallswert zwischen 0 und 1
    if(k == TRUE) { # Konsonant oder Vokal erzeugen
      string <- konsonant[sample.int(5, 1)] # Zufallszahl, die Index des Konsonnanten-Vektors bestimmt.
    } else {
      string <- vokal[sample.int(5, 1)] # Zufallszahl, die Index eines Vokal-Vecktors bestimmt.
    }
  } else {
    string <- x
  }
  return(string)
}

randombank <- function(x) {
  random_num <- runif(1, 0, 1)
  if(random_num  > x) { ## Wahrscheinlichkeit, dass Person keine Bank kennt.
    number <- sample.int(7, 1)
    if(number == 1) {
      bank <- paste0("Ta", generate_wrong_words(x = "r", p = 0.7), "gob", generate_wrong_words(x = "a", p = 0.9), "nk")
    } else if (number == 2) {
      bank <- paste0("Ing-di", generate_wrong_words(x = "b", p = 0.6), "a")
    } else if (number == 3) {
      bank <- paste0("com", generate_wrong_words(x = "m", p = 0.7), "erzb", generate_wrong_words(x = "a", p = 0.8), "nk")
    } else if (number == 4){
      bank <- paste0("Deutsch", generate_wrong_words(x = "e", p = 0.6, k = FALSE), " Ban", generate_wrong_words(x = "k", p = 0.8))
    } else if (number == 5) {
      bank <- paste0("Spark", generate_wrong_words(x = "a", p = 0.7, k = FALSE), "sse")
    } else if (number == 6) {
      bank <- paste0("Cons", generate_wrong_words(x = "o", p = 0.7, k = FALSE), "rsbank")
    } else {
      bank <- paste0("Cit", generate_wrong_words(x = "i", p = 0.7, k = FALSE), "gro", generate_wrong_words(x = "u", p = 0.9, k = FALSE), "p")
    }
  } else {
    bank <- "" # Leerer String, wenn keine Bank bekannt.
  }
  return(bank)
}


# DataFrame erzeugen, in dem Werte gespeichert werden.
df_raw <- data.frame(matrix(ncol = 8, nrow = 2500))

# Erzeugen von richtig und falsch geschrieben Banken mit einer durch bestimmten Variabilität an Banken, welche die Personen kennen.
for(i in 1:2500) {
  df_raw [i, 1] <- i # Laufende Nummer des Befragten
  df_raw [i, 2] <- randombank(x = 0.05)
  if(df_raw [i, 2] == "") { df_raw [i, 3] <- "" } else {df_raw [i, 3] <- randombank(x = 0.1)}
  if(df_raw [i, 3] == "") { df_raw [i, 4] <- "" } else {df_raw [i, 4] <- randombank(x = 0.1)}
  if(df_raw [i, 4] == "") { df_raw [i, 5] <- "" } else {df_raw [i, 5] <- randombank(x = 0.15)} 
  if(df_raw [i, 5] == "") { df_raw [i, 6] <- "" } else {df_raw [i, 6] <- randombank(x = 0.15)}
  if(df_raw [i, 6] == "") { df_raw [i, 7] <- "" } else {df_raw [i, 7] <- randombank(x = 0.2)} 
  if(df_raw [i, 7] == "") { df_raw [i, 8] <- "" } else {df_raw [i, 8] <- randombank(x = 0.2)} 
}
colnames(df_raw)[1] <- "lfdn"

Ausführen:

head(df_raw)

Nun werden die Inhalte der Spalten in eine einzige Spalte zusammengefasst und jede Marke per Komma getrennt.

df <- unite(df_raw, united, c(2:ncol(df_raw)), sep = ",")
colnames(df)[2] <- "text"
# Gesuchte Banken (nur korrekt geschrieben)
startliste <- c("Targobank", "Ing-DiBa", "Commerzbank", "Deutsche Bank", "Sparkasse", "Consorsbank", "Citigroup")

Damit Sonderzeichen, Leerzeichen oder Groß- und Kleinschreibung keine Rolle spielen, werden alle Strings vereinheitlicht und störende Zeichen entfernt.

dftext <- tolower(dftext)
dftext <- str_trim(dftext)
dftext <- gsub(" ", "", dftext)
dftext <- gsub("[?]", "", dftext)
dftext <- gsub("[-]", "", dftext)
dftext <- gsub("[_]", "", dftext)

startliste <- tolower(startliste)
startliste <- str_trim(startliste)
startliste <- gsub(" ", "", startliste)
startliste <- gsub("[?]", "", startliste)
startliste <- gsub("[-]", "", startliste)
startliste <- gsub("[_]", "", startliste)

Im nächsten Schritt wird geprüft welche Schreibweisen überhaupt existieren. Dafür eignet sich eine Word-Frequency-Matrix, mit der alle einzigartigen Wörter und deren Häufigkeiten in einem Vektor gezählt wird.

words <- as.data.frame(wfm(dftext)) # Jedes einzigartige Wort und dazugehörige Häufigkeiten. words <- rownames(words) # wfm zählt Häufigkeiten jedes Wortes und schreibt Wörter in rownames, wir brauchen jedoch das Wort selbst. </pre> Danach wird eine leere Liste erstellt, in der iterativ für jedes Element des Suchvektors ein Charactervektor erzeugt wird, der Wörter enthält, die einen Jaro-Winker Score von 0,9 oder höher besitzen. <pre class="theme:github lang:r decode:true ">for(i in 1:length(startliste)) {   finalewortliste[[i]] <- words[which(jarowinkler(startliste[[i]], words) > 0.9)] } </pre> Jetzt wird ein leerer DataFrame erzeugt, der die Zeilenlänge des originalen DataFrames besitzt sowie die Anzahl der Marken als Spaltenlänge. <pre class="theme:github lang:r decode:true ">finaldf <- data.frame(matrix(nrow = nrow(df), ncol = length(startliste))) colnames(finaldf) <- startliste </pre> Im nächsten Schritt wird nun aus den ähnlichen Wörtern mit einer oder-Verknüpfung einen String erzeugt, der alle durch den Jaro-Winkler-Score identifizierten Wörter beinhaltet. Wenn ein Treffer gefunden wird, wird in der Suchspalte eine Eins eingetragen, ansonsten eine Null. <pre class="theme:github lang:r decode:true ">for(i in 1:ncol(finaldf)) {   finaldf[i] <- ifelse(str_detect(dftext, paste(finalewortliste[[i]], collapse = "|")) == TRUE, 1, 0) 
}

Zuletzt wird eine Spalte erzeugt, in die eine Eins geschrieben wird, wenn keine der Marken gefunden wurde.

finaldfkeinedergeannten <- ifelse(rowSums(finaldf) > 0, 0, 1) # Wenn nicht mindestens eine der gesuchten Banken bekannt </pre> Nach der fertigen Berechnung der Matrix können nun die finalen KPI´s berechnet und als Report in eine .xlsx Datei geschrieben werden. <pre class="theme:github lang:r decode:true "># Prozentuale Anteile berechnen. anteil <- as.data.frame(t(sapply(finaldf, sum) / nrow(finaldf) * 100)) # Ordne dem DataFrame die ursprünglichen Nenneungen zu. finaldf <- cbind(dftext, finaldf)
colnames(finaldf)[1] <- "text"

# Ergebnisse in eine .xlsx Datei schreiben.
wb <- createWorkbook()
addWorksheet(wb, "Ergebnisse")    
writeData(wb, "Ergebnisse", anteil, startCol = 2, startRow = 1, rowNames = FALSE)
writeData(wb, "Ergebnisse", finaldf, startCol = 1, startRow = 4, rowNames = FALSE)
saveWorkbook(wb, paste0("C:/Users/User/Desktop/Results_", Sys.Date(), ".xlsx"), overwrite = TRUE)  
Dieses Vorgehen kann natürlich nicht verhindern, dass sich jemand mit kritischem Auge die Daten anschauen muss. In mehreren Tests ergaben sich bei einer Fallzahl von ~10.000 Antworten Genauigkeiten zwischen 95% und 100%, was bisherige Ansätze um ein Vielfaches übertrifft.9407407

Language Detecting with sklearn by determining Letter Frequencies

Of course, there are better and more efficient methods to detect the language of a given text than counting its lettes. On the other hand this is a interesting little example to show the impressing ability of todays machine learning algorithms to detect hidden patterns in a given set of data.

For example take the sentence:

“Ceci est une phrase française.”

It’s not to hard to figure out that this sentence is french. But the (lowercase) letters of the same sentence in a random order look like this:

“eeasrsçneticuaicfhenrpaes”

Still sure it’s french? Regarding the fact that this string contains the letter “ç” some people could have remembered long passed french lessons back in school and though might have guessed right. But beside the fact that the french letter “ç” is also present for example in portuguese, turkish, catalan and a few other languages, this is still a easy example just to explain the problem. Just try to guess which language might have generated this:

“ogldviisnntmeyoiiesettpetorotrcitglloeleiengehorntsnraviedeenltseaecithooheinsnstiofwtoienaoaeefiitaeeauobmeeetdmsflteightnttxipecnlgtetgteyhatncdisaceahrfomseehmsindrlttdthoaranthahdgasaebeaturoehtrnnanftxndaeeiposttmnhgttagtsheitistrrcudf”

While this looks simply confusing to the human eye and it seems practically impossible to determine the language it was generated from, this string still contains as set of hidden but well defined patterns from which the language could be predictet with almost complete (ca. 98-99%) certainty.

First of all, we need a set of texts in the languages our model should be able to recognise. Luckily with the package NLTK there comes a big set of example texts which actually are protocolls of the european parliament and therefor are publicly availible in 11 differen languages:

  •  Danish
  •  Dutch
  •  English
  •  Finnish
  •  French
  •  German
  •  Greek
  •  Italian
  •  Portuguese
  •  Spanish
  •  Swedish

Because the greek version is not written with the latin alphabet, the detection of the language greek would just be too simple, so we stay with the other 10 languages availible. To give you a idea of the used texts, here is a little sample:

“Resumption of the session I declare resumed the session of the European Parliament adjourned on Friday 17 December 1999, and I would like once again to wish you a happy new year in the hope that you enjoyed a pleasant festive period.
Although, as you will have seen, the dreaded ‘millennium bug’ failed to materialise, still the people in a number of countries suffered a series of natural disasters that truly were dreadful.”

Train and Test

The following code imports the nessesary modules and reads the sample texts from a set of text files into a pandas.Dataframe object and prints some statistics about the read texts:

from pathlib import Path
import random
from collections import Counter, defaultdict
import numpy as np
import pandas as pd
from sklearn.neighbors import *
from matplotlib import pyplot as plt
from mpl_toolkits import mplot3d
%matplotlib inline


def read(file):
    '''Returns contents of a file'''
    with open(file, 'r', errors='ignore') as f:
        text = f.read()
    return text

def load_eu_texts():
    '''Read texts snipplets in 10 different languages into pd.Dataframe

    load_eu_texts() -> pd.Dataframe
    
    The text snipplets are taken from the nltk-data corpus.
    '''
    basepath = Path('/home/my_username/nltk_data/corpora/europarl_raw/langs/')
    df = pd.DataFrame(columns=['text', 'lang', 'len'])
    languages = [None]
    for lang in basepath.iterdir():
        languages.append(lang.as_posix())
        t = '\n'.join([read(p) for p in lang.glob('*')])
        d = pd.DataFrame()
        d['text'] = ''
        d['text'] = pd.Series(t.split('\n'))
        d['lang'] = lang.name.title()
        df = df.append(d.copy(), ignore_index=True)
    return df

def clean_eutextdf(df):
    '''Preprocesses the texts by doing a set of cleaning steps
    
    clean_eutextdf(df) -> cleaned_df
    '''
    # Cuts of whitespaces a the beginning and and
    df['text'] = [i.strip() for i in df['text']]
    # Generate a lowercase Version of the text column
    df['ltext'] = [i.lower() for i in df['text']]

    # Determining the length of each text
    df['len'] = [len(i) for i in df['text']]
    # Drops all texts that are not at least 200 chars long
    df = df.loc[df['len'] > 200]
    return df

# Execute the above functions to load the texts
df = clean_eutextdf(load_eu_texts())

# Print a few stats of the read texts
textline = 'Number of text snippplets: ' + str(df.shape[0])
print('\n' + textline + '\n' + ''.join(['_' for i in range(len(textline))]))
c = Counter(df['lang'])
for l in c.most_common():
    print('%-25s' % l[0] + str(l[1]))
df.sample(10)
Number of text snippplets: 56481
________________________________
French                   6466
German                   6401
Italian                  6383
Portuguese               6147
Spanish                  6016
Finnish                  5597
Swedish                  4940
Danish                   4914
Dutch                    4826
English                  4791
lang	len	text	ltext
135233	Finnish	346	Vastustan sitä , toisin kuin tämän parlamentin...	vastustan sitä , toisin kuin tämän parlamentin...
170400	Danish	243	Desuden ødelægger det centraliserede europæisk...	desuden ødelægger det centraliserede europæisk...
85466	Italian	220	In primo luogo , gli accordi di Sharm el-Sheik...	in primo luogo , gli accordi di sharm el-sheik...
15926	French	389	Pour ce qui est concrètement du barrage de Ili...	pour ce qui est concrètement du barrage de ili...
195321	English	204	Discretionary powers for national supervisory ...	discretionary powers for national supervisory ...
160557	Danish	304	Det er de spørgmål , som de lande , der udgør ...	det er de spørgmål , som de lande , der udgør ...
196310	English	355	What remains of the concept of what a company ...	what remains of the concept of what a company ...
110163	Portuguese	327	Actualmente , é do conhecimento dos senhores d...	actualmente , é do conhecimento dos senhores d...
151681	Danish	203	Dette er vigtigt for den tillid , som samfunde...	dette er vigtigt for den tillid , som samfunde...
200540	English	257	Therefore , according to proponents , such as ...	therefore , according to proponents , such as ...

Above you see a sample set of random rows of the created Dataframe. After removing very short text snipplets (less than 200 chars) we are left with 56481 snipplets. The function clean_eutextdf() then creates a lower case representation of the texts in the coloum ‘ltext’ to facilitate counting the chars in the next step.
The following code snipplet now extracs the features – in this case the relative frequency of each letter in every text snipplet – that are used for prediction:

def calc_charratios(df):
    '''Calculating ratio of any (alphabetical) char in any text of df for each lyric
    
    calc_charratios(df) -> list, pd.Dataframe
    '''
    CHARS = ''.join({c for c in ''.join(df['ltext']) if c.isalpha()})
    print('Counting Chars:')
    for c in CHARS:
        print(c, end=' ')
        df[c] = [r.count(c) for r in df['ltext']] / df['len']
    return list(CHARS), df

features, df = calc_charratios(df)

Now that we have calculated the features for every text snipplet in our dataset, we can split our data set in a train and test set:

def split_dataset(df, ratio=0.5):
    '''Split the dataset into a train and a test dataset
    
    split_dataset(featuredf, ratio) -> pd.Dataframe, pd.Dataframe
    '''
    df = df.sample(frac=1).reset_index(drop=True)
    traindf = df[:][:int(df.shape[0] * ratio)]
    testdf = df[:][int(df.shape[0] * ratio):]
    return traindf, testdf

featuredf = pd.DataFrame()
featuredf['lang'] = df['lang']
for feature in features:
    featuredf[feature] = df[feature]
traindf, testdf = split_dataset(featuredf, ratio=0.80)

x = np.array([np.array(row[1:]) for index, row in traindf.iterrows()])
y = np.array([l for l in traindf['lang']])
X = np.array([np.array(row[1:]) for index, row in testdf.iterrows()])
Y = np.array([l for l in testdf['lang']])

After doing that, we can train a k-nearest-neigbours classifier and test it to get the percentage of correctly predicted languages in the test data set. Because we do not know what value for k may be the best choice, we just run the training and testing with different values for k in a for loop:

def train_knn(x, y, k):
    '''Returns the trained k nearest neighbors classifier
    
    train_knn(x, y, k) -> sklearn.neighbors.KNeighborsClassifier
    '''
    clf = KNeighborsClassifier(k)
    clf.fit(x, y)
    return clf

def test_knn(clf, X, Y):
    '''Tests a given classifier with a testset and return result
    
    text_knn(clf, X, Y) -> float
    '''
    predictions = clf.predict(X)
    ratio_correct = len([i for i in range(len(Y)) if Y[i] == predictions[i]]) / len(Y)
    return ratio_correct

print('''k\tPercentage of correctly predicted language
__________________________________________________''')
for i in range(1, 16):
    clf = train_knn(x, y, i)
    ratio_correct = test_knn(clf, X, Y)
    print(str(i) + '\t' + str(round(ratio_correct * 100, 3)) + '%')
k	Percentage of correctly predicted language
__________________________________________________
1	97.548%
2	97.38%
3	98.256%
4	98.132%
5	98.221%
6	98.203%
7	98.327%
8	98.247%
9	98.371%
10	98.345%
11	98.327%
12	98.3%
13	98.256%
14	98.274%
15	98.309%

As you can see in the output the reliability of the language classifier is generally very high: It starts at about 97.5% for k = 1, increases for with increasing values of k until it reaches a maximum level of about 98.5% at k ≈ 10.

Using the Classifier to predict languages of texts

Now that we have trained and tested the classifier we want to use it to predict the language of example texts. To do that we need two more functions, shown in the following piece of code. The first one extracts the nessesary features from the sample text and predict_lang() predicts the language of a the texts:

def extract_features(text, features):
    '''Extracts all alphabetic characters and add their ratios as feature
    
    extract_features(text, features) -> np.array
    '''
    textlen = len(text)
    ratios = []
    text = text.lower()
    for feature in features:
        ratios.append(text.count(feature) / textlen)
    return np.array(ratios)

def predict_lang(text, clf=clf):
    '''Predicts the language of a given text and classifier
    
    predict_lang(text, clf) -> str
    '''
    extracted_features = extract_features(text, features)
    return clf.predict(np.array(np.array([extracted_features])))[0]

text_sample = df.sample(10)['text']

for example_text in text_sample:
    print('%-20s'  % predict_lang(example_text, clf) + '\t' + example_text[:60] + '...')
Italian             	Auspico che i progetti riguardanti i programmi possano contr...
English             	When that time comes , when we have used up all our resource...
Portuguese          	Creio que o Parlamento protesta muitas vezes contra este mét...
Spanish             	Sobre la base de esta posición , me parece que se puede enco...
Dutch               	Ik voel mij daardoor aangemoedigd omdat ik een brede consens...
Spanish             	Señor Presidente , Señorías , antes que nada , quisiera pron...
Italian             	Ricordo altresì , signora Presidente , che durante la preced...
Swedish             	Betänkande ( A5-0107 / 1999 ) av Berend för utskottet för re...
English             	This responsibility cannot only be borne by the Commissioner...
Portuguese          	A nossa leitura comum é que esse partido tem uma posição man...

With this classifier it is now also possible to predict the language of the randomized example snipplet from the introduction (which is acutally created from the first paragraph of this article):

example_text = "ogldviisnntmeyoiiesettpetorotrcitglloeleiengehorntsnraviedeenltseaecithooheinsnstiofwtoienaoaeefiitaeeauobmeeetdmsflteightnttxipecnlgtetgteyhatncdisaceahrfomseehmsindrlttdthoaranthahdgasaebeaturoehtrnnanftxndaeeiposttmnhgttagtsheitistrrcudf"
predict_lang(example_text)
'English'

The KNN classifier of sklearn also offers the possibility to predict the propability with which a given classification is made. While the probability distribution for a specific language is relativly clear for long sample texts it decreases noticeably the shorter the texts are.

def dict_invert(dictionary):
    ''' Inverts keys and values of a dictionary
    
    dict_invert(dictionary) -> collections.defaultdict(list)
    '''
    inverse_dict = defaultdict(list)
    for key, value in dictionary.items():
        inverse_dict[value].append(key)
    return inverse_dict

def get_propabilities(text, features=features):
    '''Prints the probability for every language of a given text
    
    get_propabilities(text, features)
    '''
    results = clf.predict_proba(extract_features(text, features=features).reshape(1, -1))
    for result in zip(clf.classes_, results[0]):
        print('%-20s' % result[0] + '%7s %%' % str(round(float(100 * result[1]), 4)))


example_text = 'ogldviisnntmeyoiiesettpetorotrcitglloeleiengehorntsnraviedeenltseaecithooheinsnstiofwtoienaoaeefiitaeeauobmeeetdmsflteightnttxipecnlgtetgteyhatncdisaceahrfomseehmsindrlttdthoaranthahdgasaebeaturoehtrnnanftxndaeeiposttmnhgttagtsheitistrrcudf'
print(example_text)
get_propabilities(example_text + '\n')
print('\n')
example_text2 = 'Dies ist ein kurzer Beispielsatz.'
print(example_text2)
get_propabilities(example_text2 + '\n')
ogldviisnntmeyoiiesettpetorotrcitglloeleiengehorntsnraviedeenltseaecithooheinsnstiofwtoienaoaeefiitaeeauobmeeetdmsflteightnttxipecnlgtetgteyhatncdisaceahrfomseehmsindrlttdthoaranthahdgasaebeaturoehtrnnanftxndaeeiposttmnhgttagtsheitistrrcudf
Danish                  0.0 %
Dutch                   0.0 %
English               100.0 %
Finnish                 0.0 %
French                  0.0 %
German                  0.0 %
Italian                 0.0 %
Portuguese              0.0 %
Spanish                 0.0 %
Swedish                 0.0 %


Dies ist ein kurzer Beispielsatz.
Danish                  0.0 %
Dutch                   0.0 %
English                 0.0 %
Finnish                 0.0 %
French              18.1818 %
German              72.7273 %
Italian              9.0909 %
Portuguese              0.0 %
Spanish                 0.0 %
Swedish                 0.0 %

Background and Insights

Why does a relative simple model like counting letters acutally work? Every language has a specific pattern of letter frequencies which can be used as a kind of fingerprint: While there are almost no y‘s in the german language this letter is quite common in english. In french the letter k is not very common because it is replaced with q in most cases.

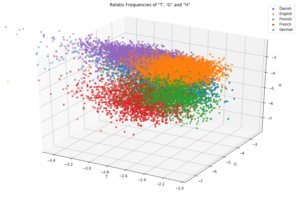
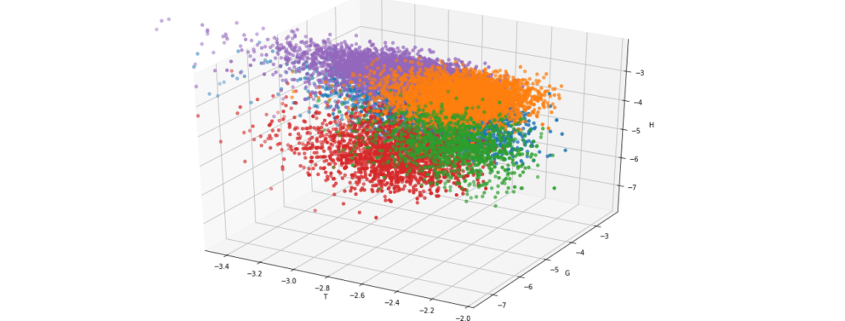
For a better understanding look at the output of the following code snipplet where only three letters already lead to a noticable form of clustering:

projection='3d')
legend = []
X, Y, Z = 'e', 'g', 'h'

def iterlog(ln):
    retvals = []
    for n in ln:
        try:
            retvals.append(np.log(n))
        except:
            retvals.append(None)
    return retvals

for X in ['t']:
    ax = plt.axes(projection='3d')
    ax.xy_viewLim.intervalx = [-3.5, -2]
    legend = []
    for lang in [l for l in df.groupby('lang') if l[0] in {'German', 'English', 'Finnish', 'French', 'Danish'}]:
        sample = lang[1].sample(4000)

        legend.append(lang[0])
        ax.scatter3D(iterlog(sample[X]), iterlog(sample[Y]), iterlog(sample[Z]))

    ax.set_title('log(10) of the Relativ Frequencies of "' + X.upper() + "', '" + Y.upper() + '" and "' + Z.upper() + '"\n\n')
    ax.set_xlabel(X.upper())
    ax.set_ylabel(Y.upper())
    ax.set_zlabel(Z.upper())
    plt.legend(legend)
    plt.show()


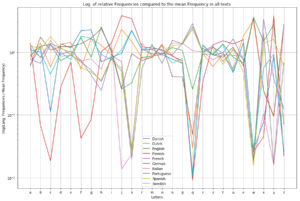
Even though every single letter frequency by itself is not a very reliable indicator, the set of frequencies of all present letters in a text is a quite good evidence because it will more or less represent the letter frequency fingerprint of the given language. Since it is quite hard to imagine or visualize the above plot in more than three dimensions, I used a little trick which shows that every language has its own typical fingerprint of letter frequencies:

legend = []
fig = plt.figure(figsize=(15, 10))
plt.axes(yscale='log')
    
langs = defaultdict(list)

for lang in [l for l in df.groupby('lang') if l[0] in set(df['lang'])]:
    for feature in 'abcdefghijklmnopqrstuvwxyz':
        langs[lang[0]].append(lang[1][feature].mean())

mean_frequencies = {feature:df[feature].mean() for feature in 'abcdefghijklmnopqrstuvwxyz'}
for i in langs.items():
    legend.append(i[0])
    j = np.array(i[1]) / np.array([mean_frequencies[c] for c in 'abcdefghijklmnopqrstuvwxyz'])
    plt.plot([c for c in 'abcdefghijklmnopqrstuvwxyz'], j)
plt.title('Log. of relative Frequencies compared to the mean Frequency in all texts')
plt.xlabel('Letters')
plt.ylabel('(log(Lang. Frequencies / Mean Frequency)')
plt.legend(legend)
plt.grid()
plt.show()

What more?

Beside the fact, that letter frequencies alone, allow us to predict the language of every example text (at least in the 10 languages with latin alphabet we trained for) with almost complete certancy there is even more information hidden in the set of sample texts.

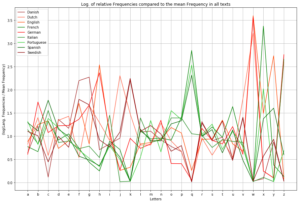
As you might know, most languages in europe belong to either the romanian or the indogermanic language family (which is actually because the romans conquered only half of europe). The border between them could be located in belgium, between france and germany and in swiss. West of this border the romanian languages, which originate from latin, are still spoken, like spanish, portouguese and french. In the middle and northern part of europe the indogermanic languages are very common like german, dutch, swedish ect. If we plot the analysed languages with a different colour sheme this border gets quite clear and allows us to take a look back in history that tells us where our languages originate from:

legend = []
fig = plt.figure(figsize=(15, 10))
plt.axes(yscale='linear')
    
langs = defaultdict(list)
for lang in [l for l in df.groupby('lang') if l[0] in {'German', 'English', 'French', 'Spanish', 'Portuguese', 'Dutch', 'Swedish', 'Danish', 'Italian'}]:
    for feature in 'abcdefghijklmnopqrstuvwxyz':
        langs[lang[0]].append(lang[1][feature].mean())

colordict = {l[0]:l[1] for l in zip([lang for lang in langs], ['brown', 'tomato', 'orangered',
                                                               'green', 'red', 'forestgreen', 'limegreen',
                                                               'darkgreen', 'darkred'])}
mean_frequencies = {feature:df[feature].mean() for feature in 'abcdefghijklmnopqrstuvwxyz'}
for i in langs.items():
    legend.append(i[0])
    j = np.array(i[1]) / np.array([mean_frequencies[c] for c in 'abcdefghijklmnopqrstuvwxyz'])
    plt.plot([c for c in 'abcdefghijklmnopqrstuvwxyz'], j, color=colordict[i[0]])
#     plt.plot([c for c in 'abcdefghijklmnopqrstuvwxyz'], i[1], color=colordict[i[0]])
plt.title('Log. of relative Frequencies compared to the mean Frequency in all texts')
plt.xlabel('Letters')
plt.ylabel('(log(Lang. Frequencies / Mean Frequency)')
plt.legend(legend)
plt.grid()
plt.show()

As you can see the more common letters, especially the vocals like a, e, i, o and u have almost the same frequency in all of this languages. Far more interesting are letters like q, k, c and w: While k is quite common in all of the indogermanic languages it is quite rare in romanic languages because the same sound is written with the letters q or c.
As a result it could be said, that even “boring” sets of data (just give it a try and read all the texts of the protocolls of the EU parliament…) could contain quite interesting patterns which – in this case – allows us to predict quite precisely which language a given text sample is written in, without the need of any translation program or to speak the languages. And as an interesting side effect, where certain things in history happend (or not happend): After two thousand years have passed, modern machine learning techniques could easily uncover this history because even though all these different languages developed, they still have a set of hidden but common patterns that since than stayed the same.

Sentiment Analysis using Python

One of the applications of text mining is sentiment analysis. Most of the data is getting generated in textual format and in the past few years, people are talking more about NLP. Improvement is a continuous process many product based companies leverage these text mining techniques to examine the sentiments of the customers to find about what they can improve in the product. This information also helps them to understand the trend and demand of the end user which results in Customer satisfaction.

As text mining is a vast concept, the article is divided into two subchapters. The main focus of this article will be calculating two scores: sentiment polarity and subjectivity using python. The range of polarity is from -1 to 1(negative to positive) and will tell us if the text contains positive or negative feedback. Most companies prefer to stop their analysis here but in our second article, we will try to extend our analysis by creating some labels out of these scores. Finally, a multi-label multi-class classifier can be trained to predict future reviews.

Without any delay let’s deep dive into the code and mine some knowledge from textual data.

There are a few NLP libraries existing in Python such as Spacy, NLTK, gensim, TextBlob, etc. For this particular article, we will be using NLTK for pre-processing and TextBlob to calculate sentiment polarity and subjectivity.

import pandas as pd
import matplotlib.pyplot as plt
%matplotlib inline  
import nltk
from nltk import word_tokenize, sent_tokenize
from nltk.corpus import stopwords
from nltk.stem import LancasterStemmer, WordNetLemmatizer, PorterStemmer
from wordcloud import WordCloud, STOPWORDS
from textblob import TextBlob

The dataset is available here for download and we will be using pandas read_csv function to import the dataset. I would like to share an additional information here which I came to know about recently. Those who have already used python and pandas before they probably know that read_csv is by far one of the most used function. However, it can take a while to upload a big file. Some folks from  RISELab at UC Berkeley created Modin or Pandas on Ray which is a library that speeds up this process by changing a single line of code.

amz_reviews = pd.read_csv("1429_1.csv")

After importing the dataset it is recommended to understand it first and study the structure of the dataset. At this point we are interested to know how many columns are there and what are these columns so I am going to check the shape of the data frame and go through each column name to see if we need them or not.

amz_reviews.shape
(34660, 21)

amz_reviews.columns
Index(['id', 'name', 'asins', 'brand', 'categories', 'keys', 'manufacturer',
       'reviews.date', 'reviews.dateAdded', 'reviews.dateSeen',
       'reviews.didPurchase', 'reviews.doRecommend', 'reviews.id',
       'reviews.numHelpful', 'reviews.rating', 'reviews.sourceURLs',
       'reviews.text', 'reviews.title', 'reviews.userCity',
       'reviews.userProvince', 'reviews.username'],
      dtype='object')


There are so many columns which are not useful for our sentiment analysis and it’s better to remove these columns. There are many ways to do that: either just select the columns which you want to keep or select the columns you want to remove and then use the drop function to remove it from the data frame. I prefer the second option as it allows me to look at each column one more time so I don’t miss any important variable for the analysis.

columns = ['id','name','keys','manufacturer','reviews.dateAdded', 'reviews.date','reviews.didPurchase',
          'reviews.userCity', 'reviews.userProvince', 'reviews.dateSeen', 'reviews.doRecommend','asins',
          'reviews.id', 'reviews.numHelpful', 'reviews.sourceURLs', 'reviews.title']

df = pd.DataFrame(amz_reviews.drop(columns,axis=1,inplace=False))

Now let’s dive deep into the data and try to mine some knowledge from the remaining columns. The first step we would want to follow here is just to look at the distribution of the variables and try to make some notes. First, let’s look at the distribution of the ratings.

df['reviews.rating'].value_counts().plot(kind='bar')

Graphs are powerful and at this point, just by looking at the above bar graph we can conclude that most people are somehow satisfied with the products offered at Amazon. The reason I am saying ‘at’ Amazon is because it is just a platform where anyone can sell their products and the user are giving ratings to the product and not to Amazon. However, if the user is satisfied with the products it also means that Amazon has a lower return rate and lower fraud case (from seller side). The job of a Data Scientist relies not only on how good a model is but also on how useful it is for the business and that’s why these business insights are really important.

Data pre-processing for textual variables

Lowercasing

Before we move forward to calculate the sentiment scores for each review it is important to pre-process the textual data. Lowercasing helps in the process of normalization which is an important step to keep the words in a uniform manner (Welbers, et al., 2017, pp. 245-265).

## Change the reviews type to string
df['reviews.text'] = df['reviews.text'].astype(str)

## Before lowercasing 
df['reviews.text'][2]
'Inexpensive tablet for him to use and learn on, step up from the NABI. He was thrilled with it, learn how to Skype on it 
already...'

## Lowercase all reviews
df['reviews.text'] = df['reviews.text'].apply(lambda x: " ".join(x.lower() for x in x.split()))
df['reviews.text'][2] ## to see the difference
'inexpensive tablet for him to use and learn on, step up from the nabi. he was thrilled with it, learn how to skype on it 
already...'

Special characters

Special characters are non-alphabetic and non-numeric values such as {!,@#$%^ *()~;:/<>|+_-[]?}. Dealing with numbers is straightforward but special characters can be sometimes tricky. During tokenization, special characters create their own tokens and again not helpful for any algorithm, likewise, numbers.

## remove punctuation
df['reviews.text'] = df['reviews.text'].str.replace('[^ws]','')
df['reviews.text'][2]
'inexpensive tablet for him to use and learn on step up from the nabi he was thrilled with it learn how to skype on it already'

Stopwords

Stop-words being most commonly used in the English language; however, these words have no predictive power in reality. Words such as I, me, myself, he, she, they, our, mine, you, yours etc.

stop = stopwords.words('english')
df['reviews.text'] = df['reviews.text'].apply(lambda x: " ".join(x for x in x.split() if x not in stop))
df['reviews.text'][2]
'inexpensive tablet use learn step nabi thrilled learn skype already'

Stemming

Stemming algorithm is very useful in the field of text mining and helps to gain relevant information as it reduces all words with the same roots to a common form by removing suffixes such as -action, ing, -es and -ses. However, there can be problematic where there are spelling errors.

st = PorterStemmer()
df['reviews.text'] = df['reviews.text'].apply(lambda x: " ".join([st.stem(word) for word in x.split()]))
df['reviews.text'][2]
'inexpens tablet use learn step nabi thrill learn skype alreadi'

This step is extremely useful for pre-processing textual data but it also depends on your goal. Here our goal is to calculate sentiment scores and if you look closely to the above code words like ‘inexpensive’ and ‘thrilled’ became ‘inexpens’ and ‘thrill’ after applying this technique. This will help us in text classification to deal with the curse of dimensionality but to calculate the sentiment score this process is not useful.

Sentiment Score

It is now time to calculate sentiment scores of each review and check how these scores look like.

## Define a function which can be applied to calculate the score for the whole dataset

def senti(x):
    return TextBlob(x).sentiment  

df['senti_score'] = df['reviews.text'].apply(senti)

df.senti_score.head()

0                                   (0.3, 0.8)
1                                (0.65, 0.675)
2                                   (0.0, 0.0)
3    (0.29545454545454547, 0.6492424242424243)
4                    (0.5, 0.5827777777777777)
Name: senti_score, dtype: object

As it can be observed there are two scores: the first score is sentiment polarity which tells if the sentiment is positive or negative and the second score is subjectivity score to tell how subjective is the text.

In my next article, we will extend this analysis by creating labels based on these scores and finally we will train a classification model.

Sentiment Analysis using Python

One of the applications of text mining is sentiment analysis. Most of the data is getting generated in textual format and in the past few years, people are talking more about NLP. Improvement is a continuous process and many product based companies leverage these text mining techniques to examine the sentiments of the customers to find about what they can improve in the product. This information also helps them to understand the trend and demand of the end user which results in Customer satisfaction.

As text mining is a vast concept, the article is divided into two subchapters. The main focus of this article will be calculating two scores: sentiment polarity and subjectivity using python. The range of polarity is from -1 to 1(negative to positive) and will tell us if the text contains positive or negative feedback. Most companies prefer to stop their analysis here but in our second article, we will try to extend our analysis by creating some labels out of these scores. Finally, a multi-label multi-class classifier can be trained to predict future reviews.

Without any delay let’s deep dive into the code and mine some knowledge from textual data.

There are a few NLP libraries existing in Python such as Spacy, NLTK, gensim, TextBlob, etc. For this particular article, we will be using NLTK for pre-processing and TextBlob to calculate sentiment polarity and subjectivity.

import pandas as pd
import matplotlib.pyplot as plt
%matplotlib inline  
import nltk
from nltk import word_tokenize, sent_tokenize
from nltk.corpus import stopwords
from nltk.stem import LancasterStemmer, WordNetLemmatizer, PorterStemmer
from wordcloud import WordCloud, STOPWORDS
from textblob import TextBlob

The dataset is available here for download and we will be using pandas read_csv function to import the dataset. I would like to share an additional information here which I came to know about recently. Those who have already used python and pandas before they probably know that read_csv is by far one of the most used function. However, it can take a while to upload a big file. Some folks from  RISELab at UC Berkeley created Modin or Pandas on Ray which is a library that speeds up this process by changing a single line of code.

amz_reviews = pd.read_csv("1429_1.csv")

After importing the dataset it is recommended to understand it first and study the structure of the dataset. At this point we are interested to know how many columns are there and what are these columns so I am going to check the shape of the data frame and go through each column name to see if we need them or not.

amz_reviews.shape
(34660, 21)

amz_reviews.columns
Index(['id', 'name', 'asins', 'brand', 'categories', 'keys', 'manufacturer',
       'reviews.date', 'reviews.dateAdded', 'reviews.dateSeen',
       'reviews.didPurchase', 'reviews.doRecommend', 'reviews.id',
       'reviews.numHelpful', 'reviews.rating', 'reviews.sourceURLs',
       'reviews.text', 'reviews.title', 'reviews.userCity',
       'reviews.userProvince', 'reviews.username'],
      dtype='object')


There are so many columns which are not useful for our sentiment analysis and it’s better to remove these columns. There are many ways to do that: either just select the columns which you want to keep or select the columns you want to remove and then use the drop function to remove it from the data frame. I prefer the second option as it allows me to look at each column one more time so I don’t miss any important variable for the analysis.

columns = ['id','name','keys','manufacturer','reviews.dateAdded', 'reviews.date','reviews.didPurchase',
          'reviews.userCity', 'reviews.userProvince', 'reviews.dateSeen', 'reviews.doRecommend','asins',
          'reviews.id', 'reviews.numHelpful', 'reviews.sourceURLs', 'reviews.title']

df = pd.DataFrame(amz_reviews.drop(columns,axis=1,inplace=False))

Now let’s dive deep into the data and try to mine some knowledge from the remaining columns. The first step we would want to follow here is just to look at the distribution of the variables and try to make some notes. First, let’s look at the distribution of the ratings.

df['reviews.rating'].value_counts().plot(kind='bar')

Graphs are powerful and at this point, just by looking at the above bar graph we can conclude that most people are somehow satisfied with the products offered at Amazon. The reason I am saying ‘at’ Amazon is because it is just a platform where anyone can sell their products and the user are giving ratings to the product and not to Amazon. However, if the user is satisfied with the products it also means that Amazon has a lower return rate and lower fraud case (from seller side). The job of a Data Scientist relies not only on how good a model is but also on how useful it is for the business and that’s why these business insights are really important.

Data pre-processing for textual variables

Lowercasing

Before we move forward to calculate the sentiment scores for each review it is important to pre-process the textual data. Lowercasing helps in the process of normalization which is an important step to keep the words in a uniform manner (Welbers, et al., 2017, pp. 245-265).

## Change the reviews type to string
df['reviews.text'] = df['reviews.text'].astype(str)

## Before lowercasing 
df['reviews.text'][2]
'Inexpensive tablet for him to use and learn on, step up from the NABI. He was thrilled with it, learn how to Skype on it 
already...'

## Lowercase all reviews
df['reviews.text'] = df['reviews.text'].apply(lambda x: " ".join(x.lower() for x in x.split()))
df['reviews.text'][2] ## to see the difference
'inexpensive tablet for him to use and learn on, step up from the nabi. he was thrilled with it, learn how to skype on it 
already...'

Special characters

Special characters are non-alphabetic and non-numeric values such as {!,@#$%^ *()~;:/<>|+_-[]?}. Dealing with numbers is straightforward but special characters can be sometimes tricky. During tokenization, special characters create their own tokens and again not helpful for any algorithm, likewise, numbers.

## remove punctuation
df['reviews.text'] = df['reviews.text'].str.replace('[^ws]','')
df['reviews.text'][2]
'inexpensive tablet for him to use and learn on step up from the nabi he was thrilled with it learn how to skype on it already'

Stopwords

Stop-words being most commonly used in the English language; however, these words have no predictive power in reality. Words such as I, me, myself, he, she, they, our, mine, you, yours etc.

stop = stopwords.words('english')
df['reviews.text'] = df['reviews.text'].apply(lambda x: " ".join(x for x in x.split() if x not in stop))
df['reviews.text'][2]
'inexpensive tablet use learn step nabi thrilled learn skype already'

Stemming

Stemming algorithm is very useful in the field of text mining and helps to gain relevant information as it reduces all words with the same roots to a common form by removing suffixes such as -action, ing, -es and -ses. However, there can be problematic where there are spelling errors.

st = PorterStemmer()
df['reviews.text'] = df['reviews.text'].apply(lambda x: " ".join([st.stem(word) for word in x.split()]))
df['reviews.text'][2]
'inexpens tablet use learn step nabi thrill learn skype alreadi'

This step is extremely useful for pre-processing textual data but it also depends on your goal. Here our goal is to calculate sentiment scores and if you look closely to the above code words like ‘inexpensive’ and ‘thrilled’ became ‘inexpens’ and ‘thrill’ after applying this technique. This will help us in text classification to deal with the curse of dimensionality but to calculate the sentiment score this process is not useful.

Sentiment Score

It is now time to calculate sentiment scores of each review and check how these scores look like.

## Define a function which can be applied to calculate the score for the whole dataset

def senti(x):
    return TextBlob(x).sentiment  

df['senti_score'] = df['reviews.text'].apply(senti)

df.senti_score.head()

0                                   (0.3, 0.8)
1                                (0.65, 0.675)
2                                   (0.0, 0.0)
3    (0.29545454545454547, 0.6492424242424243)
4                    (0.5, 0.5827777777777777)
Name: senti_score, dtype: object

As it can be observed there are two scores: the first score is sentiment polarity which tells if the sentiment is positive or negative and the second score is subjectivity score to tell how subjective is the text. The whole code is available here.

In my next article, we will extend this analysis by creating labels based on these scores and finally we will train a classification model.