Tag Archive for: Statistics

Understanding Linear Regression with all Statistical Terms

Linear Regression Model – This article is about understanding the linear regression with all the statistical terms.

What is Regression Analysis?

regression is an attempt to determine the relationship between one dependent and a series of other independent variables.

Regression analysis is a form of predictive modelling technique which investigates the relationship between a dependent (target) and independent variable (s) (predictor). This technique is used for forecasting, time series modelling and finding the causal effect relationship between the variables. For example, relationship between rash driving and number of road accidents by a driver is best studied through regression.

Why do we use Regression Analysis?

As mentioned above, regression analysis estimates the relationship between two or more variables. Let’s understand this with an easy example:

Let’s say, you want to estimate growth in sales of a company based on current economic conditions. You have the recent company data which indicates that the growth in sales is around two and a half times the growth in the economy. Using this insight, we can predict future sales of the company based on current & past information.

There are multiple benefits of using regression analysis. They are as follows:

It indicates the significant relationships between dependent variable and independent variable. It indicates the strength of impact of multiple independent variables on a dependent variable. Regression analysis also allows us to compare the effects of variables measured on different scales, such as the effect of price changes and the number of promotional activities. These benefits help market researchers / data analysts / data scientists to eliminate and evaluate the best set of variables to be used for building predictive models.

There are various kinds of regression techniques available to make predictions. These techniques are mostly driven by three metrics (number of independent variables, type of dependent variables and shape of regression line).
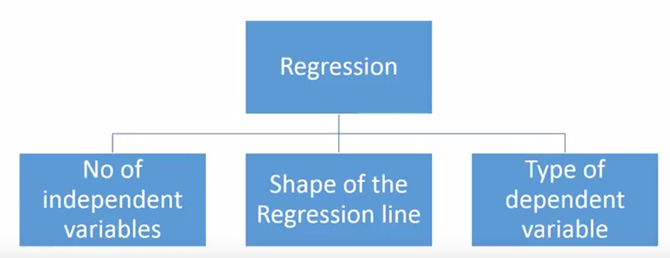
Number of independent variables, shape of regression line and type of dependent variable.

Number of independent variables, shape of regression line and type of dependent variable.

What is Linear Regression?

Linear Regression is the supervised Machine Learning model in which the model finds the best fit linear line between the independent and dependent variable i.e it finds the linear relationship between the dependent and independent variable.

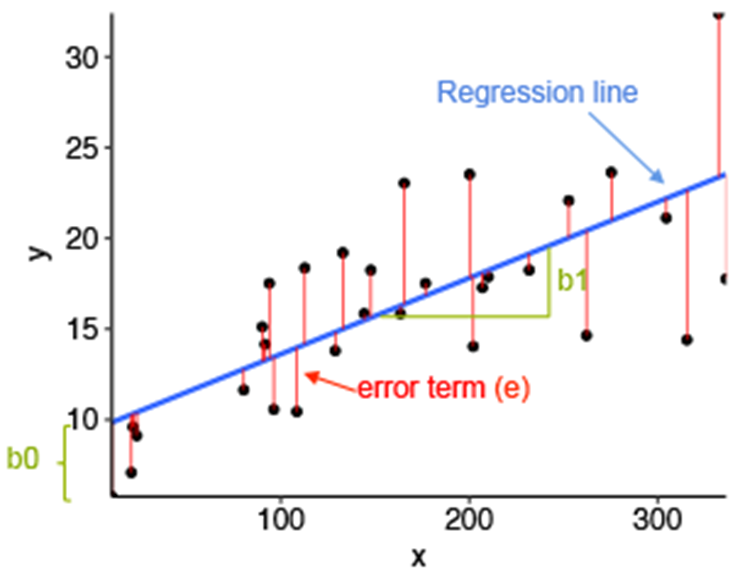
  • Equation of Simple Linear Regression, where bo is the intercept, b1 is coefficient or slope, x is the independent variable and y is the dependent variable.

Equation of Multiple Linear Regression, where bo is the intercept, b1,b2,b3,b4…,bn are coefficients or slopes of the independent variables x1,x2,x3,x4…,xn and y is the y=b_0+b_1x_1+b_2x_2+…+b_nx_n dependent variable.

Linear regression and its error termin per value

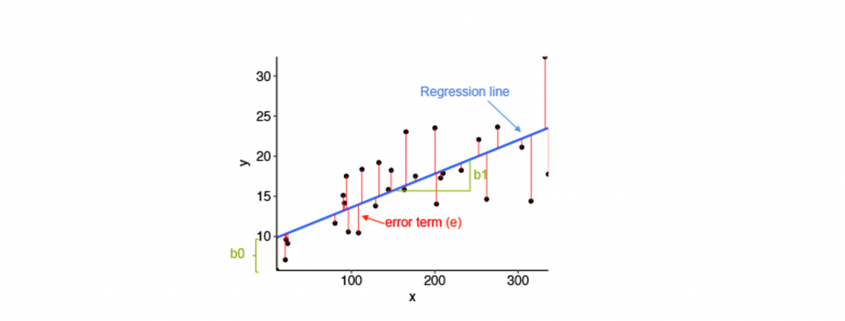
Linear regression and its error termin per value

Mathematical Approach:

Residual/Error = Actual values – Predicted Values
Sum of Residuals/Errors = Sum(Actual- Predicted Values)
Square of Sum of Residuals/Errors = (Sum(Actual- Predicted Values))^2

\sum(e_i^2)=\sum(y_i-\hat{y_i})^2

Application of Linear Regression:

Real-world examples of linear regression models
  1. Businesses often use linear regression to understand the relationship between advertising spending and revenue.
  2. Medical researchers often use linear regression to understand the relationship between drug dosage and blood pressure of patients.
  3. Agricultural scientists often use linear regression to measure the effect of fertilizer and water on crop yields.
  4. Data scientists for professional sports teams often use linear regression to measure the effect that different training regimens have on player performance.
  5. Stock predictions: A lot of businesses use linear regression models to predict how stocks will perform in the future. This is done by analyzing past data on stock prices and trends to identify patterns.
  6. Predicting consumer behavior: Businesses can use linear regression to predict things like how much a customer is likely to spend. Regression models can also be used to predict consumer behavior. This can be helpful for things like targeted marketing and product development. For example, Walmart uses linear regression to predict what products will be popular in different regions of the country.

Assumptions of Linear Regression:

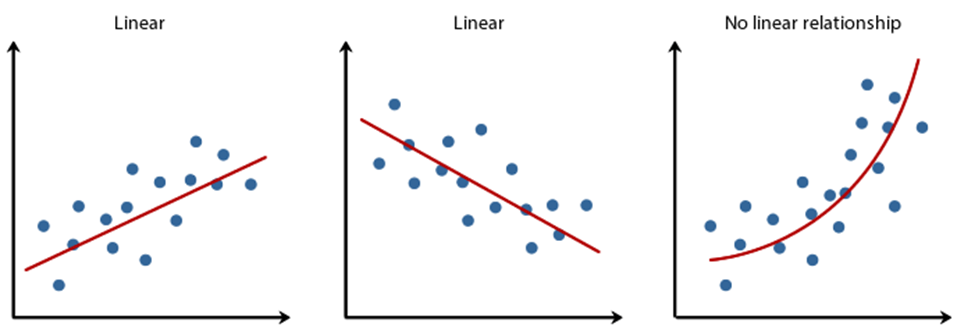
Linearity: It states that the dependent variable Y should be linearly related to independent variables. This assumption can be checked by plotting a scatter plot between both variables.
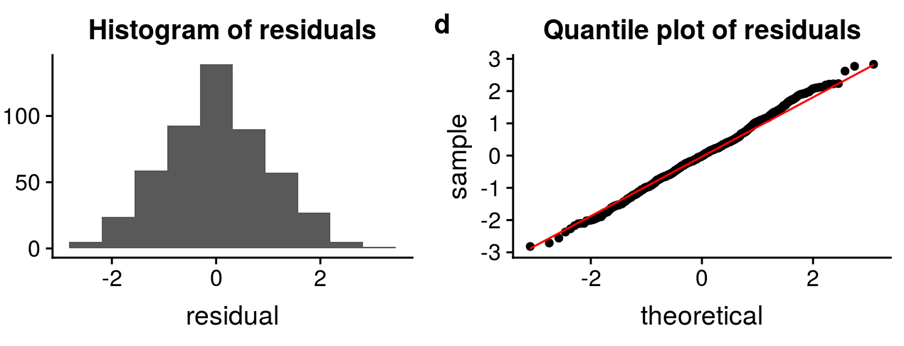
Normality: The X and Y variables should be normally distributed. Histograms, KDE plots, Q-Q plots can be used to check the Normality assumption.

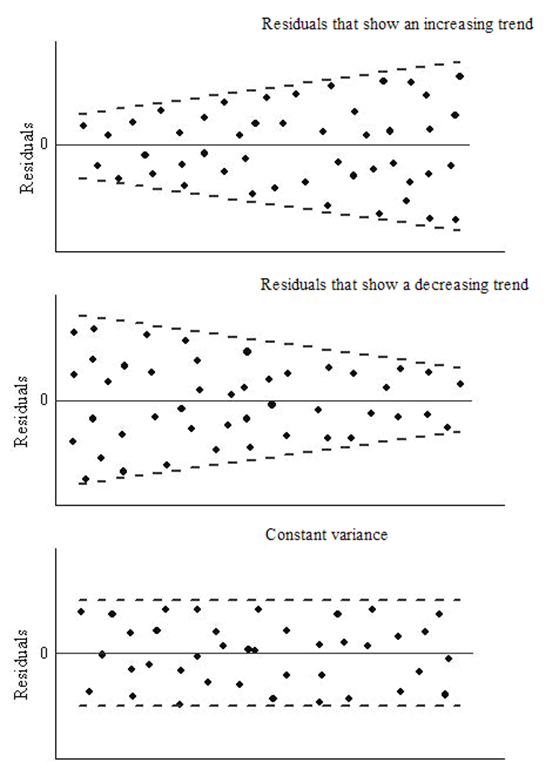
Homoscedasticity: The variance of the error terms should be constant i.e the spread of residuals should be constant for all values of X. This assumption can be checked by plotting a residual plot. If the assumption is violated then the points will form a funnel shape otherwise they will be constant.
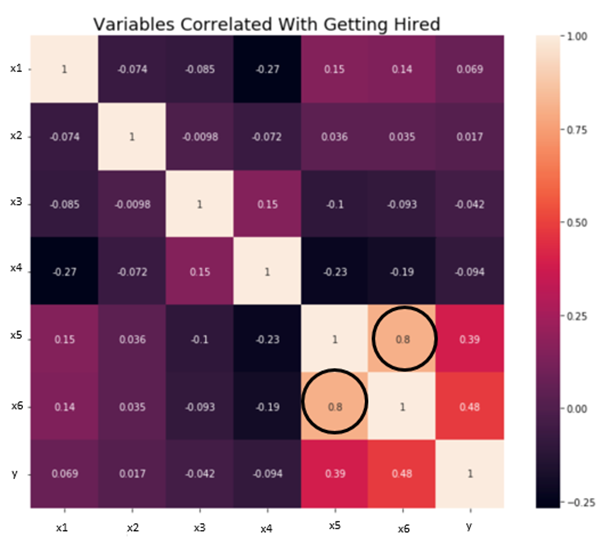
Independence/No Multicollinearity: The variables should be independent of each other i.e no correlation should be there between the independent variables. To check the assumption, we can use a correlation matrix or VIF score. If the VIF score is greater than 5 then the variables are highly correlated.
The error terms should be normally distributed. Q-Q plots and Histograms can be used to check the distribution of error terms.
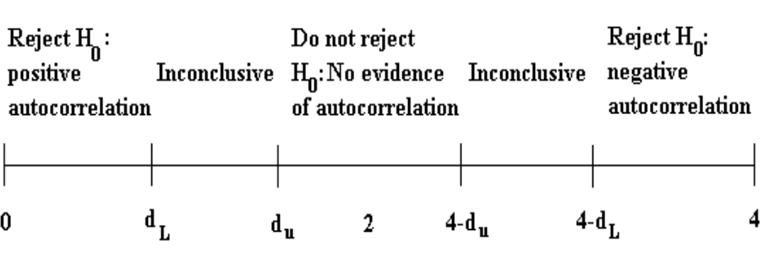
No Autocorrelation: The error terms should be independent of each other. Autocorrelation can be tested using the Durbin Watson test. The null hypothesis assumes that there is no autocorrelation. The value of the test lies between 0 to 4. If the value of the test is 2 then there is no autocorrelation.


Web Scraping Using R..!

In this blog, I’ll show you, How to Web Scrape using R..?

What is R..?

R is a programming language and its environment built for statistical analysis, graphical representation & reporting. R programming is mostly preferred by statisticians, data miners, and software programmers who want to develop statistical software.

R is also available as Free Software under the terms of the Free Software Foundation’s GNU General Public License in source code form.

Reasons to choose R

Reasons to choose R

Let’s begin our topic of Web Scraping using R.

Step 1- Select the website & the data you want to scrape.

I picked this website “https://www.alexa.com/topsites/countries/IN” and want to scrape data of Top 50 sites in India.

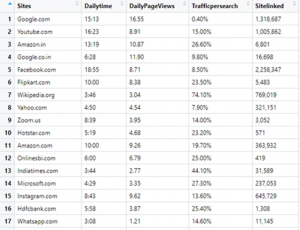
Data we want to scrape

Data we want to scrape

Step 2- Get to know the HTML tags using SelectorGadget.

In my previous blog, I already discussed how to inspect & find the proper HTML tags. So, now I’ll explain an easier way to get the HTML tags.

You have to go to Google chrome extension (chrome://extensions) & search SelectorGadget. Add it to your browser, it’s a quite good CSS selector.

Step 3- R Code

Evoking Important Libraries or Packages

I’m using RVEST package to scrape the data from the webpage; it is inspired by libraries like Beautiful Soup. If you didn’t install the package yet, then follow the code in the snippet below.

Step 4- Set the url of the website

Step 5- Find the HTML tags using SelectorGadget

It’s quite easy to find the proper HTML tags in which your data is present.

Firstly, I have to click on data using SelectorGadget which I want to scrape, it automatically selects the data which are similar to selected HTML tags. Before going forward, cross-check the selected values, are they correct or some junk data is also gets selected..? If you noticed our page has only 50 values, but you can see 156 values are selected.

Selection by SelectorGadget

Selection by SelectorGadget

So I need to remove unwanted values who get selected, once you click on them to deselect it, it turns red and others will turn yellow except our primary selection which turn to green. Now you can see only 50 values are selected as per our primary requirement but it’s not enough. I have to again cross-check that some required values are not exchanged with junk values.

If we satisfy with our selection then copy the HTML tag & include it into the code, else repeat this exercise.

Modified Selection by SelectorGadget

Step 6- Include the tag in our Code

After including the tags, our code is like this.

Code Snippet

If I run the code, values in each list object will be 50.

Data Stored in List Objects

Step 7- Creating DataFrame

Now, we create a dataframe with our list-objects. So for creating a dataframe, we always need to remember one thumb rule that is the number of rows (length of all the lists) should be equal, else we get an error.

Error appears when number of rows differs

Finally, Our DataFrame will look like this:

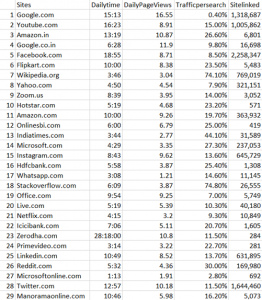
Our Final Data

Step 8- Writing our DataFrame to CSV file

We need our scraped data to be available locally for further analysis & model building or other purposes.

Our final piece of code to write it in CSV file is:

Writing to CSV file

Step 9- Check the CSV file

Data written in CSV file

Conclusion-

I tried to explain Web Scraping using R in a simple way, Hope this will help you in understanding it better.

Find full code on

https://github.com/vgyaan/Alexa/blob/master/webscrap.R

If you have any questions about the code or web scraping in general, reach out to me on LinkedIn!

Okay, we will meet again with the new exposer.

Till then,

Happy Coding..!

Hypothesis Test for real problems

Hypothesis tests are significant for evaluating answers to questions concerning samples of data.

A statistical hypothesis is a belief made about a population parameter. This belief may or might not be right. In other words, hypothesis testing is a proper technique utilized by scientist to support or reject statistical hypotheses. The foremost ideal approach to decide if a statistical hypothesis is correct is examine the whole population.

Since that’s frequently impractical, we normally take a random sample from the population and inspect the equivalent. Within the event sample data set isn’t steady with the statistical hypothesis, the hypothesis is refused.

Types of hypothesis:

There are two sort of hypothesis and both the Null Hypothesis (Ho) and Alternative Hypothesis (Ha) must be totally mutually exclusive events.

• Null hypothesis is usually the hypothesis that the event wont’t happen.

• Alternative hypothesis is a hypothesis that the event will happen.

Why we need Hypothesis Testing?

Suppose a specific cosmetic producing company needs to launch a new Shampoo in the market. For this situation they will follow Hypothesis Testing all together decide the success of new product in the market.

Where likelihood of product being ineffective in market is undertaken as Null Hypothesis and likelihood of product being profitable is undertaken as Alternative Hypothesis. By following the process of Hypothesis testing they will foresee the accomplishment.

How to Calculate Hypothesis Testing?

  • State the two theories with the goal that just one can be correct, to such an extent that the two occasions are totally unrelated.
  • Now figure a study plan, that will lay out how the data will be assessed.
  • Now complete the plan and genuinely investigate the sample dataset.
  • Finally examine the outcome and either accept or reject the null hypothesis.

Another example

Assume, Person have gone after a typing job and he has expressed in the resume that his composing speed is 70 words per minute. The recruiter might need to test his case. On the off chance that he sees his case as adequate, he will enlist him in any case reject him. Thus, he types an example letter and found that his speed is 63 words a minute. Presently, he can settle on whether to employ him or not.  In the event that he meets all other qualification measures. This procedure delineates Hypothesis Testing in layman’s terms.

In statistical terms Hypothesis his typing speed is 70 words per minute is a hypothesis to be tested so-called null hypothesis. Clearly, the alternating hypothesis his composing speed isn’t 70 words per minute.

So, normal composing speed is population parameter and sample composing speed is sample statistics.

The conditions of accepting or rejecting his case is to be chosen by the selection representative. For instance, he may conclude that an error of 6 words is alright to him so he would acknowledge his claim between 64 to 76 words per minute. All things considered, sample speed 63 words per minute will close to reject his case. Furthermore, the choice will be he was producing a fake claim.

In any case, if the selection representative stretches out his acceptance region to positive/negative 7 words that is 63 to 77 words, he would be tolerating his case.

In this way, to finish up, Hypothesis Testing is a procedure to test claims about the population dependent on sample. It is a fascinating reasonable subject with a quite statistical jargon. You have to dive more to get familiar with the details.

Significance Level and Rejection Region for Hypothesis

Type I error probability is normally indicated by α and generally set to 0.05.  The value of α is recognized as the significance level.

The rejection region is the set of sample data that prompts the rejection of the null hypothesis.  The significance level, α, decides the size of the rejection region.  Sample results in the rejection region are labelled statistically significant at level of α .

The impact of differing α is that If α is small, for example, 0.01, the likelihood of a type I error is little, and a ton of sample evidence for the alternative hypothesis is needed before the null hypothesis can be dismissed. Though, when α is bigger, for example, 0.10, the rejection region is bigger, and it is simpler to dismiss the null hypothesis.

Significance from p-values

A subsequent methodology is to evade the utilization of a significance level and rather just report how significant the sample evidence is. This methodology is as of now more widespread.  It is accomplished by method of a p value. P value is gauge of power of the evidence against null hypothesis. It is the likelihood of getting the observed value of test statistic, or value with significantly more prominent proof against null hypothesis (Ho), if the null hypothesis of an investigation question is true. The less significant the p value, the more proof there is supportive of the alternative hypothesis. Sample evidence is measurably noteworthy at the α level just if the p value is less than α. They have an association for two tail tests. When utilizing a confidence interval to playout a two-tailed hypothesis test, reject the null hypothesis if and just if the hypothesized value doesn’t lie inside a confidence interval for the parameter.

Hypothesis Tests and Confidence Intervals

Hypothesis tests and confidence intervals are cut out of the same cloth. An event whose 95% confidence interval reject the hypothesis is an event for which p<0.05 under the relating hypothesis test, and the other way around. A p value is letting you know the greatest confidence interval that despite everything prohibits the hypothesis. As such, if p<0.03 against the null hypothesis, that implies that a 97% confidence interval does exclude the null hypothesis.

Hypothesis Tests for a Population Mean

We do a t test on the ground that the population mean is unknown. The general purpose is to contrast sample mean with some hypothetical population mean, to assess whether the watched the truth is such a great amount of unique in relation to the hypothesis that we can say with assurance that the hypothetical population mean isn’t, indeed, the real population mean.

Hypothesis Tests for a Population Proportion

At the point when you have two unique populations Z test facilitates you to choose if the proportion of certain features is the equivalent or not in the two populations. For instance, if the male proportion is equivalent between two nations.

Hypothesis Test for Equal Population Variances

F Test depends on F distribution and is utilized to think about the variance of the two impartial samples. This is additionally utilized with regards to investigation of variance for making a decision about the significance of more than two sample.

T test and F test are totally two unique things. T test is utilized to evaluate the population parameter, for example, population mean, and is likewise utilized for hypothesis testing for population mean. However, it must be utilized when we don’t know about population standard deviation. On the off chance that we know the population standard deviation, we will utilize Z test. We can likewise utilize T statistic to approximate population mean. T statistic is likewise utilised for discovering the distinction in two population mean with the assistance of sample means.

Z statistic or T statistic is utilized to assess population parameters such as population mean and population proportion. It is likewise used for testing hypothesis for population mean and population proportion. In contrast to Z statistic or T statistic, where we manage mean and proportion, Chi Square or F test is utilized for seeing if there is any variance inside the samples. F test is the proportion of fluctuation of two samples.

Conclusion

Hypothesis encourages us to make coherent determinations, the connection among variables, and gives the course to additionally investigate. Hypothesis for the most part results from speculation concerning studied behaviour, natural phenomenon, or proven theory. An honest hypothesis ought to be clear, detailed, and reliable with the data. In the wake of building up the hypothesis, the following stage is validating or testing the hypothesis. Testing of hypothesis includes the process that empowers to concur or differ with the expressed hypothesis.

A common trap when it comes to sampling from a population that intrinsically includes outliers

I will discuss a common fallacy concerning the conclusions drawn from calculating a sample mean and a sample standard deviation and more importantly how to avoid it.

Suppose you draw a random sample x_1, x_2, … x_N of size N and compute the ordinary (arithmetic) sample mean  x_m and a sample standard deviation sd from it.  Now if (and only if) the (true) population mean µ (first moment) and population variance (second moment) obtained from the actual underlying PDF  are finite, the numbers x_m and sd make the usual sense otherwise they are misleading as will be shown by an example.

By the way: The common correlation coefficient will also be undefined (or in practice always point to zero) in the presence of infinite population variances. Hopefully I will create an article discussing this related fallacy in the near future where a suitable generalization to Lévy-stable variables will be proposed.

 Drawing a random sample from a heavy tailed distribution and discussing certain measures

As an example suppose you have a one dimensional random walker whose step length is distributed by a symmetric standard Cauchy distribution (Lorentz-profile) with heavy tails, i.e. an alpha-stable distribution with alpha being equal to one. The PDF of an individual independent step is given by p(x) = \frac{\pi^{-1}}{(1 + x^2)} , thus neither the first nor the second moment exist whereby the first exists and vanishes at least in the sense of a principal value due to symmetry.

Still let us generate N = 3000 (pseudo) standard Cauchy random numbers in R* to analyze the behavior of their sample mean and standard deviation sd as a function of the reduced sample size n \leq N.

*The R-code is shown at the end of the article.

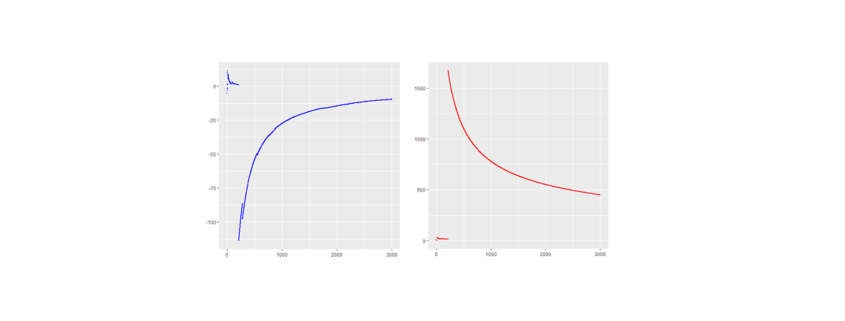
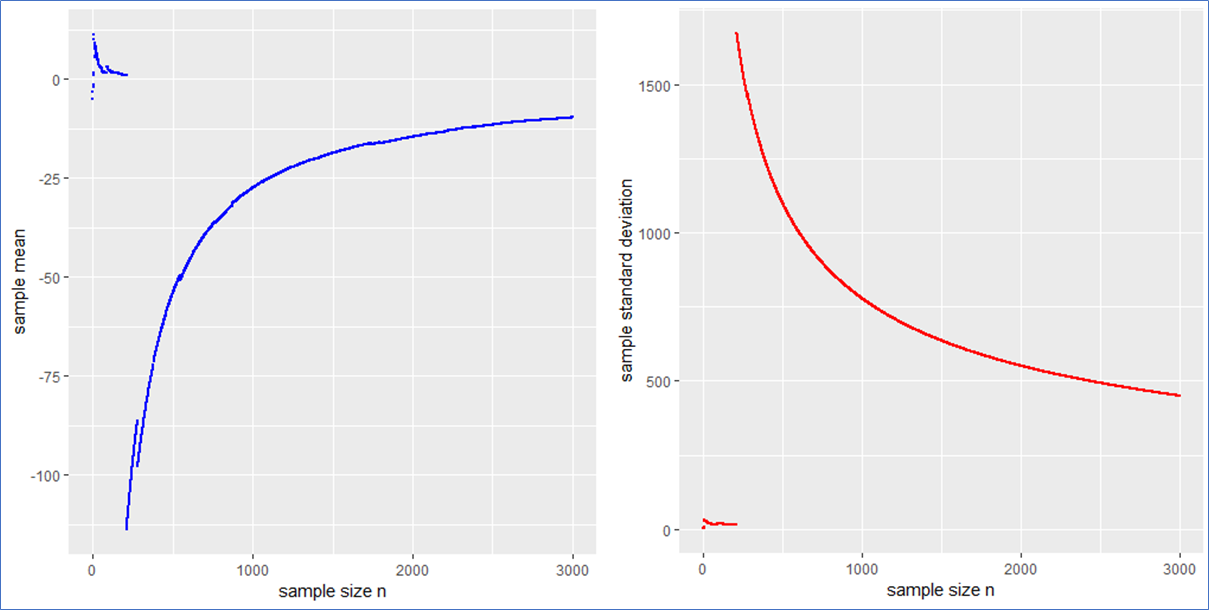
Here are the piecewise sample mean (in blue) and standard deviation (in red) for the mentioned Cauchy sampling. We see that both the sample mean and sd include jumps and do not converge.

Especially the mean deviates relatively largely from zero even after 3000 observations. The sample sd has no target due to the population variance being infinite.

If the data is new and no prior distribution is known, computing the sample mean and sd will be misleading. Astonishingly enough the sample mean itself will have the (formally exact) same distribution as the single step length p(x). This means that the sample mean is also standard Cauchy distributed implying that with a different Cauchy sample one could have easily observed different sample means far of the presented values in blue.

What sense does it make to present the usual interval x_m \pm sd / \sqrt{N} in such a case? What to do?

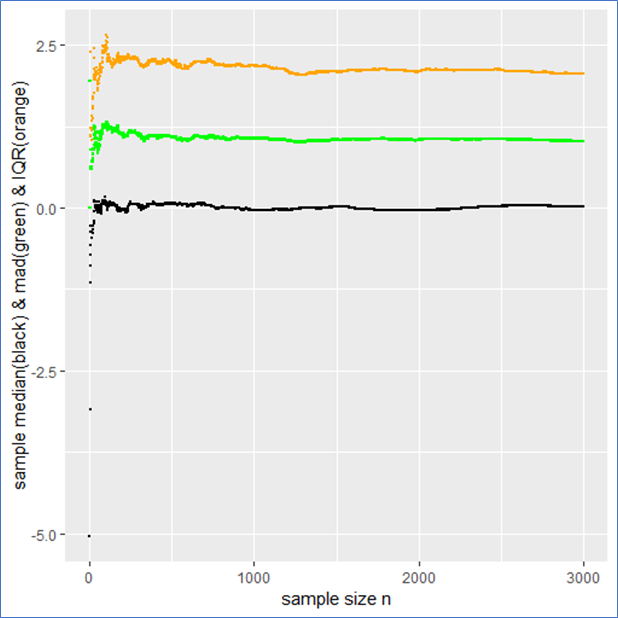
The sample median, median absolute difference (mad) and Inter-Quantile-Range (IQR) are more appropriate to describe such a data set including outliers intrinsically. To make this plausible I present the following plot, whereby the median is shown in black, the mad in green and the IQR in orange.

This example shows that the median, mad and IQR converge quickly against their assumed values and contain no major jumps. These quantities do an obviously better job in describing the sample. Even in the presence of outliers they remain robust, whereby the mad converges more quickly than the IQR. Note that a standard Cauchy sample will contain half of its sample in the interval median \pm mad meaning that the IQR is twice the mad.

Drawing a random sample from a PDF that has finite moments

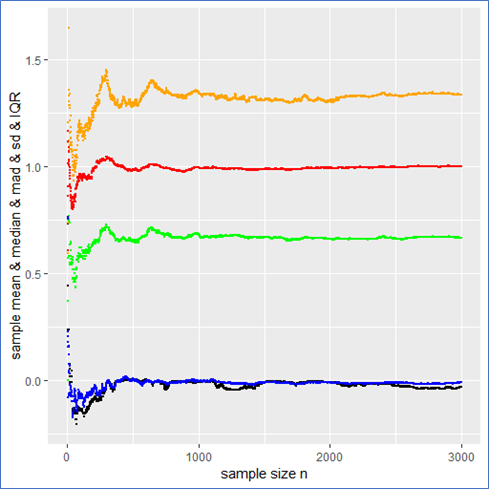
Just for comparison I also show the above quantities for a standard normal (pseudo) sample labeled with the same color as before as a counter example. In this case not only do both the sample mean and median but also the sd and mad converge towards their expected values (see plot below). Here all the quantities describe the data set properly and there is no trap since there are no intrinsic outliers. The sample mean itself follows a standard normal, so that the sd in deed makes sense and one could calculate a standard error \frac{sd}{\sqrt{N}} from it to present the usual stochastic confidence intervals for the sample mean.

A careful observation shows that in contrast to the Cauchy case here the sampled mean and sd converge more quickly than the sample median and the IQR. However still the sampled mad performs about as well as the sd. Again the mad is twice the IQR.

And here are the graphs of the prementioned quantities for a pseudo normal sample:

The take-home-message:

Just be careful when you observe outliers and calculate sample quantities right away, you might miss something. At best one carefully observes how the relevant quantities change with sample size as demonstrated in this article.

Such curves should become of broader interest in order to improve transparency in the Data Science process and reduce fallacies as well.

Thank you for reading.

P.S.: Feel free to play with the set random seed in the R-code below and observe how other quantities behave with rising sample size. Of course you can also try different PDFs at the beginning of the code. You can employ a Cauchy, Gaussian, uniform, exponential or Holtsmark (pseudo) random sample.


QUIZ: Which one of the recently mentioned random samples contains a trap** and why?

**in the context of this article


R-code used to generate the data and for producing plots:


#R-script for emphasizing convergence and divergence of sample means

####install and load relevant packages ####

#uncomment these lines if necessary
#install.packages(c('ggplot2',’stabledist’))
#library(ggplot2)
#library(stabledist)

#####drawing random samples #####

#Setting a random seed for being able to reproduce results  
set.seed(1234567)   
N= 2000     #sample size

#Choose a PDF from which a sample shall be drawn
#To do so (un)comment the respective lines of following code

data <- rcauchy(N)    # option1(default): standard Cauchy sampling

#data <- rnorm(N)     #option2: standard Gaussian sampling
                               
#data <- rexp(N)    # option3: standard exponential sampling

#data <- rstable(N,alpha=1.5,beta=0)  # option4: standard symmetric Holtsmark sampling

#data <- runif(N)              #option5: standard uniform sample

#####descriptive statistics####
#preparations/declarations

SUM = vector()
sd =vector()
mean = vector()
SQ =vector()
SQUARES = vector()
median = vector()
mad =vector()
quantiles = data.frame()
sem =vector()

#piecewise calculaion of descrptive quantities

for (k in 1:length(data)){              #mainloop
SUM[k] <- sum(data[1:k])            # sum of sample
mean[k] <- mean(data[1:k])          # arithmetic mean
sd[k] <- sd(data[1:k])              # standard deviation
sem[k] <- sd[k]/(sqrt(k))          #standard error of the sample mean (for finite variances)
mad[k] <- mad(data[1:k],const=1)   # median absolute deviation    

for (j in 1:5){
qq <- quantile(data[1:k],na.rm = T)
quantiles[k,j] <- qq[j]         #quantiles of sample
}
colnames(quantiles) <- c('min','Q1','median','Q3','max')

for (i in 1:length(data[1:k])){
SQUARES[i] <- data[i]*data[i]    
}
SQ[k] <- sum(SQUARES[1:k])    #sum of squares of random sample
}  #end of mainloop

#create table containing all relevant data
TABLE <-  as.data.frame(cbind(quantiles,mean,sd,SQ,SUM,sem))


#####plotting results###
x11()
print(ggplot(TABLE,aes(1:N,median))+
geom_point(size=.5)+xlab('sample size n')+ylab('sample median'))
x11()
print(ggplot(TABLE,aes(1:N,mad))+geom_point(size=.5,color ='green')+
xlab('sample size n')+ylab('sample median absolute difference'))
x11()
print(ggplot(TABLE,aes(1:N,sd))+geom_point(size=.5,color ='red')+
xlab('sample size n')+ylab('sample standard deviation'))
x11()
print(ggplot(TABLE,aes(1:N,mean))+geom_point(size=.5, color ='blue')+
xlab('sample size n')+ylab('sample mean'))
x11()
print(ggplot(TABLE,aes(1:N,Q3-Q1))+geom_point(size=.5, color ='blue')+
xlab('sample size n')+ylab('IQR'))

#uncomment the following lines of code to see further plots

#x11()
#print(ggplot(TABLE,aes(1:N,sem))+geom_point(size=.5)+
#xlab('sample size n')+ylab('sample sum of r.v.'))
#x11()
#print(ggplot(TABLE,aes(1:N,SUM))+geom_point(size=.5)+
#xlab('sample size n')+ylab('sample sum of r.v.'))
#x11()
#print(ggplot(TABLE,aes(1:N,SQ))+geom_point(size=.5)+
#xlab('sample size n')+ylab('sample sum of squares'))


Statistical Relational Learning – Part 2

In the first part of this series onAn Introduction to Statistical Relational Learning”, I touched upon the basic Machine Learning paradigms, some background and intuition of the concepts and concluded with how the MLN template looks like. In this blog, we will dive in to get an in depth knowledge on the MLN template; again with the help of sample examples. I would then conclude by highlighting the various toolkit available and some of its differentiating features.

MLN Template – explained

A Markov logic network can be thought of as a group of formulas incorporating first-order logic and also tied with a weight. But what exactly does this weight signify?

Weight Learning

According to the definition, it is the log odds between a world where F is true and a world where F is false,

and captures the marginal distribution of the corresponding predicate.

Each formula can be associated with some weight value, that is a positive or negative real number. The higher the value of weight, the stronger the constraint represented by the formula. In contrast to classical logic, all worlds (i.e., Herbrand Interpretations) are possible with a certain probability [1]. The main idea behind this is that the probability of a world increases as the number of formulas it violates decreases.

Markov logic networks with its probabilistic approach combined to logic posit that a world is less likely if it violates formulas unlike in pure logic where a world is false if it violates even a single formula. Consider the case when a formula with high weight i.e. more significance is violated implying that it is less likely in occurrence.

Another important concept during the first phase of Weight Learning while applying an MLN template is “Grounding”. Grounding means to replace each variable/function in predicate with constants from the domain.

Weight Learning – An Example

Note: All examples are highlighted in the Alchemy MLN format

Let us consider an example where we want to identify the relationship between 2 different types of verb-noun pairs i.e noun subject and direct object.

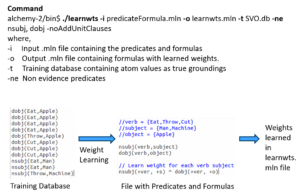
The input predicateFormula.mln file contains

  1. The predicates nsubj(verb, subject) and dobj(verb, object) and
  2. Formula of nsubj(+ver, +s) and dobj(+ver, +o)

These predicates or rules are to learn all possible SVO combinations i.e. what is the probability of a Subject-Verb-Object combination. The + sign ensures a cross product between the domains and learns all combinations. The training database consists of the nsubj and dobj tuples i.e. relations is the evidence used to learn the weights.

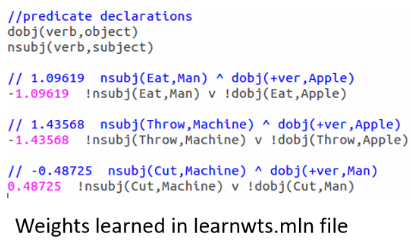
When we run the above command for this set of rules against the training evidence, we learn the weights as here:

Note that the formula is now grounded by all occurrences of nsubj and dobj tuples from the training database or evidence and the weights are attached to it at the start of each such combination.

But it should be noted that there is no network yet and this is just a set of weighted first-order logic formulas. The MLN template we created so far will generate Markov networks from all of our ground formulas. Internally, it is represented as a factor graph.where each ground formula is a factor and all the ground predicates found in the ground formula are linked to the factor.

Inference

The definition goes as follows:

Estimate probability distribution encoded by a graphical model, for a given data (or observation).

Out of the many Inference algorithms, the two major ones are MAP & Marginal Inference. For example, in a MAP Inference we find the most likely state of world given evidence, where y is the query and x is the evidence.

which is in turn equivalent to this formula.

Another is the Marginal Inference which computes the conditional probability of query predicates, given some evidence. Some advanced inference algorithms are Loopy Belief Propagation, Walk-SAT, MC-SAT, etc.

The probability of a world is given by the weighted sum of all true groundings of a formula i under an exponential function, divided by the partition function Z i.e. equivalent to the sum of the values of all possible assignments. The partition function acts a normalization constant to get the probability values between 0 and 1.

Inference – An Example

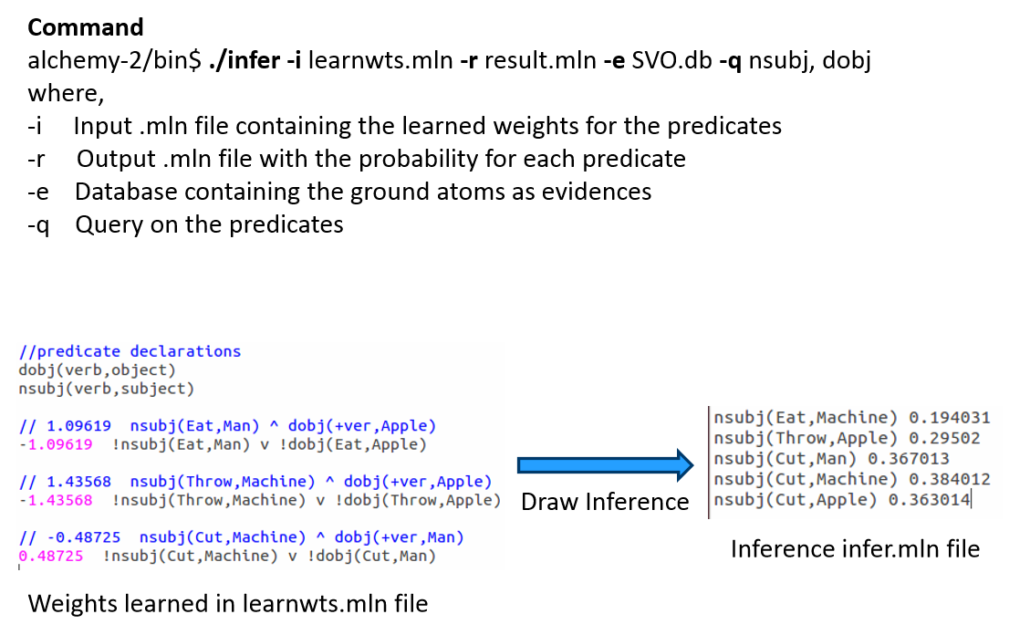
Let us draw inference on the the same example as earlier.

After learning the weights we run inference (with or without partial evidence) and query the relations of interest (nsubj here), to get inferred values.

Tool-kits

Let’s look at some of the MLN tool-kits at disposal to do learning and large scale inference. I have tried to make an assorted list of all tools here and tried to highlight some of its main features & problems.

For example, BUGS i.e. Bayesian Logic uses a Swift Compiler but is Not relational! ProbLog has a Python wrapper and is based on Horn clauses but has No Learning feature. These tools were invented in the initial days, much before the present day MLN looks like.

ProbCog developed at Technical University of Munich (TUM) & the AI Lab at Bremen covers not just MLN but also Bayesian Logic Networks (BLNs), Bayesian Networks & ProLog. In fact, it is now GUI based. Thebeast gives a shell to analyze & inspect model feature weights & missing features.

Alchemy from University of Washington (UoW) was the 1st First Order (FO) probabilistic logic toolkit. RockIt from University of Mannheim has an online & rest based interface and uses only Conjunctive Normal Forms (CNF) i.e. And-Or format in its formulas.

Tuffy scales this up by using a Relational Database Management System (RDBMS) whereas Felix allows Large Scale inference! Elementary makes use of secondary storage and Deep Dive is the current state of the art. All of these tools are part of the HAZY project group at Stanford University.

Lastly, LoMRF i.e. Logical Markov Random Field (MRF) is Scala based and has a feature to analyse different hypothesis by comparing the difference in .mln files!


Hope you enjoyed the read. The content starts from basic concepts and ends up highlighting key tools. In the final part of this 3 part blog series I would explain an application scenario and highlight the active research and industry players. Any feedback as a comment below or through a message is more than welcome!

Back to Part I – Statistical Relational Learning

Additional Links:

[1] Knowledge base files in Logical Markov Random Fields (LoMRF)

[2] (still) nothing clever Posts categorized “Machine Learning” – Markov Logic Networks

[3] A gentle introduction to statistical relational learning: maths, code, and examples

Statistical Relational Learning

An Introduction to Statistical Relational Learning – Part 1

Statistical Relational Learning (SRL) is an emerging field and one that is taking centre stage in the Data Science age. Big Data has been one of the primary reasons for the continued prominence of this relational learning approach given, the voluminous amount of data available now to learn interesting and unknown patterns from data. Moreover, the tools have also improved their processing prowess especially, in terms of scalability.

This introductory blog is a prelude on SRL and later on I would also touch base on more advanced topics, specifically Markov Logic Networks (MLN). To start off, let’s look at how SRL fits into one of the 5 different Machine Learning paradigms.

Five Machine Learning Paradigms

Lets look at the 5 Machine Learning Paradigms: Each of which is inspired by ideas from a different field!

  1. Connectionists as they are called and led by Geoffrey Hinton (University of Toronto & Google and one of the major names in the Deep Learning community) think that a learning algorithm should mimic the brain! After all it is the brain that does all the complex actions for us and, this idea stems from Neuroscience.
  2. Another group of Evolutionists whose leader is the late John Holland (from the University of Michigan) believed it is not the brain but evolution that was precedent and hence the master algorithm to build anything. And using this approach of having the fittest ones program the future they are currently building 3D prints of future robots.
  3. Another thought stems from Philosophy where Analogists like Douglas R. Hofstadter an American writer and author of popular and award winning book – Gödel, Escher, Bach: an Eternal Golden Braid believe that Analogy is the core of Cognition.
  4. Symbolists like Stephen Muggleton (Imperial College London) think Psychology is the base and by developing Rules in deductive reasoning they built Adam – a robot scientist at the University of Manchester!
  5. Lastly we have a school of thought which has its foundations rested on Statistics & Logic, which is the focal point of interest in this blog. This emerging field has started to gain prominence with the invention of Bayesian networks 2011 by Judea Pearl (University of California Los Angeles – UCLA) who was awarded with the Turing award (the highest award in Computer Science). Bayesians as they are called, are the most fanatical of the lot as they think everything can be represented by the Bayes theorem using hypothesis which can be updated based on new evidence.

SRL fits into the last paradigm of Statistics and Logic. As such it offers another alternative to the now booming Deep Learning approach inspired from Neuroscience.

Background

In many real world scenario and use cases, often the underlying data is assumed to be independent and identically distributed (i.i.d.). However, real world data is not and instead consists of many relationships. SRL as such attempts to represent, model, and learn in the relational domain!

There are 4 main Models in SRL

  1. Probabilistic Relational Models (PRM)
  2. Markov Logic Networks (MLN)
  3. Relational Dependency Networks (RDN)
  4. Bayesian Logic Programs (BLP)

It is difficult to cover all major models and hence the focus of this blog is only on the emerging field of Markov Logic Networks.
MLN is a powerful framework that combines statistics (i.e. it uses Markov Random Fields) and logical reasoning (first order logic).


markov-random-fields-first-order-logic

Academia

Some of the prominent names in academic and the research community in MLN include:

  1. Professor Pedro Domingos from the University of Washington is credited with introducing MLN in his paper from 2006. His group created the tool called Alchemy which was one of the first, First Order Logic tools.
  2. Another famous name – Professor Luc De Raedt from the AI group at University of Leuven in Belgium, and their team created the tool ProbLog which also has a Python Wrapper.
  3. HAZY Project (Stanford University) led by Prof. Christopher Ré from the InfoLab is doing active research in this field and Tuffy, Felix, Elementary, Deep Dive are some of the tools developed by them. More on it later!
  4. Talking about academia close by i.e. in Germany, Prof. Michael Beetz and his entire team moved from TUM to TU Bremen. Their group invented the tool – ProbCog
  5. At present, Prof. Volker Tresp from Ludwig Maximilians University (LMU), Munich & Dr. Matthias Nickles at Technical University of Munich (TUM) have research interests in SRL.

Theory & Formulation

A look at some background and theoretical concepts to understand MLN better.

A. Basics – Probabilistic Graphical Models (PGM)

The definition of a PGM goes as such:

A PGM encodes a joint p(x,y) or conditional p(y|x) probability distribution such that given some observations we are provided with a full probability distribution over all feasible solutions.

A PGM helps to encode relationships between a set of random variables. And it achieves this by making use of a graph! These graphs can be either be Directed or Undirected Graphs.

B. Markov Blanket

A Markov Blanket is a Directed Acyclic graph. It is a Bayesian network and as you can see the central node A highlighted in red is dependent on its parents and parents of descendents (moralization) by the circle drawn around it. Thus these nodes are the only knowledge needed to predict node A.

C. Markov Random Fields (MRF)

A MRF is an Undirected graphical model. Every node in an MRF satisfies the Local Markov property of Conditional Independence, i.e. a node is conditionally independent of another node, given its neighbours. And now relating it to Markov Blanket as explained previously, a Markov blanket for a node is simply its adjacent nodes!

Intuition

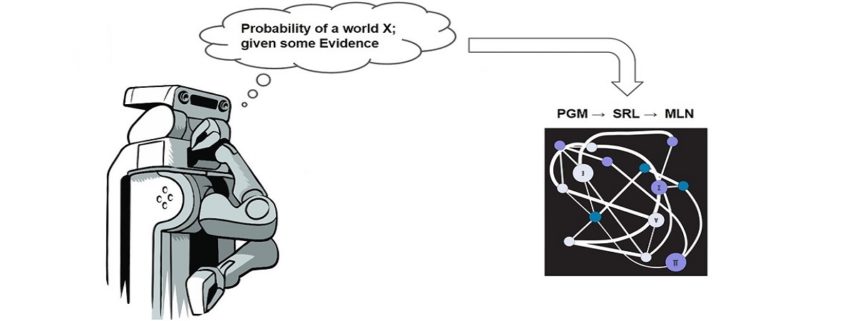
We now that Probability handles uncertainty whereas Logic handles complexity. So why not make use of both of them to model relationships in data that is both uncertain and complex. Markov Logic Networks (MLN) precisely does that for us!

MLN is composed of a set of pairs of  <w, F> where F is the formula (written in FO logic) and weights (real numbers identifying the strength of the constraint).

MLN basically provides a template to ground a Markov network. Grounding would be explained in detail in the next but one section on “Weight Learning”.

It can be defined as a Log linear model where probability of a world is given by the weighted sum of all true groundings of a formula i under an exponential function. It is then divided by Z which is termed as the partition function and used to normalize and get probability values between 0 and 1.

propability_of_a_world_x

The MLN Template

Rules or Predicates

The relation to be learned is expressed in FO logic. Some of the different possible FO logical connectives and quantifiers are And (^), Or (V), Implication (→), and many more. Plus, Formulas may contain one or more predicates, connected to each other with logical connectives and quantified symbols.

Evidence

Evidence represent known facts i.e. the ground predicates. Each fact is expressed with predicates that contain only constants from their corresponding domains.

Weight Learning

Discover the importance of relations based on grounded evidence.

Inference

Query relations, given partial evidence to infer a probabilistic estimate of the world.

More on Weight Learning and Inference in the next part of this series!

Hope you enjoyed the read. I have deliberately kept the content basic and a mix of non technical and technical so as to highlight first the key players and some background concepts and generate the reader’s interest in this topic, the technicalities of which can easily be read in the paper. Any feedback as a comment below or through a message are more than welcome!

Continue reading with Statistical Relational Learning – Part II.

References