Regardless of the industry in which you operate, you need information systems that evaluate your business data in order to provide you with a basis for decision-making. These systems are commonly referred to as so-called business intelligence (BI). In fact, most BI systems suffer from deficiencies that can be eliminated. In addition, modern BI can partially automate decisions and enable comprehensive analyzes with a high degree of flexibility in use.
 Read this article in German:
“Sechs Eigenschaften einer modernen Business Intelligence“
Let us discuss the six characteristics that distinguish modern business intelligence, which mean taking technical tricks into account in detail, but always in the context of a great vision for your own company BI:
1. Uniform database of high quality
Every managing director certainly knows the situation that his managers do not agree on how many costs and revenues actually arise in detail and what the margins per category look like. And if they do, this information is often only available months too late.
Every company has to make hundreds or even thousands of decisions at the operational level every day, which can be made much more well-founded if there is good information and thus increase sales and save costs. However, there are many source systems from the company’s internal IT system landscape as well as other external data sources. The gathering and consolidation of information often takes up entire groups of employees and offers plenty of room for human error.
A system that provides at least the most relevant data for business management at the right time and in good quality in a trusted data zone as a single source of truth (SPOT). SPOT is the core of modern business intelligence.
In addition, other data on BI may also be made available which can be useful for qualified analysts and data scientists. For all decision-makers, the particularly trustworthy zone is the one through which all decision-makers across the company can synchronize.
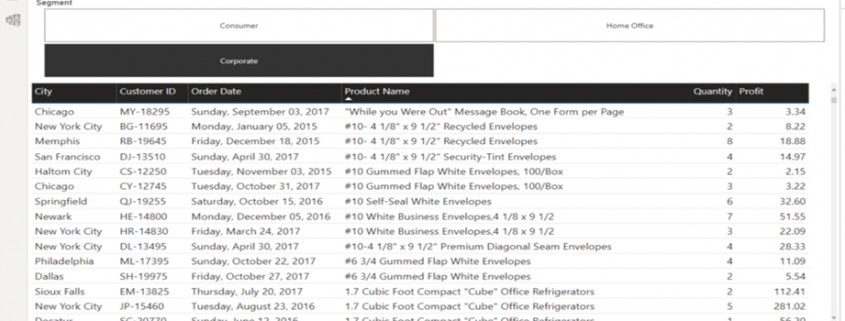
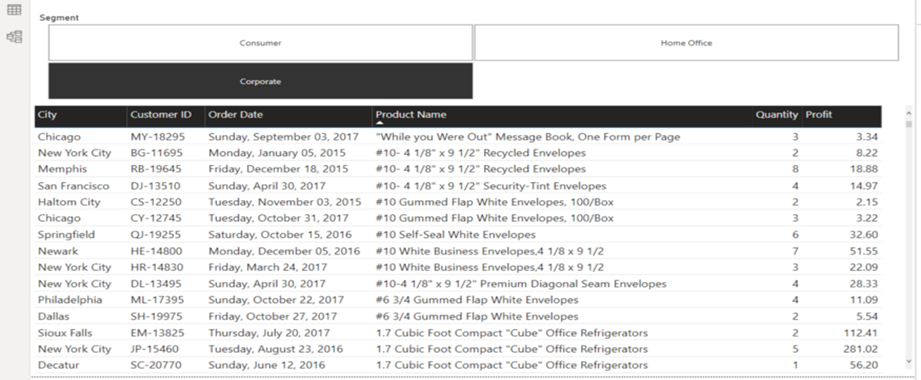
2. Flexible use by different stakeholders
Even if all employees across the company should be able to access central, trustworthy data, with a clever architecture this does not exclude that each department receives its own views of this data. Many BI systems fail due to company-wide inacceptance because certain departments or technically defined employee groups are largely excluded from BI.
Modern BI systems enable views and the necessary data integration for all stakeholders in the company who rely on information and benefit equally from the SPOT approach.
3. Efficient ways to expand (time to market)
The core users of a BI system are particularly dissatisfied when the expansion or partial redesign of the information system requires too much of patience. Historically grown, incorrectly designed and not particularly adaptable BI systems often employ a whole team of IT staff and tickets with requests for change requests.
Good BI is a service for stakeholders with a short time to market. The correct design, selection of software and the implementation of data flows / models ensures significantly shorter development and implementation times for improvements and new features.
Furthermore, it is not only the technology that is decisive, but also the choice of organizational form, including the design of roles and responsibilities – from the technical system connection to data preparation, pre-analysis and support for the end users.
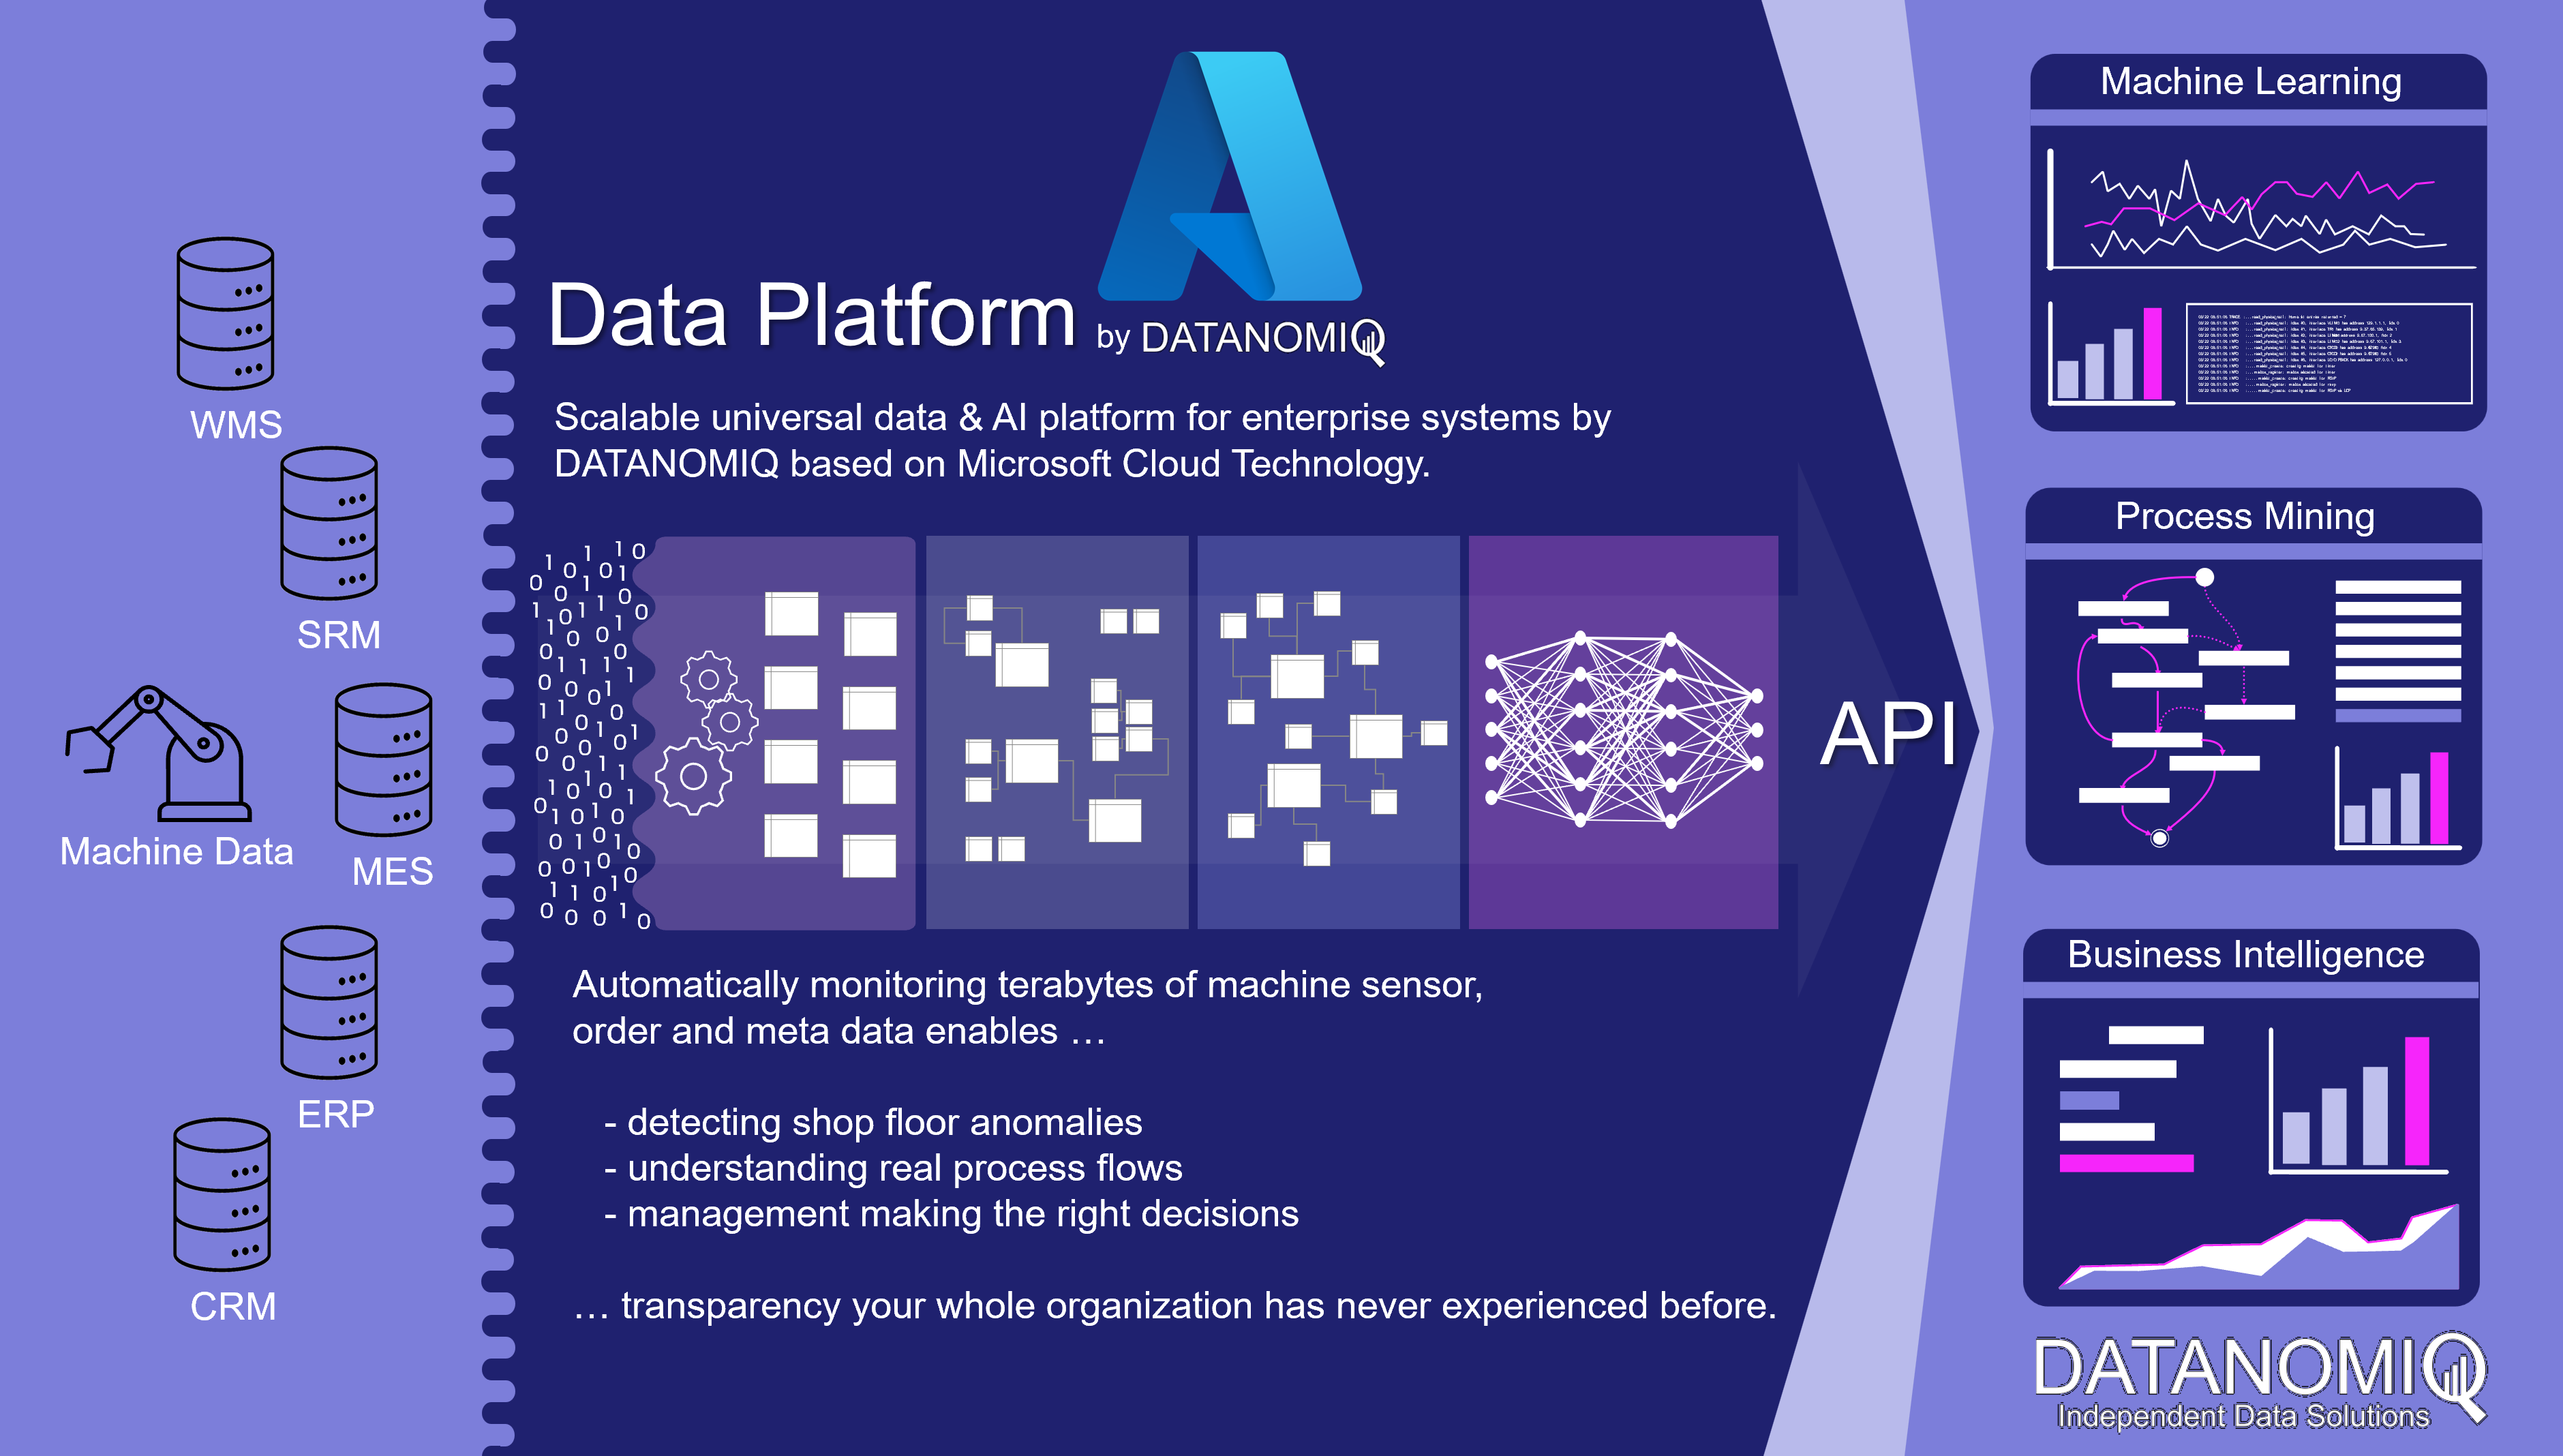
4. Integrated skills for Data Science and AI
Business intelligence and data science are often viewed and managed separately from each other. Firstly, because data scientists are often unmotivated to work with – from their point of view – boring data models and prepared data. On the other hand, because BI is usually already established as a traditional system in the company, despite the many problems that BI still has today.
Data science, often referred to as advanced analytics, deals with deep immersion in data using exploratory statistics and methods of data mining (unsupervised machine learning) as well as predictive analytics (supervised machine learning). Deep learning is a sub-area of machine learning and is used for data mining or predictive analytics. Machine learning is a sub-area of artificial intelligence (AI).
In the future, BI and data science or AI will continue to grow together, because at the latest after going live, the prediction models flow back into business intelligence. BI will probably develop into ABI (Artificial Business Intelligence). However, many companies are already using data mining and predictive analytics in the company, using uniform or different platforms with or without BI integration.
Modern BI systems also offer data scientists a platform to access high-quality and more granular raw data.
5. Sufficiently high performance
Most readers of these six points will probably have had experience with slow BI before. It takes several minutes to load a daily report to be used in many classic BI systems. If loading a dashboard can be combined with a little coffee break, it may still be acceptable for certain reports from time to time. At the latest, however, with frequent use, long loading times and unreliable reports are no longer acceptable.
One reason for poor performance is the hardware, which can be almost linearly scaled to higher data volumes and more analysis complexity using cloud systems. The use of cloud also enables the modular separation of storage and computing power from data and applications and is therefore generally recommended, but not necessarily the right choice for all companies.
In fact, performance is not only dependent on the hardware, the right choice of software and the right choice of design for data models and data flows also play a crucial role. Because while hardware can be changed or upgraded relatively easily, changing the architecture is associated with much more effort and BI competence. Unsuitable data models or data flows will certainly bring the latest hardware to its knees in its maximum configuration.
6. Cost-effective use and conclusion
Professional cloud systems that can be used for BI systems offer total cost calculators, such as Microsoft Azure, Amazon Web Services and Google Cloud. With these computers – with instruction from an experienced BI expert – not only can costs for the use of hardware be estimated, but ideas for cost optimization can also be calculated. Nevertheless, the cloud is still not the right solution for every company and classic calculations for on-premise solutions are necessary.
Incidentally, cost efficiency can also be increased with a good selection of the right software. Because proprietary solutions are tied to different license models and can only be compared using application scenarios. Apart from that, there are also good open source solutions that can be used largely free of charge and can be used for many applications without compromises.
However, it is wrong to assess the cost of a BI only according to its hardware and software costs. A significant part of cost efficiency is complementary to the aspects for the performance of the BI system, because suboptimal architectures work wastefully and require more expensive hardware than neatly coordinated architectures. The production of the central data supply in adequate quality can save many unnecessary processes of data preparation and many flexible analysis options also make redundant systems unnecessary and lead to indirect savings.
In any case, a BI for companies with many operational processes is always cheaper than no BI. However, if you take a closer look with BI expertise, cost efficiency is often possible.