Tag Archive for: Python

Article series: 5 Clean Coding Tips – 3. Take Advantage of the Formatting Tools.

This is the third of the article series “5 tips for clean coding” to follow as soon as you’ve made the first steps into your coding career, in this article series. Read the introduction here, to find out why it is important to write clean code if you missed it.

Unfortunately, no automatic formatting tool will correct the logic in your code, suggest meaningful names of your variables or comment the code for you. Yet. Gmail has lately started suggesting email titles based on email content. AI-powered variable naming can be next, who knows. Anyway, the visual level of the code is much easier to correct and there are tools that will do some of the code formatting on the visual level job for you. Some of them might be already existing in your IDE, you just need to look for them a bit, others need to be installed. One of the most popular formatting tools is pylint[i]. It is worth checking it out and learning to use it in an efficient way.

Beware that as convenient as it may seem to copy and paste your code into a quick online ‘beautifier’ it is not always a good idea. The online tools might store your code. If you are working on something that shouldn’t just freely float in the world wide web, stick to reliable tools like pylint, that will store the data within your working directory.

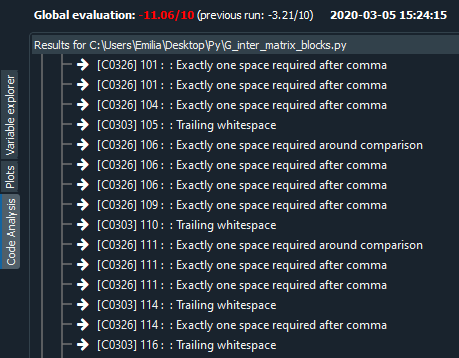
These tools can become very good friends of yours but also very annoying ones. They will not miss single whitespace and will not keep their mouth shut when your line length jumps from 79 to 80 characters. They will be shouting with an underscoring of some worrying color and/or exclamation marks. You will need to find your way to coexist and retain your sanity. It can be very distracting when you are in a working flow and warnings pop up all the time about formatting details that have nothing to do with what you are trying to solve. Sometimes, it might be better to turn those warnings off while you are in your most concentrated/creative phase of writing and turn them back on while the dust of your genius settles down a little bit. Usually the offer a lot of flexibility, regarding which warnings you want to be ignored and other features. The good thing is, they also teach you what are mistakes that you are making and after some time you will just stop making them in the first place.

References:

[i] https://www.pylint.org/

Article series: 5 Clean Coding Tips – 2. Name Variables in a Meaningful Way

This is the second of the article series “5 tips for clean coding” to follow as soon as you’ve made the first steps into your coding career, in this article series. Read the introduction here, to find out why it is important to write clean code if you missed it.

When it comes to naming variables, there are a few official rules in the PEP8 style guide. A variable must start with an underscore or a letter and can be followed by a number of underscores or letters or digits. They cannot be reserved words: True, False, or, not, lambda etc. The preferred naming style is lowercase or lowercase_with_underscore. This all refers to variable names on a visual level. However, for readability purposes, the semantic level is as important, or maybe even more so. If it was for python, the variables could be named like this:

b_a327647_3 = DataFrame() 
hw_abc7622 = DataFrame()  
a10001_kkl = DataFrame()

It wouldn’t make the slightest difference. But again, the code is not only for the interpreter to be read. It is for humans. Other people might need to look at your code to understand what you did, to be able to continue the work that you have already started. In any case, they need to be able to decipher what hides behind the variable names, that you’ve given the objects in your code. They will need to remember what they meant as they reappear in the code. And it might not be easy for them.

Remembering names is not an easy thing to do in all life situations. Let’s consider the following situation. You go to a party, there is a bunch of new people that you meet for the first time. They all have names and you try very hard to remember them all. Imagine how much easier would it be if you could call the new girl who came with John as the_girl_who_came_with_John. How much easier would it be to gossip to your friends about her? ‘Camilla is on the 5th glass of wine tonight, isn’t she?!.’ ‘Who are you talking about???’ Your friends might ask. ‘The_Girl_who_came_with_John.’ And they will all know. ‘It was nice to meet you girl_who_came_with_john, see you around.’ The good thing is that variables are not really like people. You can be a bit rude to them, they will not mind. You don’t have to force yourself or anyone else to remember an arbitrary name of a variable, that accidentally came to your mind in the moment of creation. Let your colleagues figure out what is what by a meaningful, straightforward description of it.

There is an important tradeoff to be aware of here. The lines of code should not exceed a certain length (79 characters, according to the PEP 8), therefore, it is recommended that you keep your names as short as possible. It is worth to give it a bit of thought about how you can name your variable in the most descriptive way, keeping it as short as possible. Keep in mind, that
the_blond_girl_in_a_dark_blue_dress_who_came_with_John_to_this_party might not be the best choice.

There are a few additional pieces of advice when it comes to naming your variables. First, try to always use pronounceable names. If you’ve ever been to an international party, you will know how much harder to remember is something that you cannot even repeat. Second, you probably have been taught over and over again that whenever you create a loop, you use i and j to denote the iterators.

for i in m:
    for j in n:

It is probably engraved deep into the folds in your brain to write for i in…. You need to try and scrape it out of your cortex. Think about what the i stands for, what it really does and name it accordingly. Is i maybe the row_index? Is it a list_element?

for element in list_of_words:
    for letter in word:

Additionally, think about when to use a noun and where a verb. Variables usually are things and functions usually do things. So, it might be better to name functions with verb expressions, for example: get_id() or raise_to_power().

Moreover, it is a good practice to name constant numbers in the code. First, because when you name them you explain the meaning of the number. Second, because maybe one day you will have to change that number. If it appears multiple times in your code, you will avoid searching and changing it in every place. PEP 8 states that the constants should be named with UPPER_CASE_NAME. It is also quite common practice to explain the meaning of the constants with an inline comment at the end of the line, where the number appears. However, this approach will increase the line length and will require repeating the comment if the number appears more than one time in the code.

Python vs R: Which Language to Choose for Deep Learning?

Data science is increasingly becoming essential for every business to operate efficiently in this modern world. This influences the processes composed together to obtain the required outputs for clients. While machine learning and deep learning sit at the core of data science, the concepts of deep learning become essential to understand as it can help increase the accuracy of final outputs. And when it comes to data science, R and Python are the most popular programming languages used to instruct the machines.

Python and R: Primary Languages Used for Deep Learning

Deep learning and machine learning differentiate based on the input data type they use. While machine learning depends upon the structured data, deep learning uses neural networks to store and process the data during the learning. Deep learning can be described as the subset of machine learning, where the data to be processed is defined in another structure than a normal one.

R is developed specifically to support the concepts and implementation of data science and hence, the support provided by this language is incredible as writing codes become much easier with its simple syntax.

Python is already much popular programming language that can serve more than one development niche without straining even for a bit. The implementation of Python for programming machine learning algorithms is very much popular and the results provided are accurate and faster than any other language. (C or Java). And because of its extended support for data science concept implementation, it becomes a tough competitor for R.

However, if we compare the charts of popularity, Python is obviously more popular among data scientists and developers because of its versatility and easier usage during algorithm implementation. However, R outruns Python when it comes to the packages offered to developers specifically expertise in R over Python. Therefore, to conclude which one of them is the best, let’s take an overview of the features and limits offered by both languages.

Python

Python was first introduced by Guido Van Rossum who developed it as the successor of ABC programming language. Python puts white space at the center while increasing the readability of the developed code. It is a general-purpose programming language that simply extends support for various development needs.

The packages of Python includes support for web development, software development, GUI (Graphical User Interface) development and machine learning also. Using these packages and putting the best development skills forward, excellent solutions can be developed. According to Stackoverflow, Python ranks at the fourth position as the most popular programming language among developers.

Benefits for performing enhanced deep learning using Python are:

  • Concise and Readable Code
  • Extended Support from Large Community of Developers
  • Open-source Programming Language
  • Encourages Collaborative Coding
  • Suitable for small and large-scale products

The latest and stable version of Python has been released as Python 3.8.0 on 14th October 2019. Developing a software solution using Python becomes much easier as the extended support offered through the packages drives better development and answers every need.

R

R is a language specifically used for the development of statistical software and for statistical data analysis. The primary user base of R contains statisticians and data scientists who are analyzing data. Supported by R Foundation for statistical computing, this language is not suitable for the development of websites or applications. R is also an open-source environment that can be used for mining excessive and large amounts of data.

R programming language focuses on the output generation but not the speed. The execution speed of programs written in R is comparatively lesser as producing required outputs is the aim not the speed of the process. To use R in any development or mining tasks, it is required to install its operating system specific binary version before coding to run the program directly into the command line.

R also has its own development environment designed and named RStudio. R also involves several libraries that help in crafting efficient programs to execute mining tasks on the provided data.

The benefits offered by R are pretty common and similar to what Python has to offer:

  • Open-source programming language
  • Supports all operating systems
  • Supports extensions
  • R can be integrated with many of the languages
  • Extended Support for Visual Data Mining

Although R ranks at the 17th position in Stackoverflow’s most popular programming language list, the support offered by this language has no match. After all, the R language is developed by statisticians for statisticians!

Python vs R: Should They be Really Compared?

Even when provided with the best technical support and efficient tools, a developer will not be able to provide quality outputs if he/she doesn’t possess the required skills. The point here is, technical skills rank higher than the resources provided. A comparison of these two programming languages is not advisable as they both hold their own set of advantages. However, the developers considering to use both together are less but they obtain maximum benefit from the process.

Both these languages have some features in common. For example, if a representative comes asking you if you lend technical support for developing an uber clone, you are directly going to decline as Python and R both do not support mobile app development. To benefit the most and develop excellent solutions using both these programming languages, it is advisable to stop comparing and start collaborating!

R and Python: How to Fit Both In a Single Program

Anticipating the future needs of the development industry, there has been a significant development to combine these both excellent programming languages into one. Now, there are two approaches to performing this: either we include R script into Python code or vice versa.

Using the available interfaces, packages and extended support from Python we can include R script into the code and enhance the productivity of Python code. Availability of PypeR, pyRserve and more resources helps run these two programming languages efficiently while efficiently performing the background work.

Either way, using the developed functions and packages made available for integrating Python in R are also effective at providing better results. Available R packages like rJython, rPython, reticulate, PythonInR and more, integrating Python into R language is very easy.

Therefore, using the development skills at their best and maximizing the use of such amazing resources, Python and R can be togetherly used to enhance end results and provide accurate deep learning support.

Conclusion

Python and R both are great in their own names and own places. However, because of the wide applications of Python in almost every operation, the annual packages offered to Python developers are less than the developers skilled in using R. However, this doesn’t justify the usability of R. The ultimate decision of choosing between these two languages depends upon the data scientists or developers and their mining requirements.

And if a developer or data scientist decides to develop skills for both- Python and R-based development, it turns out to be beneficial in the near future. Choosing any one or both to use in your project depends on the project requirements and expert support on hand.

Multi-touch attribution: A data-driven approach

Customers shopping behavior has changed drastically when it comes to online shopping, as nowadays, customer likes to do a thorough market research about a product before making a purchase.

What is Multi-touch attribution?

This makes it really hard for marketers to correctly determine the contribution for each marketing channel to which a customer was exposed to. The path a customer takes from his first search to the purchase is known as a Customer Journey and this path consists of multiple marketing channels or touchpoints. Therefore, it is highly important to distribute the budget between these channels to maximize return. This problem is known as multi-touch attribution problem and the right attribution model helps to steer the marketing budget efficiently. Multi-touch attribution problem is well known among marketers. You might be thinking that if this is a well known problem then there must be an algorithm out there to deal with this. Well, there are some traditional models  but every model has its own limitation which will be discussed in the next section.

Types of attribution models

Most of the eCommerce companies have a performance marketing department to make sure that the marketing budget is spent in an agile way. There are multiple heuristics attribution models pre-existing in google analytics however there are several issues with each one of them. These models are:

Traditional attribution models

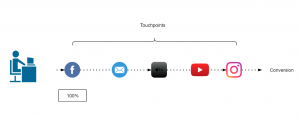
First touch attribution model

100% credit is given to the first channel as it is considered that the first marketing channel was responsible for the purchase.

Figure 1: First touch attribution model

Last touch attribution model

100% credit is given to the last channel as it is considered that the first marketing channel was responsible for the purchase.

Figure 2: Last touch attribution model

Linear-touch attribution model

In this attribution model, equal credit is given to all the marketing channels present in customer journey as it is considered that each channel is equally responsible for the purchase.

Figure 3: Linear attribution model

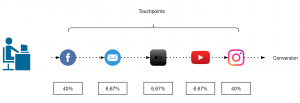
U-shaped or Bath tub attribution model

This is most common in eCommerce companies, this model assigns 40% to first and last touch and 20% is equally distributed among the rest.

Figure 4: Bathtub or U-shape attribution model

Data driven attribution models

Traditional attribution models follows somewhat a naive approach to assign credit to one or all the marketing channels involved. As it is not so easy for all the companies to take one of these models and implement it. There are a lot of challenges that comes with multi-touch attribution problem like customer journey duration, overestimation of branded channels, vouchers and cross-platform issue, etc.

Switching from traditional models to data-driven models gives us more flexibility and more insights as the major part here is defining some rules to prepare the data that fits your business. These rules can be defined by performing an ad hoc analysis of customer journeys. In the next section, I will discuss about Markov chain concept as an attribution model.

Markov chains

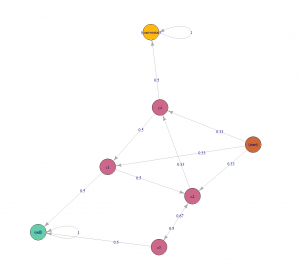
Markov chains concepts revolves around probability. For attribution problem, every customer journey can be seen as a chain(set of marketing channels) which will compute a markov graph as illustrated in figure 5. Every channel here is represented as a vertex and the edges represent the probability of hopping from one channel to another. There will be an another detailed article, explaining the concept behind different data-driven attribution models and how to apply them.

Figure 5: Markov chain example

Challenges during the Implementation

Transitioning from a traditional attribution models to a data-driven one, may sound exciting but the implementation is rather challenging as there are several issues which can not be resolved just by changing the type of model. Before its implementation, the marketers should perform a customer journey analysis to gain some insights about their customers and try to find out/perform:

  1. Length of customer journey.
  2. On an average how many branded and non branded channels (distinct and non-distinct) in a typical customer journey?
  3. Identify most upper funnel and lower funnel channels.
  4. Voucher analysis: within branded and non-branded channels.

When you are done with the analysis and able to answer all of the above questions, the next step would be to define some rules in order to handle the user data according to your business needs. Some of the issues during the implementation are discussed below along with their solution.

Customer journey duration

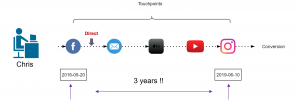
Assuming that you are a retailer, let’s try to understand this issue with an example. In May 2016, your company started a Fb advertising campaign for a particular product category which “attracted” a lot of customers including Chris. He saw your Fb ad while working in the office and clicked on it, which took him to your website. As soon as he registered on your website, his boss called him (probably because he was on Fb while working), he closed everything and went for the meeting. After coming back, he started working and completely forgot about your ad or products. After a few days, he received an email with some offers of your products which also he ignored until he saw an ad again on TV in Jan 2019 (after 3 years). At this moment, he started doing his research about your products and finally bought one of your products from some Instagram campaign. It took Chris almost 3 years to make his first purchase.

Figure 6: Chris journey

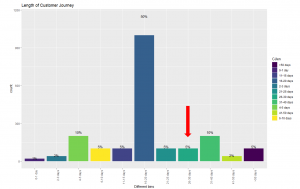
Now, take a minute and think, if you analyse the entire journey of customers like Chris, you would realize that you are still assigning some of the credit to the touchpoints that happened 3 years ago. This can be solved by using an attribution window. Figure 6 illustrates that 83% of the customers are making a purchase within 30 days which means the attribution window here could be 30 days. In simple words, it is safe to remove the touchpoints that happens after 30 days of purchase. This parameter can also be changed to 45 days or 60 days, depending on the use case.

Figure 7: Length of customer journey

Removal of direct marketing channel

A well known issue that every marketing analyst is aware of is, customers who are already aware of the brand usually comes to the website directly. This leads to overestimation of direct channel and branded channels start getting more credit. In this case, you can set a threshold (say 7 days) and remove these branded channels from customer journey.

Figure 8: Removal of branded channels

Cross platform problem

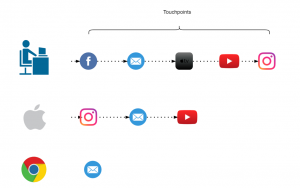
If some of your customers are using different devices to explore your products and you are not able to track them then it will make retargeting really difficult. In a perfect world these customers belong to same journey and if these can’t be combined then, except one, other paths would be considered as “non-converting path”. For attribution problem device could be thought of as a touchpoint to include in the path but to be able to track these customers across all devices would still be challenging. A brief introduction to deterministic and probabilistic ways of cross device tracking can be found here.

Figure 9: Cross platform clash

How to account for Vouchers?

To better account for vouchers, it can be added as a ‘dummy’ touchpoint of the type of voucher (CRM,Social media, Affiliate or Pricing etc.) used. In our case, we tried to add these vouchers as first touchpoint and also as a last touchpoint but no significant difference was found. Also, if the marketing channel of which the voucher was used was already in the path, the dummy touchpoint was not added.

Figure 10: Addition of Voucher as a touchpoint

Predictive maintenance in Semiconductor Industry: Part 1

The process in the semiconductor industry is highly complicated and is normally under consistent observation via the monitoring of the signals coming from several sensors. Thus, it is important for the organization to detect the fault in the sensor as quickly as possible. There are existing traditional statistical based techniques however modern semiconductor industries have the ability to produce more data which is beyond the capability of the traditional process.

For this article, we will be using SECOM dataset which is available here.  A lot of work has already done on this dataset by different authors and there are also some articles available online. In this article, we will focus on problem definition, data understanding, and data cleaning.

This article is only the first of three parts, in this article we will discuss the business problem in hand and clean the dataset. In second part we will do feature engineering and in the last article we will build some models and evaluate them.

Problem definition

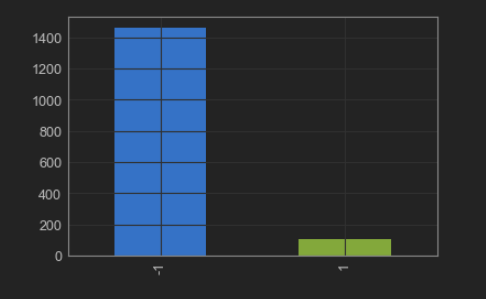
This data which is collected by these sensors not only contains relevant information but also a lot of noise. The dataset contains readings from 590. Among the 1567 examples, there are only 104 fail cases which means that out target variable is imbalanced. We will look at the distribution of the dataset when we look at the python code.

NOTE: For a detailed description regarding this cases study I highly recommend to read the following research papers:

  •  Kerdprasop, K., & Kerdprasop, N. A Data Mining Approach to Automate Fault Detection Model Development in the Semiconductor Manufacturing Process.
  • Munirathinam, S., & Ramadoss, B. Predictive Models for Equipment Fault Detection in the Semiconductor Manufacturing Process.

Data Understanding and Preparation

Let’s start exploring the dataset now. The first step as always is to import the required libraries.

import pandas as pd
import numpy as np

There are several ways to import the dataset, you can always download and then import from your working directory. However, I will directly import using the link. There are two datasets: one contains the readings from the sensors and the other one contains our target variable and a timestamp.

# Load dataset
url = "https://archive.ics.uci.edu/ml/machine-learning-databases/secom/secom.data"
names = ["feature" + str(x) for x in range(1, 591)]
secom_var = pd.read_csv(url, sep=" ", names=names, na_values = "NaN") 


url_l = "https://archive.ics.uci.edu/ml/machine-learning-databases/secom/secom_labels.data"
secom_labels = pd.read_csv(url_l,sep=" ",names = ["classification","date"],parse_dates = ["date"],na_values = "NaN")

The first step before doing the analysis would be to merge the dataset and we will us pandas library to merge the datasets in just one line of code.

#Data cleaning
#1. Combined the two datasets
secom_merged = pd.merge(secom_var, secom_labels,left_index=True,right_index=True)

Now let’s check out the distribution of the target variable

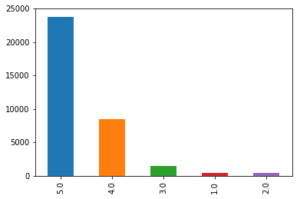
secom_merged.target.value_counts().plot(kind = 'bar')

Figure 1: Distribution of Target Variable

From Figure 1 it can be observed that the target variable is imbalanced and it is highly recommended to deal with this problem before the model building phase to avoid bias model. Xgboost is one of the models which can deal with imbalance classes but one needs to spend a lot of time to tune the hyper-parameters to achieve the best from the model.

The dataset in hand contains a lot of null values and the next step would be to analyse these null values and remove the columns having null values more than a certain percentage. This percentage is calculated based on 95th quantile of null values.

#2. Analyzing nulls
secom_rmNa.isnull().sum().sum()
secom_nulls = secom_rmNa.isnull().sum()/len(secom_rmNa)
secom_nulls.describe()
secom_nulls.hist()

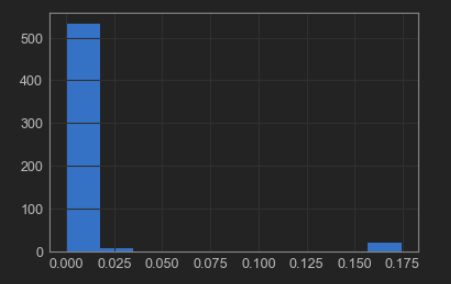
Figure 2: Missing percentge in each column

Now we calculate the 95th percentile of the null values.

x = secom_nulls.quantile(0.95)
secom_rmNa = secom_merged[secom_merged.columns[secom_nulls < x]]

Figure 3: Missing percentage after removing columns with more then 45% Na

From figure 3 its visible that there are still missing values in the dataset and can be dealt by using many imputation methods. The most common method is to impute these values by mean, median or mode. There also exist few sophisticated techniques like K-nearest neighbour and interpolation.  We will be applying interpolation technique to our dataset. 

secom_complete = secom_rmNa.interpolate()

To prepare our dataset for analysis we should remove some more unwanted columns like columns with near zero variance. For this we can calulate number of unique values in each column and if there is only one unique value we can delete the column as it holds no information.

df = secom_complete.loc[:,secom_complete.apply(pd.Series.nunique) != 1]

## Let's check the shape of the df
df.shape
(1567, 444)

We have applied few data cleaning techniques and reduced the features from 590 to 444. However, In the next article we will apply some feature engineering techniques and adress problems like the curse of dimensionality and will also try to balance the target variable.

Bleiben Sie dran!!

Language Detecting with sklearn by determining Letter Frequencies

Of course, there are better and more efficient methods to detect the language of a given text than counting its lettes. On the other hand this is a interesting little example to show the impressing ability of todays machine learning algorithms to detect hidden patterns in a given set of data.

For example take the sentence:

“Ceci est une phrase française.”

It’s not to hard to figure out that this sentence is french. But the (lowercase) letters of the same sentence in a random order look like this:

“eeasrsçneticuaicfhenrpaes”

Still sure it’s french? Regarding the fact that this string contains the letter “ç” some people could have remembered long passed french lessons back in school and though might have guessed right. But beside the fact that the french letter “ç” is also present for example in portuguese, turkish, catalan and a few other languages, this is still a easy example just to explain the problem. Just try to guess which language might have generated this:

“ogldviisnntmeyoiiesettpetorotrcitglloeleiengehorntsnraviedeenltseaecithooheinsnstiofwtoienaoaeefiitaeeauobmeeetdmsflteightnttxipecnlgtetgteyhatncdisaceahrfomseehmsindrlttdthoaranthahdgasaebeaturoehtrnnanftxndaeeiposttmnhgttagtsheitistrrcudf”

While this looks simply confusing to the human eye and it seems practically impossible to determine the language it was generated from, this string still contains as set of hidden but well defined patterns from which the language could be predictet with almost complete (ca. 98-99%) certainty.

First of all, we need a set of texts in the languages our model should be able to recognise. Luckily with the package NLTK there comes a big set of example texts which actually are protocolls of the european parliament and therefor are publicly availible in 11 differen languages:

  •  Danish
  •  Dutch
  •  English
  •  Finnish
  •  French
  •  German
  •  Greek
  •  Italian
  •  Portuguese
  •  Spanish
  •  Swedish

Because the greek version is not written with the latin alphabet, the detection of the language greek would just be too simple, so we stay with the other 10 languages availible. To give you a idea of the used texts, here is a little sample:

“Resumption of the session I declare resumed the session of the European Parliament adjourned on Friday 17 December 1999, and I would like once again to wish you a happy new year in the hope that you enjoyed a pleasant festive period.
Although, as you will have seen, the dreaded ‘millennium bug’ failed to materialise, still the people in a number of countries suffered a series of natural disasters that truly were dreadful.”

Train and Test

The following code imports the nessesary modules and reads the sample texts from a set of text files into a pandas.Dataframe object and prints some statistics about the read texts:

from pathlib import Path
import random
from collections import Counter, defaultdict
import numpy as np
import pandas as pd
from sklearn.neighbors import *
from matplotlib import pyplot as plt
from mpl_toolkits import mplot3d
%matplotlib inline


def read(file):
    '''Returns contents of a file'''
    with open(file, 'r', errors='ignore') as f:
        text = f.read()
    return text

def load_eu_texts():
    '''Read texts snipplets in 10 different languages into pd.Dataframe

    load_eu_texts() -> pd.Dataframe
    
    The text snipplets are taken from the nltk-data corpus.
    '''
    basepath = Path('/home/my_username/nltk_data/corpora/europarl_raw/langs/')
    df = pd.DataFrame(columns=['text', 'lang', 'len'])
    languages = [None]
    for lang in basepath.iterdir():
        languages.append(lang.as_posix())
        t = '\n'.join([read(p) for p in lang.glob('*')])
        d = pd.DataFrame()
        d['text'] = ''
        d['text'] = pd.Series(t.split('\n'))
        d['lang'] = lang.name.title()
        df = df.append(d.copy(), ignore_index=True)
    return df

def clean_eutextdf(df):
    '''Preprocesses the texts by doing a set of cleaning steps
    
    clean_eutextdf(df) -> cleaned_df
    '''
    # Cuts of whitespaces a the beginning and and
    df['text'] = [i.strip() for i in df['text']]
    # Generate a lowercase Version of the text column
    df['ltext'] = [i.lower() for i in df['text']]

    # Determining the length of each text
    df['len'] = [len(i) for i in df['text']]
    # Drops all texts that are not at least 200 chars long
    df = df.loc[df['len'] > 200]
    return df

# Execute the above functions to load the texts
df = clean_eutextdf(load_eu_texts())

# Print a few stats of the read texts
textline = 'Number of text snippplets: ' + str(df.shape[0])
print('\n' + textline + '\n' + ''.join(['_' for i in range(len(textline))]))
c = Counter(df['lang'])
for l in c.most_common():
    print('%-25s' % l[0] + str(l[1]))
df.sample(10)
Number of text snippplets: 56481
________________________________
French                   6466
German                   6401
Italian                  6383
Portuguese               6147
Spanish                  6016
Finnish                  5597
Swedish                  4940
Danish                   4914
Dutch                    4826
English                  4791
lang	len	text	ltext
135233	Finnish	346	Vastustan sitä , toisin kuin tämän parlamentin...	vastustan sitä , toisin kuin tämän parlamentin...
170400	Danish	243	Desuden ødelægger det centraliserede europæisk...	desuden ødelægger det centraliserede europæisk...
85466	Italian	220	In primo luogo , gli accordi di Sharm el-Sheik...	in primo luogo , gli accordi di sharm el-sheik...
15926	French	389	Pour ce qui est concrètement du barrage de Ili...	pour ce qui est concrètement du barrage de ili...
195321	English	204	Discretionary powers for national supervisory ...	discretionary powers for national supervisory ...
160557	Danish	304	Det er de spørgmål , som de lande , der udgør ...	det er de spørgmål , som de lande , der udgør ...
196310	English	355	What remains of the concept of what a company ...	what remains of the concept of what a company ...
110163	Portuguese	327	Actualmente , é do conhecimento dos senhores d...	actualmente , é do conhecimento dos senhores d...
151681	Danish	203	Dette er vigtigt for den tillid , som samfunde...	dette er vigtigt for den tillid , som samfunde...
200540	English	257	Therefore , according to proponents , such as ...	therefore , according to proponents , such as ...

Above you see a sample set of random rows of the created Dataframe. After removing very short text snipplets (less than 200 chars) we are left with 56481 snipplets. The function clean_eutextdf() then creates a lower case representation of the texts in the coloum ‘ltext’ to facilitate counting the chars in the next step.
The following code snipplet now extracs the features – in this case the relative frequency of each letter in every text snipplet – that are used for prediction:

def calc_charratios(df):
    '''Calculating ratio of any (alphabetical) char in any text of df for each lyric
    
    calc_charratios(df) -> list, pd.Dataframe
    '''
    CHARS = ''.join({c for c in ''.join(df['ltext']) if c.isalpha()})
    print('Counting Chars:')
    for c in CHARS:
        print(c, end=' ')
        df[c] = [r.count(c) for r in df['ltext']] / df['len']
    return list(CHARS), df

features, df = calc_charratios(df)

Now that we have calculated the features for every text snipplet in our dataset, we can split our data set in a train and test set:

def split_dataset(df, ratio=0.5):
    '''Split the dataset into a train and a test dataset
    
    split_dataset(featuredf, ratio) -> pd.Dataframe, pd.Dataframe
    '''
    df = df.sample(frac=1).reset_index(drop=True)
    traindf = df[:][:int(df.shape[0] * ratio)]
    testdf = df[:][int(df.shape[0] * ratio):]
    return traindf, testdf

featuredf = pd.DataFrame()
featuredf['lang'] = df['lang']
for feature in features:
    featuredf[feature] = df[feature]
traindf, testdf = split_dataset(featuredf, ratio=0.80)

x = np.array([np.array(row[1:]) for index, row in traindf.iterrows()])
y = np.array([l for l in traindf['lang']])
X = np.array([np.array(row[1:]) for index, row in testdf.iterrows()])
Y = np.array([l for l in testdf['lang']])

After doing that, we can train a k-nearest-neigbours classifier and test it to get the percentage of correctly predicted languages in the test data set. Because we do not know what value for k may be the best choice, we just run the training and testing with different values for k in a for loop:

def train_knn(x, y, k):
    '''Returns the trained k nearest neighbors classifier
    
    train_knn(x, y, k) -> sklearn.neighbors.KNeighborsClassifier
    '''
    clf = KNeighborsClassifier(k)
    clf.fit(x, y)
    return clf

def test_knn(clf, X, Y):
    '''Tests a given classifier with a testset and return result
    
    text_knn(clf, X, Y) -> float
    '''
    predictions = clf.predict(X)
    ratio_correct = len([i for i in range(len(Y)) if Y[i] == predictions[i]]) / len(Y)
    return ratio_correct

print('''k\tPercentage of correctly predicted language
__________________________________________________''')
for i in range(1, 16):
    clf = train_knn(x, y, i)
    ratio_correct = test_knn(clf, X, Y)
    print(str(i) + '\t' + str(round(ratio_correct * 100, 3)) + '%')
k	Percentage of correctly predicted language
__________________________________________________
1	97.548%
2	97.38%
3	98.256%
4	98.132%
5	98.221%
6	98.203%
7	98.327%
8	98.247%
9	98.371%
10	98.345%
11	98.327%
12	98.3%
13	98.256%
14	98.274%
15	98.309%

As you can see in the output the reliability of the language classifier is generally very high: It starts at about 97.5% for k = 1, increases for with increasing values of k until it reaches a maximum level of about 98.5% at k ≈ 10.

Using the Classifier to predict languages of texts

Now that we have trained and tested the classifier we want to use it to predict the language of example texts. To do that we need two more functions, shown in the following piece of code. The first one extracts the nessesary features from the sample text and predict_lang() predicts the language of a the texts:

def extract_features(text, features):
    '''Extracts all alphabetic characters and add their ratios as feature
    
    extract_features(text, features) -> np.array
    '''
    textlen = len(text)
    ratios = []
    text = text.lower()
    for feature in features:
        ratios.append(text.count(feature) / textlen)
    return np.array(ratios)

def predict_lang(text, clf=clf):
    '''Predicts the language of a given text and classifier
    
    predict_lang(text, clf) -> str
    '''
    extracted_features = extract_features(text, features)
    return clf.predict(np.array(np.array([extracted_features])))[0]

text_sample = df.sample(10)['text']

for example_text in text_sample:
    print('%-20s'  % predict_lang(example_text, clf) + '\t' + example_text[:60] + '...')
Italian             	Auspico che i progetti riguardanti i programmi possano contr...
English             	When that time comes , when we have used up all our resource...
Portuguese          	Creio que o Parlamento protesta muitas vezes contra este mét...
Spanish             	Sobre la base de esta posición , me parece que se puede enco...
Dutch               	Ik voel mij daardoor aangemoedigd omdat ik een brede consens...
Spanish             	Señor Presidente , Señorías , antes que nada , quisiera pron...
Italian             	Ricordo altresì , signora Presidente , che durante la preced...
Swedish             	Betänkande ( A5-0107 / 1999 ) av Berend för utskottet för re...
English             	This responsibility cannot only be borne by the Commissioner...
Portuguese          	A nossa leitura comum é que esse partido tem uma posição man...

With this classifier it is now also possible to predict the language of the randomized example snipplet from the introduction (which is acutally created from the first paragraph of this article):

example_text = "ogldviisnntmeyoiiesettpetorotrcitglloeleiengehorntsnraviedeenltseaecithooheinsnstiofwtoienaoaeefiitaeeauobmeeetdmsflteightnttxipecnlgtetgteyhatncdisaceahrfomseehmsindrlttdthoaranthahdgasaebeaturoehtrnnanftxndaeeiposttmnhgttagtsheitistrrcudf"
predict_lang(example_text)
'English'

The KNN classifier of sklearn also offers the possibility to predict the propability with which a given classification is made. While the probability distribution for a specific language is relativly clear for long sample texts it decreases noticeably the shorter the texts are.

def dict_invert(dictionary):
    ''' Inverts keys and values of a dictionary
    
    dict_invert(dictionary) -> collections.defaultdict(list)
    '''
    inverse_dict = defaultdict(list)
    for key, value in dictionary.items():
        inverse_dict[value].append(key)
    return inverse_dict

def get_propabilities(text, features=features):
    '''Prints the probability for every language of a given text
    
    get_propabilities(text, features)
    '''
    results = clf.predict_proba(extract_features(text, features=features).reshape(1, -1))
    for result in zip(clf.classes_, results[0]):
        print('%-20s' % result[0] + '%7s %%' % str(round(float(100 * result[1]), 4)))


example_text = 'ogldviisnntmeyoiiesettpetorotrcitglloeleiengehorntsnraviedeenltseaecithooheinsnstiofwtoienaoaeefiitaeeauobmeeetdmsflteightnttxipecnlgtetgteyhatncdisaceahrfomseehmsindrlttdthoaranthahdgasaebeaturoehtrnnanftxndaeeiposttmnhgttagtsheitistrrcudf'
print(example_text)
get_propabilities(example_text + '\n')
print('\n')
example_text2 = 'Dies ist ein kurzer Beispielsatz.'
print(example_text2)
get_propabilities(example_text2 + '\n')
ogldviisnntmeyoiiesettpetorotrcitglloeleiengehorntsnraviedeenltseaecithooheinsnstiofwtoienaoaeefiitaeeauobmeeetdmsflteightnttxipecnlgtetgteyhatncdisaceahrfomseehmsindrlttdthoaranthahdgasaebeaturoehtrnnanftxndaeeiposttmnhgttagtsheitistrrcudf
Danish                  0.0 %
Dutch                   0.0 %
English               100.0 %
Finnish                 0.0 %
French                  0.0 %
German                  0.0 %
Italian                 0.0 %
Portuguese              0.0 %
Spanish                 0.0 %
Swedish                 0.0 %


Dies ist ein kurzer Beispielsatz.
Danish                  0.0 %
Dutch                   0.0 %
English                 0.0 %
Finnish                 0.0 %
French              18.1818 %
German              72.7273 %
Italian              9.0909 %
Portuguese              0.0 %
Spanish                 0.0 %
Swedish                 0.0 %

Background and Insights

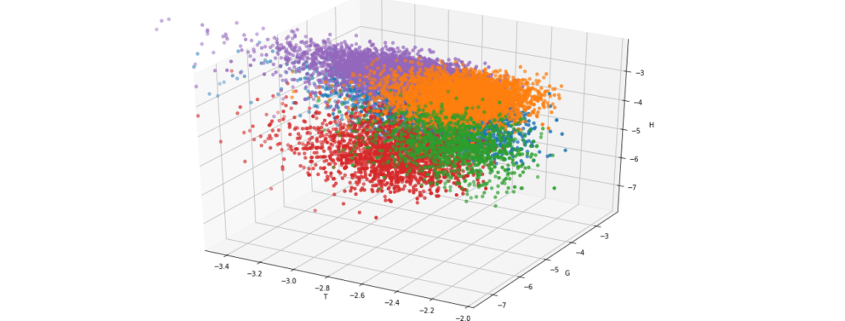
Why does a relative simple model like counting letters acutally work? Every language has a specific pattern of letter frequencies which can be used as a kind of fingerprint: While there are almost no y‘s in the german language this letter is quite common in english. In french the letter k is not very common because it is replaced with q in most cases.

For a better understanding look at the output of the following code snipplet where only three letters already lead to a noticable form of clustering:

projection='3d')
legend = []
X, Y, Z = 'e', 'g', 'h'

def iterlog(ln):
    retvals = []
    for n in ln:
        try:
            retvals.append(np.log(n))
        except:
            retvals.append(None)
    return retvals

for X in ['t']:
    ax = plt.axes(projection='3d')
    ax.xy_viewLim.intervalx = [-3.5, -2]
    legend = []
    for lang in [l for l in df.groupby('lang') if l[0] in {'German', 'English', 'Finnish', 'French', 'Danish'}]:
        sample = lang[1].sample(4000)

        legend.append(lang[0])
        ax.scatter3D(iterlog(sample[X]), iterlog(sample[Y]), iterlog(sample[Z]))

    ax.set_title('log(10) of the Relativ Frequencies of "' + X.upper() + "', '" + Y.upper() + '" and "' + Z.upper() + '"\n\n')
    ax.set_xlabel(X.upper())
    ax.set_ylabel(Y.upper())
    ax.set_zlabel(Z.upper())
    plt.legend(legend)
    plt.show()
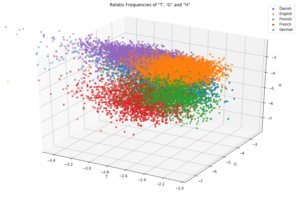
 

Even though every single letter frequency by itself is not a very reliable indicator, the set of frequencies of all present letters in a text is a quite good evidence because it will more or less represent the letter frequency fingerprint of the given language. Since it is quite hard to imagine or visualize the above plot in more than three dimensions, I used a little trick which shows that every language has its own typical fingerprint of letter frequencies:

legend = []
fig = plt.figure(figsize=(15, 10))
plt.axes(yscale='log')
    
langs = defaultdict(list)

for lang in [l for l in df.groupby('lang') if l[0] in set(df['lang'])]:
    for feature in 'abcdefghijklmnopqrstuvwxyz':
        langs[lang[0]].append(lang[1][feature].mean())

mean_frequencies = {feature:df[feature].mean() for feature in 'abcdefghijklmnopqrstuvwxyz'}
for i in langs.items():
    legend.append(i[0])
    j = np.array(i[1]) / np.array([mean_frequencies[c] for c in 'abcdefghijklmnopqrstuvwxyz'])
    plt.plot([c for c in 'abcdefghijklmnopqrstuvwxyz'], j)
plt.title('Log. of relative Frequencies compared to the mean Frequency in all texts')
plt.xlabel('Letters')
plt.ylabel('(log(Lang. Frequencies / Mean Frequency)')
plt.legend(legend)
plt.grid()
plt.show()
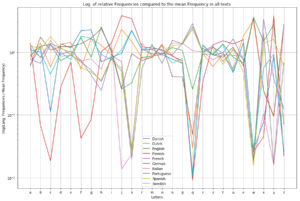
What more?

Beside the fact, that letter frequencies alone, allow us to predict the language of every example text (at least in the 10 languages with latin alphabet we trained for) with almost complete certancy there is even more information hidden in the set of sample texts.

As you might know, most languages in europe belong to either the romanian or the indogermanic language family (which is actually because the romans conquered only half of europe). The border between them could be located in belgium, between france and germany and in swiss. West of this border the romanian languages, which originate from latin, are still spoken, like spanish, portouguese and french. In the middle and northern part of europe the indogermanic languages are very common like german, dutch, swedish ect. If we plot the analysed languages with a different colour sheme this border gets quite clear and allows us to take a look back in history that tells us where our languages originate from:

legend = []
fig = plt.figure(figsize=(15, 10))
plt.axes(yscale='linear')
    
langs = defaultdict(list)
for lang in [l for l in df.groupby('lang') if l[0] in {'German', 'English', 'French', 'Spanish', 'Portuguese', 'Dutch', 'Swedish', 'Danish', 'Italian'}]:
    for feature in 'abcdefghijklmnopqrstuvwxyz':
        langs[lang[0]].append(lang[1][feature].mean())

colordict = {l[0]:l[1] for l in zip([lang for lang in langs], ['brown', 'tomato', 'orangered',
                                                               'green', 'red', 'forestgreen', 'limegreen',
                                                               'darkgreen', 'darkred'])}
mean_frequencies = {feature:df[feature].mean() for feature in 'abcdefghijklmnopqrstuvwxyz'}
for i in langs.items():
    legend.append(i[0])
    j = np.array(i[1]) / np.array([mean_frequencies[c] for c in 'abcdefghijklmnopqrstuvwxyz'])
    plt.plot([c for c in 'abcdefghijklmnopqrstuvwxyz'], j, color=colordict[i[0]])
#     plt.plot([c for c in 'abcdefghijklmnopqrstuvwxyz'], i[1], color=colordict[i[0]])
plt.title('Log. of relative Frequencies compared to the mean Frequency in all texts')
plt.xlabel('Letters')
plt.ylabel('(log(Lang. Frequencies / Mean Frequency)')
plt.legend(legend)
plt.grid()
plt.show()
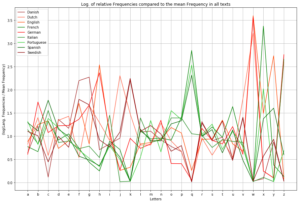
As you can see the more common letters, especially the vocals like a, e, i, o and u have almost the same frequency in all of this languages. Far more interesting are letters like q, k, c and w: While k is quite common in all of the indogermanic languages it is quite rare in romanic languages because the same sound is written with the letters q or c.
As a result it could be said, that even “boring” sets of data (just give it a try and read all the texts of the protocolls of the EU parliament…) could contain quite interesting patterns which – in this case – allows us to predict quite precisely which language a given text sample is written in, without the need of any translation program or to speak the languages. And as an interesting side effect, where certain things in history happend (or not happend): After two thousand years have passed, modern machine learning techniques could easily uncover this history because even though all these different languages developed, they still have a set of hidden but common patterns that since than stayed the same.
Sentiment Analysis using Python

One of the applications of text mining is sentiment analysis. Most of the data is getting generated in textual format and in the past few years, people are talking more about NLP. Improvement is a continuous process many product based companies leverage these text mining techniques to examine the sentiments of the customers to find about what they can improve in the product. This information also helps them to understand the trend and demand of the end user which results in Customer satisfaction.

As text mining is a vast concept, the article is divided into two subchapters. The main focus of this article will be calculating two scores: sentiment polarity and subjectivity using python. The range of polarity is from -1 to 1(negative to positive) and will tell us if the text contains positive or negative feedback. Most companies prefer to stop their analysis here but in our second article, we will try to extend our analysis by creating some labels out of these scores. Finally, a multi-label multi-class classifier can be trained to predict future reviews.

Without any delay let’s deep dive into the code and mine some knowledge from textual data.

There are a few NLP libraries existing in Python such as Spacy, NLTK, gensim, TextBlob, etc. For this particular article, we will be using NLTK for pre-processing and TextBlob to calculate sentiment polarity and subjectivity.

import pandas as pd
import matplotlib.pyplot as plt
%matplotlib inline  
import nltk
from nltk import word_tokenize, sent_tokenize
from nltk.corpus import stopwords
from nltk.stem import LancasterStemmer, WordNetLemmatizer, PorterStemmer
from wordcloud import WordCloud, STOPWORDS
from textblob import TextBlob

The dataset is available here for download and we will be using pandas read_csv function to import the dataset. I would like to share an additional information here which I came to know about recently. Those who have already used python and pandas before they probably know that read_csv is by far one of the most used function. However, it can take a while to upload a big file. Some folks from  RISELab at UC Berkeley created Modin or Pandas on Ray which is a library that speeds up this process by changing a single line of code.

amz_reviews = pd.read_csv("1429_1.csv")

After importing the dataset it is recommended to understand it first and study the structure of the dataset. At this point we are interested to know how many columns are there and what are these columns so I am going to check the shape of the data frame and go through each column name to see if we need them or not.

amz_reviews.shape
(34660, 21)

amz_reviews.columns
Index(['id', 'name', 'asins', 'brand', 'categories', 'keys', 'manufacturer',
       'reviews.date', 'reviews.dateAdded', 'reviews.dateSeen',
       'reviews.didPurchase', 'reviews.doRecommend', 'reviews.id',
       'reviews.numHelpful', 'reviews.rating', 'reviews.sourceURLs',
       'reviews.text', 'reviews.title', 'reviews.userCity',
       'reviews.userProvince', 'reviews.username'],
      dtype='object')


There are so many columns which are not useful for our sentiment analysis and it’s better to remove these columns. There are many ways to do that: either just select the columns which you want to keep or select the columns you want to remove and then use the drop function to remove it from the data frame. I prefer the second option as it allows me to look at each column one more time so I don’t miss any important variable for the analysis.

columns = ['id','name','keys','manufacturer','reviews.dateAdded', 'reviews.date','reviews.didPurchase',
          'reviews.userCity', 'reviews.userProvince', 'reviews.dateSeen', 'reviews.doRecommend','asins',
          'reviews.id', 'reviews.numHelpful', 'reviews.sourceURLs', 'reviews.title']

df = pd.DataFrame(amz_reviews.drop(columns,axis=1,inplace=False))

Now let’s dive deep into the data and try to mine some knowledge from the remaining columns. The first step we would want to follow here is just to look at the distribution of the variables and try to make some notes. First, let’s look at the distribution of the ratings.

df['reviews.rating'].value_counts().plot(kind='bar')

Graphs are powerful and at this point, just by looking at the above bar graph we can conclude that most people are somehow satisfied with the products offered at Amazon. The reason I am saying ‘at’ Amazon is because it is just a platform where anyone can sell their products and the user are giving ratings to the product and not to Amazon. However, if the user is satisfied with the products it also means that Amazon has a lower return rate and lower fraud case (from seller side). The job of a Data Scientist relies not only on how good a model is but also on how useful it is for the business and that’s why these business insights are really important.

Data pre-processing for textual variables

Lowercasing

Before we move forward to calculate the sentiment scores for each review it is important to pre-process the textual data. Lowercasing helps in the process of normalization which is an important step to keep the words in a uniform manner (Welbers, et al., 2017, pp. 245-265).

## Change the reviews type to string
df['reviews.text'] = df['reviews.text'].astype(str)

## Before lowercasing 
df['reviews.text'][2]
'Inexpensive tablet for him to use and learn on, step up from the NABI. He was thrilled with it, learn how to Skype on it 
already...'

## Lowercase all reviews
df['reviews.text'] = df['reviews.text'].apply(lambda x: " ".join(x.lower() for x in x.split()))
df['reviews.text'][2] ## to see the difference
'inexpensive tablet for him to use and learn on, step up from the nabi. he was thrilled with it, learn how to skype on it 
already...'

Special characters

Special characters are non-alphabetic and non-numeric values such as {!,@#$%^ *()~;:/<>|+_-[]?}. Dealing with numbers is straightforward but special characters can be sometimes tricky. During tokenization, special characters create their own tokens and again not helpful for any algorithm, likewise, numbers.

## remove punctuation
df['reviews.text'] = df['reviews.text'].str.replace('[^ws]','')
df['reviews.text'][2]
'inexpensive tablet for him to use and learn on step up from the nabi he was thrilled with it learn how to skype on it already'

Stopwords

Stop-words being most commonly used in the English language; however, these words have no predictive power in reality. Words such as I, me, myself, he, she, they, our, mine, you, yours etc.

stop = stopwords.words('english')
df['reviews.text'] = df['reviews.text'].apply(lambda x: " ".join(x for x in x.split() if x not in stop))
df['reviews.text'][2]
'inexpensive tablet use learn step nabi thrilled learn skype already'

Stemming

Stemming algorithm is very useful in the field of text mining and helps to gain relevant information as it reduces all words with the same roots to a common form by removing suffixes such as -action, ing, -es and -ses. However, there can be problematic where there are spelling errors.

st = PorterStemmer()
df['reviews.text'] = df['reviews.text'].apply(lambda x: " ".join([st.stem(word) for word in x.split()]))
df['reviews.text'][2]
'inexpens tablet use learn step nabi thrill learn skype alreadi'

This step is extremely useful for pre-processing textual data but it also depends on your goal. Here our goal is to calculate sentiment scores and if you look closely to the above code words like ‘inexpensive’ and ‘thrilled’ became ‘inexpens’ and ‘thrill’ after applying this technique. This will help us in text classification to deal with the curse of dimensionality but to calculate the sentiment score this process is not useful.

Sentiment Score

It is now time to calculate sentiment scores of each review and check how these scores look like.

## Define a function which can be applied to calculate the score for the whole dataset

def senti(x):
    return TextBlob(x).sentiment  

df['senti_score'] = df['reviews.text'].apply(senti)

df.senti_score.head()

0                                   (0.3, 0.8)
1                                (0.65, 0.675)
2                                   (0.0, 0.0)
3    (0.29545454545454547, 0.6492424242424243)
4                    (0.5, 0.5827777777777777)
Name: senti_score, dtype: object

As it can be observed there are two scores: the first score is sentiment polarity which tells if the sentiment is positive or negative and the second score is subjectivity score to tell how subjective is the text.

In my next article, we will extend this analysis by creating labels based on these scores and finally we will train a classification model.

Sentiment Analysis using Python

One of the applications of text mining is sentiment analysis. Most of the data is getting generated in textual format and in the past few years, people are talking more about NLP. Improvement is a continuous process and many product based companies leverage these text mining techniques to examine the sentiments of the customers to find about what they can improve in the product. This information also helps them to understand the trend and demand of the end user which results in Customer satisfaction.

As text mining is a vast concept, the article is divided into two subchapters. The main focus of this article will be calculating two scores: sentiment polarity and subjectivity using python. The range of polarity is from -1 to 1(negative to positive) and will tell us if the text contains positive or negative feedback. Most companies prefer to stop their analysis here but in our second article, we will try to extend our analysis by creating some labels out of these scores. Finally, a multi-label multi-class classifier can be trained to predict future reviews.

Without any delay let’s deep dive into the code and mine some knowledge from textual data.

There are a few NLP libraries existing in Python such as Spacy, NLTK, gensim, TextBlob, etc. For this particular article, we will be using NLTK for pre-processing and TextBlob to calculate sentiment polarity and subjectivity.

import pandas as pd
import matplotlib.pyplot as plt
%matplotlib inline  
import nltk
from nltk import word_tokenize, sent_tokenize
from nltk.corpus import stopwords
from nltk.stem import LancasterStemmer, WordNetLemmatizer, PorterStemmer
from wordcloud import WordCloud, STOPWORDS
from textblob import TextBlob

The dataset is available here for download and we will be using pandas read_csv function to import the dataset. I would like to share an additional information here which I came to know about recently. Those who have already used python and pandas before they probably know that read_csv is by far one of the most used function. However, it can take a while to upload a big file. Some folks from  RISELab at UC Berkeley created Modin or Pandas on Ray which is a library that speeds up this process by changing a single line of code.

amz_reviews = pd.read_csv("1429_1.csv")

After importing the dataset it is recommended to understand it first and study the structure of the dataset. At this point we are interested to know how many columns are there and what are these columns so I am going to check the shape of the data frame and go through each column name to see if we need them or not.

amz_reviews.shape
(34660, 21)

amz_reviews.columns
Index(['id', 'name', 'asins', 'brand', 'categories', 'keys', 'manufacturer',
       'reviews.date', 'reviews.dateAdded', 'reviews.dateSeen',
       'reviews.didPurchase', 'reviews.doRecommend', 'reviews.id',
       'reviews.numHelpful', 'reviews.rating', 'reviews.sourceURLs',
       'reviews.text', 'reviews.title', 'reviews.userCity',
       'reviews.userProvince', 'reviews.username'],
      dtype='object')


There are so many columns which are not useful for our sentiment analysis and it’s better to remove these columns. There are many ways to do that: either just select the columns which you want to keep or select the columns you want to remove and then use the drop function to remove it from the data frame. I prefer the second option as it allows me to look at each column one more time so I don’t miss any important variable for the analysis.

columns = ['id','name','keys','manufacturer','reviews.dateAdded', 'reviews.date','reviews.didPurchase',
          'reviews.userCity', 'reviews.userProvince', 'reviews.dateSeen', 'reviews.doRecommend','asins',
          'reviews.id', 'reviews.numHelpful', 'reviews.sourceURLs', 'reviews.title']

df = pd.DataFrame(amz_reviews.drop(columns,axis=1,inplace=False))

Now let’s dive deep into the data and try to mine some knowledge from the remaining columns. The first step we would want to follow here is just to look at the distribution of the variables and try to make some notes. First, let’s look at the distribution of the ratings.

df['reviews.rating'].value_counts().plot(kind='bar')

Graphs are powerful and at this point, just by looking at the above bar graph we can conclude that most people are somehow satisfied with the products offered at Amazon. The reason I am saying ‘at’ Amazon is because it is just a platform where anyone can sell their products and the user are giving ratings to the product and not to Amazon. However, if the user is satisfied with the products it also means that Amazon has a lower return rate and lower fraud case (from seller side). The job of a Data Scientist relies not only on how good a model is but also on how useful it is for the business and that’s why these business insights are really important.

Data pre-processing for textual variables

Lowercasing

Before we move forward to calculate the sentiment scores for each review it is important to pre-process the textual data. Lowercasing helps in the process of normalization which is an important step to keep the words in a uniform manner (Welbers, et al., 2017, pp. 245-265).

## Change the reviews type to string
df['reviews.text'] = df['reviews.text'].astype(str)

## Before lowercasing 
df['reviews.text'][2]
'Inexpensive tablet for him to use and learn on, step up from the NABI. He was thrilled with it, learn how to Skype on it 
already...'

## Lowercase all reviews
df['reviews.text'] = df['reviews.text'].apply(lambda x: " ".join(x.lower() for x in x.split()))
df['reviews.text'][2] ## to see the difference
'inexpensive tablet for him to use and learn on, step up from the nabi. he was thrilled with it, learn how to skype on it 
already...'

Special characters

Special characters are non-alphabetic and non-numeric values such as {!,@#$%^ *()~;:/<>|+_-[]?}. Dealing with numbers is straightforward but special characters can be sometimes tricky. During tokenization, special characters create their own tokens and again not helpful for any algorithm, likewise, numbers.

## remove punctuation
df['reviews.text'] = df['reviews.text'].str.replace('[^ws]','')
df['reviews.text'][2]
'inexpensive tablet for him to use and learn on step up from the nabi he was thrilled with it learn how to skype on it already'

Stopwords

Stop-words being most commonly used in the English language; however, these words have no predictive power in reality. Words such as I, me, myself, he, she, they, our, mine, you, yours etc.

stop = stopwords.words('english')
df['reviews.text'] = df['reviews.text'].apply(lambda x: " ".join(x for x in x.split() if x not in stop))
df['reviews.text'][2]
'inexpensive tablet use learn step nabi thrilled learn skype already'

Stemming

Stemming algorithm is very useful in the field of text mining and helps to gain relevant information as it reduces all words with the same roots to a common form by removing suffixes such as -action, ing, -es and -ses. However, there can be problematic where there are spelling errors.

st = PorterStemmer()
df['reviews.text'] = df['reviews.text'].apply(lambda x: " ".join([st.stem(word) for word in x.split()]))
df['reviews.text'][2]
'inexpens tablet use learn step nabi thrill learn skype alreadi'

This step is extremely useful for pre-processing textual data but it also depends on your goal. Here our goal is to calculate sentiment scores and if you look closely to the above code words like ‘inexpensive’ and ‘thrilled’ became ‘inexpens’ and ‘thrill’ after applying this technique. This will help us in text classification to deal with the curse of dimensionality but to calculate the sentiment score this process is not useful.

Sentiment Score

It is now time to calculate sentiment scores of each review and check how these scores look like.

## Define a function which can be applied to calculate the score for the whole dataset

def senti(x):
    return TextBlob(x).sentiment  

df['senti_score'] = df['reviews.text'].apply(senti)

df.senti_score.head()

0                                   (0.3, 0.8)
1                                (0.65, 0.675)
2                                   (0.0, 0.0)
3    (0.29545454545454547, 0.6492424242424243)
4                    (0.5, 0.5827777777777777)
Name: senti_score, dtype: object

As it can be observed there are two scores: the first score is sentiment polarity which tells if the sentiment is positive or negative and the second score is subjectivity score to tell how subjective is the text. The whole code is available here.

In my next article, we will extend this analysis by creating labels based on these scores and finally we will train a classification model.

How To Remotely Send R and Python Execution to SQL Server from Jupyter Notebooks

Introduction

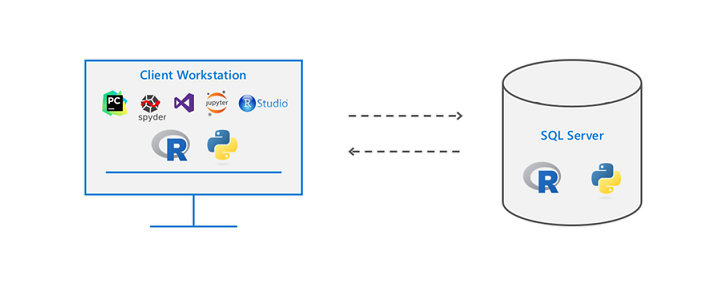
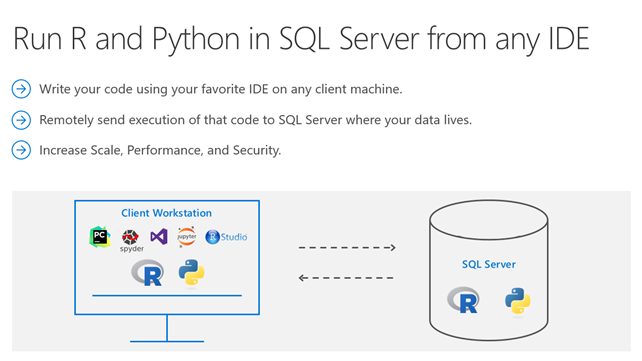
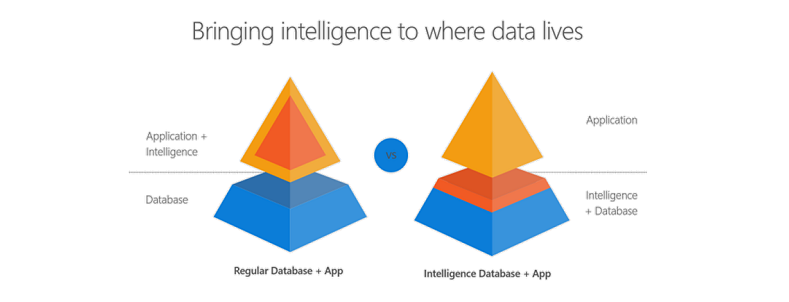
Did you know that you can execute R and Python code remotely in SQL Server from Jupyter Notebooks or any IDE? Machine Learning Services in SQL Server eliminates the need to move data around. Instead of transferring large and sensitive data over the network or losing accuracy on ML training with sample csv files, you can have your R/Python code execute within your database. You can work in Jupyter Notebooks, RStudio, PyCharm, VSCode, Visual Studio, wherever you want, and then send function execution to SQL Server bringing intelligence to where your data lives.

This tutorial will show you an example of how you can send your python code from Juptyter notebooks to execute within SQL Server. The same principles apply to R and any other IDE as well. If you prefer to learn through videos, this tutorial is also published on YouTube here:


Environment Setup Prerequisites

  1. Install ML Services on SQL Server

In order for R or Python to execute within SQL, you first need the Machine Learning Services feature installed and configured. See this how-to guide.

  1. Install RevoscalePy via Microsoft’s Python Client

In order to send Python execution to SQL from Jupyter Notebooks, you need to use Microsoft’s RevoscalePy package. To get RevoscalePy, download and install Microsoft’s ML Services Python Client. Documentation Page or Direct Download Link (for Windows).

After downloading, open powershell as an administrator and navigate to the download folder. Start the installation with this command (feel free to customize the install folder): .\Install-PyForMLS.ps1 -InstallFolder “C:\Program Files\MicrosoftPythonClient”

Be patient while the installation can take a little while. Once installed navigate to the new path you installed in. Let’s make an empty folder and open Jupyter Notebooks: mkdir JupyterNotebooks; cd JupyterNotebooks; ..\Scripts\jupyter-notebook

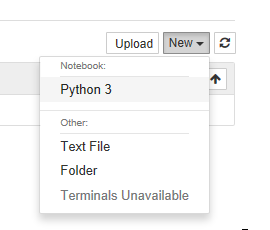
Create a new notebook with the Python 3 interpreter:


To test if everything is setup, import revoscalepy in the first cell and execute. If there are no error messages you are ready to move forward.

Database Setup (Required for this tutorial only)

For the rest of the tutorial you can clone this Jupyter Notebook from Github if you don’t want to copy paste all of the code. This database setup is a one time step to ensure you have the same data as this tutorial. You don’t need to perform any of these setup steps to use your own data.

  1. Create a database

Modify the connection string for your server and use pyodbc to create a new database.

import pyodbc  
# creating a new db to load Iris sample in 
new_db_name = "MLRemoteExec" connection_string = "Driver=SQL Server;Server=localhost\MSSQLSERVER2017;Database={0};Trusted_Connection=Yes;" 

cnxn = pyodbc.connect(connection_string.format("master"), autocommit=True) 

cnxn.cursor().execute("IF EXISTS(SELECT * FROM sys.databases WHERE [name] = '{0}') DROP DATABASE {0}".format(new_db_name)) 

cnxn.cursor().execute("CREATE DATABASE " + new_db_name)

cnxn.close()

print("Database created") 
  1. Import Iris sample from SkLearn

Iris is a popular dataset for beginner data science tutorials. It is included by default in sklearn package.

from sklearn import datasetsimport pandas as pd
# SkLearn has the Iris sample dataset built in to the packageiris = datasets.load_iris()
df = pd.DataFrame(iris.data, columns=iris.feature_names)
  1. Use RecoscalePy APIs to create a table and load the Iris data

(You can also do this with pyodbc, sqlalchemy or other packages)

from revoscalepy import RxSqlServerData, rx_data_step
# Example of using RX APIs to load data into SQL table. You can also do this with pyodbc
table_ref = RxSqlServerData(connection_string=connection_string.format(new_db_name), table="Iris")rx_data_step(input_data = df, output_file = table_ref, overwrite = True)print("New Table Created: Iris")
print("Sklearn Iris sample loaded into Iris table")

Define a Function to Send to SQL Server

Write any python code you want to execute in SQL. In this example we are creating a scatter matrix on the iris dataset and only returning the bytestream of the .png back to Jupyter Notebooks to render on our client.

def send_this_func_to_sql():
    from revoscalepy import RxSqlServerData, rx_import
    from pandas.tools.plotting import scatter_matrix
    import matplotlib.pyplot as plt
    import io    
# remember the scope of the variables in this func are within our SQL Server Python Runtime
    connection_string = "Driver=SQL Server;Server=localhost\MSSQLSERVER2017; Database=MLRemoteExec;Trusted_Connection=Yes;"

# specify a query and load into pandas dataframe df
    sql_query = RxSqlServerData(connection_string=connection_string, sql_query = "select * from Iris")

    df = rx_import(sql_query)
    scatter_matrix(df)

# return bytestream of image created by scatter_matrix
    buf = io.BytesIO()
    plt.savefig(buf, format="png")
    buf.seek(0)
    return buf.getvalue()

Send execution to SQL

Now that we are finally set up, check out how easy sending remote execution really is! First, import revoscalepy. Create a sql_compute_context, and then send the execution of any function seamlessly to SQL Server with RxExec. No raw data had to be transferred from SQL to the Jupyter Notebook. All computation happened within the database and only the image file was returned to be displayed.

from IPython import display
import matplotlib.pyplot as plt 
from revoscalepy import RxInSqlServer, rx_exec# create a remote compute context with connection to SQL Server

sql_compute_context = RxInSqlServer(connection_string=connection_string.format(new_db_name))

# use rx_exec to send the function execution to SQL Server

image = rx_exec(send_this_func_to_sql, compute_context=sql_compute_context)[0]

# only an image was returned to my jupyter client. All data remained secure and was manipulated in my db.

display.Image(data=image)

While this example is trivial with the Iris dataset, imagine the additional scale, performance, and security capabilities that you now unlocked. You can use any of the latest open source R/Python packages to build Deep Learning and AI applications on large amounts of data in SQL Server. We also offer leading edge, high-performance algorithms in Microsoft’s RevoScaleR and RevoScalePy APIs. Using these with the latest innovations in the open source world allows you to bring unparalleled selection, performance, and scale to your applications.

Learn More

Check out SQL Machine Learning Services Documentation to learn how you can easily deploy your R/Python code with SQL stored procedures making them accessible in your ETL processes or to any application. Train and store machine learning models in your database bringing intelligence to where your data lives.

Other YouTube Tutorials:

Bringing intelligence to where data lives: Python & R embedded in T-SQL

Introduction

Did you know that you can write R and Python code within your T-SQL statements? Machine Learning Services in SQL Server eliminates the need for data movement. Instead of transferring large and sensitive data over the network or losing accuracy with sample csv files, you can have your R/Python code execute within your database. Easily deploy your R/Python code with SQL stored procedures making them accessible in your ETL processes or to any application. Train and store machine learning models in your database bringing intelligence to where your data lives.

You can install and run any of the latest open source R/Python packages to build Deep Learning and AI applications on large amounts of data in SQL Server. We also offer leading edge, high-performance algorithms in Microsoft’s RevoScaleR and RevoScalePy APIs. Using these with the latest innovations in the open source world allows you to bring unparalleled selection, performance, and scale to your applications.

If you are excited to try out SQL Server Machine Learning Services, check out the hands on tutorial below. If you do not have Machine Learning Services installed in SQL Server,you will first want to follow the getting started tutorial I published here: 

How-To Tutorial

In this tutorial, I will cover the basics of how to Execute R and Python in T-SQL statements. If you prefer learning through videos, I also published the tutorial on YouTube.

Basics

Open up SQL Server Management Studio and make a connection to your server. Open a new query and paste this basic example: (While I use Python in these samples, you can do everything with R as well)

EXEC sp_execute_external_script @language = N'Python',
@script = N'print(3+4)'

Sp_execute_external_script is a special system stored procedure that enables R and Python execution in SQL Server. There is a “language” parameter that allows us to choose between Python and R. There is a “script” parameter where we can paste R or Python code. If you do not see an output print 7, go back and review the setup steps in this article.

Parameter Introduction

Now that we discussed a basic example, let’s start adding more pieces:

EXEC sp_execute_external_script  @language =N'Python', 
@script = N' 
OutputDataSet = InputDataSet;
',
@input_data_1 =N'SELECT 1 AS Col1';

Machine Learning Services provides more natural communications between SQL and R/Python with an input data parameter that accepts any SQL query. The input parameter name is called “input_data_1”.
You can see in the python code that there are default variables defined to pass data between Python and SQL. The default variable names are “OutputDataSet” and “InputDataSet” You can change these default names like this example:

EXEC sp_execute_external_script  @language =N'Python', 
@script = N' 
MyOutput = MyInput;
',
@input_data_1_name = N'MyInput',
@input_data_1 =N'SELECT 1 AS foo',
@output_data_1_name =N'MyOutput';

As you executed these examples, you might have noticed that they each return a result with “(No column name)”? You can specify a name for the columns that are returned by adding the WITH RESULT SETS clause to the end of the statement which is a comma separated list of columns and their datatypes.

EXEC sp_execute_external_script  @language =N'Python', 
@script=N' 
MyOutput = MyInput;
',
@input_data_1_name = N'MyInput',
@input_data_1 =N'
SELECT 1 AS foo,
2 AS bar
',
@output_data_1_name =N'MyOutput'
WITH RESULT SETS ((MyColName int, MyColName2 int));

Input/Output Data Types

Alright, let’s discuss a little more about the input/output data types used between SQL and Python. Your input SQL SELECT statement passes a “Dataframe” to python relying on the Python Pandas package. Your output from Python back to SQL also needs to be in a Pandas Dataframe object. If you need to convert scalar values into a dataframe here is an example:

EXEC sp_execute_external_script  @language =N'Python', 
@script=N' 
import pandas as pd
c = 1/2
d = 1*2
s = pd.Series([c,d])
df = pd.DataFrame(s)
OutputDataSet = df
'

Variables c and d are both scalar values, which you can add to a pandas Series if you like, and then convert them to a pandas dataframe. This one shows a little bit more complicated example, go read up on the python pandas package documentation for more details and examples:

EXEC sp_execute_external_script  @language =N'Python', 
@script=N' 
import pandas as pd
s = {"col1": [1, 2], "col2": [3, 4]}
df = pd.DataFrame(s)
OutputDataSet = df
'

You now know the basics to execute Python in T-SQL!

Did you know you can also write your R and Python code in your favorite IDE like RStudio and Jupyter Notebooks and then remotely send the execution of that code to SQL Server? Check out these documentation links to learn more: https://aka.ms/R-RemoteSQLExecution https://aka.ms/PythonRemoteSQLExecution

Check out the SQL Server Machine Learning Services documentation page for more documentation, samples, and solutions. Check out these E2E tutorials on github as well.

Would love to hear from you! Leave a comment below to ask a question, or start a discussion!