Tag Archive for: Python

Why using Infrastructure as Code for developing Cloud-based Data Warehouse Systems?

In the contemporary age of Big Data, Data Warehouse Systems and Data Science Analytics Infrastructures have become an essential component for organizations to store, analyze, and make data-driven decisions. With the evolution of cloud computing, many organizations are now migrating their Data Warehouse Systems to the cloud for better scalability, flexibility, and cost-efficiency. Infrastructure as Code (IaC) can be a game-changer in this scenario. By automating the provisioning and management of cloud resources through code, IaC brings a host of advantages to the development and maintenance of Data Warehouse Systems in the cloud.

So why using IaC for Cloud Data Infrastructures?

Of course you – as a human user – can always login into the admin portal of any cloud provider and manually get your resources like SQL databases, ETL tools, Virtual Networks and tools like Synapse, snowflake, BigQuery or Databrikcs in place by clicking on the right buttons….. But here is why you should better follow the idea of having your code explaining which resources are in what order in place in your cloud:

Version Control for your Cloud Infrastructure

One of the primary advantages of using IaC is version control for your Data Warehouse – or Data Lakehouse – Architecture. Whether you’re using Redshift, Snowflake, or any other cloud-based data warehouse solutions, you can codify your architecture settings, allowing you to track changes over time. This ensures a reliable and consistent development environment and makes it easier to identify issues, rollback updates, or replicate the architecture for other projects.

Scalability Tailored for Data Needs

Data Warehouse Systems often require to scale quickly to handle larger datasets or more queries. Traditional manual scaling methods are cumbersome and slow. IaC allows for efficient auto-scaling based on real-time needs. You can write scripts to automatically provision or de-provision resources depending on your data workloads, making your data warehouse highly adaptive to your organization’s changing requirements.

Cost-Efficiency in Resource Allocation

Cloud resources are priced based on usage, so efficient allocation is crucial for managing costs. IaC enables precise control over cloud resources, allowing you to turn them off when not in use or allocate more resources during peak times. For Data Warehouse Systems that often require powerful (and expensive) computing resources, this level of control can translate into significant cost savings.

Streamlined Collaboration Among Teams

Data Warehouse Systems in the cloud often involve cross-functional teams — data engineers, data scientists, and system administrators. IaC allows these teams to collaborate more effectively. Everyone works with the same infrastructure configurations, reducing discrepancies between development, staging, and production environments. This ensures that the data models and queries developed by data professionals are consistent with the underlying infrastructure.

Enhanced Security and Compliance

Data Warehouses often store sensitive information, making security a paramount concern. IaC allows security configurations to be codified and automated, ensuring that every new resource or service deployed complies with organizational and regulatory guidelines. This proactive security approach is particularly beneficial for industries that have to adhere to strict compliance rules like HIPAA or GDPR.

Reliable Environment for Data Operations

Manual configurations are prone to human error, which can compromise the reliability of a Data Warehouse System. IaC mitigates this risk by automating repetitive tasks, ensuring that the infrastructure is consistently provisioned. This brings reliability to data ETL (Extract, Transform, Load) processes, query performances, and other critical data operations.

Documentation and Disaster Recovery Made Easy

Data is the lifeblood of any organization, and losing it can be catastrophic. IaC allows for swift disaster recovery by codifying the entire infrastructure. If a disaster occurs, the infrastructure can be quickly recreated, reducing downtime and data loss.

Most common IaC solutions

The most common tools for creating Cloud Infrastructure as Code are probably Terraform and Pulumi. However, IaC solutions can be very different in their concepts. For example: While Terraform is a pure declarative configuration language that just describes how the infrastructure will look like (execution then by the Terraform-supporting Cloud Provider), Pulumi on the other hand will execute the deployment by a programming language iteratively deploying the wished cloud resources (e.g. using for loops in Python). While executing Pulumi in any supported programming language like Python or C#, Pulumi generates declarative Infrastructure build plans for the Cloud. Any IaC solution is declaring how the infrastrcture looks like.

Terraform

Terraform is one of the most widely used Infrastructure as Code (IaC) tools, developed by HashiCorp. It enables users to define and provision a data center infrastructure using a declarative configuration language known as HashiCorp Configuration Language (HCL).

The following Terraform script will create an Azure Resource Group, a SQL Server, and a SQL Database. It will also output the fully qualified domain name (FQDN) of the SQL Server, which you can use to connect to the database:

provider "azurerm" {
  features {}
}

resource "azurerm_resource_group" "example" {
  name     = "example-resources"
  location = "East US"
}

resource "azurerm_sql_server" "example" {
  name                         = "example-sqlserver"
  resource_group_name          = azurerm_resource_group.example.name
  location                     = azurerm_resource_group.example.location
  version                      = "12.0"
  administrator_login          = "adminUser"
  administrator_login_password = "adminPassword1234!"
}

resource "azurerm_sql_database" "example" {
  name                = "example-sqldb"
  resource_group_name = azurerm_resource_group.example.name
  server_name         = azurerm_sql_server.example.name
  location            = azurerm_resource_group.example.location
  edition             = "Basic"
}

output "sql_server_fqdn" {
  value = azurerm_sql_server.example.fully_qualified_domain_name
}

The HCL code needs to be placed into the Terrafirm main.tf file. Of course, Terraform and the Azure CLI needs to be installed before.

Pulumi

Pulumi is a modern Infrastructure as Code (IaC) tool that sets itself apart by allowing infrastructure to be defined using general-purpose programming languages like Python, TypeScript, Go, and C#.

Example of a Pulumi Python script creating a SQL Database on Microsoft Azure Cloud:

import * as pulumi from "@pulumi/pulumi";
import * as azure from "@pulumi/azure";

// Create an Azure Resource Group
const resourceGroup = new azure.core.ResourceGroup("myResourceGroup", {
    location: "EastUS",
});

// Create an Azure SQL Server
const sqlServer = new azure.sql.SqlServer("mySqlServer", {
    resourceGroupName: resourceGroup.name,
    location: resourceGroup.location,
    version: "12.0",
    administratorLogin: "adminUser",
    administratorLoginPassword: "adminPassword1234!",
});

// Create an Azure SQL Database on the SQL Server
const sqlDatabase = new azure.sql.Database("mySqlDatabase", {
    resourceGroupName: resourceGroup.name,
    serverName: sqlServer.name,
    location: resourceGroup.location,
    edition: "Basic",
});

// Export connection string for the SQL Database
export const sqlConnectionString = pulumi.all([sqlServer.name, resourceGroup.name, sqlDatabase.name]).apply(([serverName, rgName, dbName]) => {
    return `Server=tcp:${serverName}.database.windows.net;initial catalog=${dbName};user ID=adminUser;password=adminPassword1234!;Min Pool Size=0;Max Pool Size=30;Persist Security Info=true;`;
});

Running the script will need the installation of Python, Pulumi and the Azure CLI.

Cloud Provider specific IaC Solutions

Cloud providers might come up with their own IaC solutions, here are the probably most common ones:

Microsoft Azure Bicep is an open-source domain-specific language (DSL) developed by Microsoft, aimed at simplifying the process of deploying Azure resources. It serves as a declarative alternative to JSON for writing Azure Resource Manager (ARM) templates. Bicep compiles down to ARM templates, offering a more concise syntax and easier tooling while leveraging the proven, underlying ARM deployment engine.

AWS CloudFormation is a service offered by Amazon Web Services (AWS) that allows you to define cloud infrastructure in JSON or YAML templates.

Google Cloud Deployment Manager is quite similar to AWS CloudFormation but tailored for Google Cloud Platform (GCP), it allows you to define and deploy resources using YAML or Python templates.

IaC Tools for Server Configuration

There are many other IaC solutions and some of them are more focused on configuration of servers. In common they offer software provisioning as well and a lot detailing in regards to micro-configuration of single applications running on the server.

The most common IaC software for Server Configuration might be Ansible, a YAML-based configuration management tool that uses an agentless architecture. It’s easy to set up and widely used for automating tasks like software provisioning and configuration management. Puppet, Chef and SaltStack are further alternatives and master-agent architecture-based.

Other types of IaC Solutions

IaC solutions with a more narrow focus are e.g. Vagrant as a primarily used IaC tool for setting up virtual development environments, especially for the automation of VM (Virtual Machine) provisioning. The widely used Docker Compose is a tool for defining and running multi-container Docker applications, which can be defined using YAML files.

Furthermore we have tools that are working closely together with IaC tooling, e.g. Prometheus as an open-source monitoring toolkit often used in conjunction with other IaC tools for monitoring deployed resources.

Conclusion

Infrastructure as Code significantly enhances the development and maintenance of Cloud-based Data Infrastructures. From versioning your warehouse architecture and scaling resources according to real-time data needs, to facilitating team collaboration and ensuring security compliance, IaC serves as a foundational technology that brings agility, reliability, and cost-efficiency. As organizations continue to realize the importance of data-driven decision-making, leveraging IaC for cloud-based Data Warehouse Systems will likely become a best practice in data engineering and infrastructure management.

Air Quality Forecasting Python Project

You will find the full python code and all visuals for this article here in this gitlab repository. The repository contains a series of analysis, transforms and forecasting models frequently used when dealing with time series. The aim of this repository is to showcase how to model time series from the scratch, for this we are using a real usecase dataset

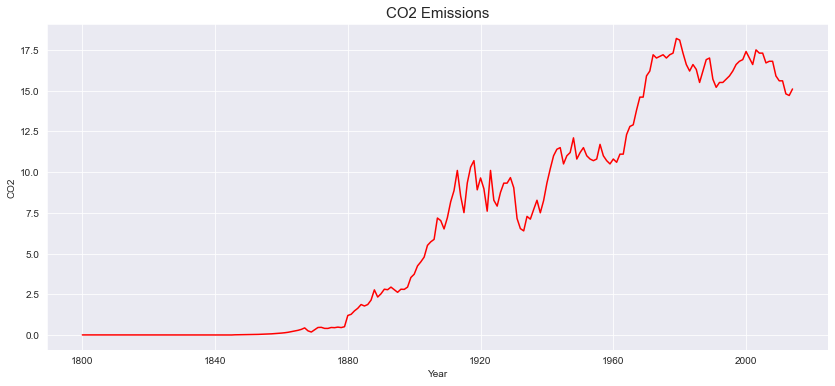
This project forecast the Carbon Dioxide (Co2) emission levels yearly. Most of the organizations have to follow government norms with respect to Co2 emissions and they have to pay charges accordingly, so this project will forecast the Co2 levels so that organizations can follow the norms and pay in advance based on the forecasted values. In any data science project the main component is data, for this project the data was provided by the company, from here time series concept comes into the picture. The dataset for this project contains 215 entries and two components which are Year and Co2 emissions which is univariate time series as there is only one dependent variable Co2 which depends on time. from year 1800 to year 2014 Co2 levels were present in the dataset.

The dataset used: The dataset contains yearly Co2 emmisions levels. data from 1800 to 2014 sampled every 1 year. The dataset is non stationary so we have to use differenced time series for forecasting.

After getting data the next step is to analyze the time series data. This process is done by using Python. The data was present in excel file so first we need to read that excel file. This task is done by using Pandas which is python libraries to creates Pandas Data Frame. After that preprocessing like changing data types of time from object to DateTime performed for the coding purpose. Time series contain 4 main components Level, Trend, Seasonality and Noise. To study this component, we need to decompose our time series so that we can batter understand our time series and we can choose the forecasting model accordingly because each component behave different on the model. also by decomposing we can identify that the time series is multiplicative or additive.

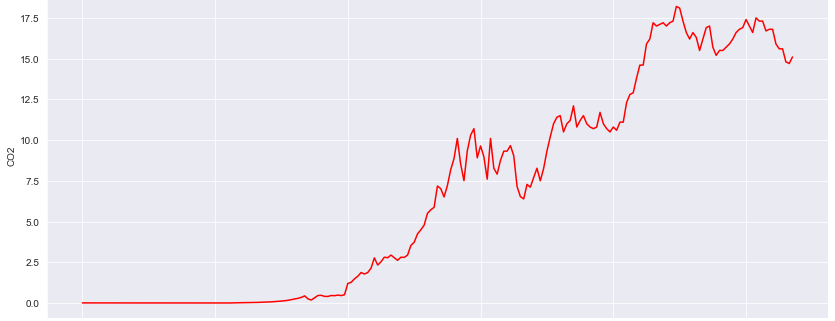
CO2 emissions – plotted via python pandas / matplotlib

Decomposing time series using python statesmodels libraries we get to know trend, seasonality and residual component separately. the components multiply together to make the time series multiplicative and in additive time series components added together. Taking the deep dive to understand the trend component, moving average of 10 steps were applied which shows nonlinear upward trend, fit the linear regression model to check the trend which shows upward trend. talking about seasonality there were combination of multiple patterns over time period which is common in real world time series data. capturing the white noise is difficult in this type of data. the time series contains values from 1800 where the Co2 values are less then 1 because of no human activities so levels were decreasing. By the time numbers of industries and human activities are rapidly increasing which causes Co2 levels rapidly increasing. In time series the highest Co2 emission level was 18.7 in 1979. It was challenging to decide whether to consider this values which are less then 0.5 as white noise or not because 30% of the Co2 values were less then 1, in real world looking at current scenario the chances of Co2 emission level being 0 is near to impossible still there are chances that Co2 levels can be 0.0005. So considering each data point as a valuable information we refused to remove that entries.

Next step is to create Lag plot so we can see the correlation between the current year Co2 level and previous year Co2 level. the plot was linear which shows high correlation so we can say that the current Co2 levels and previous levels have strong relationship. the randomness of the data were measured by plotting autocorrelation graph. the autocorrelation graph shows smooth curves which indicates the time series is nonstationary thus next step is to make time series stationary. in nonstationary time series, summary statistics like mean and variance change over time.

To make time series stationary we have to remove trend and seasonality from it. Before that we use dickey fuller test to make sure our time series is nonstationary. the test was done by using python, and the test gives pvalue as output. here the null hypothesis is that the data is nonstationary while alternate hypothesis is that the data is stationary, in this case the significance values is 0.05 and the pvalues which is given by dickey fuller test is greater than 0.05 hence we failed to reject null hypothesis so we can say the time series is nonstationery. Differencing is one of the techniques to make time series stationary. On this time series, first order differencing technique applied to make the time series stationary. In first order differencing we have to subtract previous value from current value for all the data points. also different transformations like log, sqrt and reciprocal were applied in the context of making the time series stationary. Smoothing techniques like simple moving average, exponential weighted moving average, simple exponential smoothing and double exponential smoothing techniques can be applied to remove the variation between time stamps and to see the smooth curves.

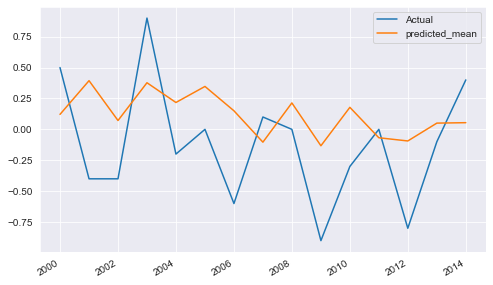
Smoothing techniques also used to observe trend in time series as well as to predict the future values. But performance of other models was good compared to smoothing techniques. First 200 entries taken to train the model and remaining last for testing the performance of the model. performance of different models measured by Root Mean Squared Error (RMSE) and Mean Absolute Error (MAE) as we are predicting future Co2 emissions so basically it is regression problem. RMSE is calculated by root of the average of squared difference between actual values and predicted values by the model on testing data. Here RMSE values were calculated using python sklearn library. For model building two approaches are there, one is datadriven and another one is model based. models from both the approaches were applied to find the best fitted model. ARIMA model gives the best results for this kind of dataset as the model were trained on differenced time series. The ARIMA model predicts a given time series based on its own past values. It can be used for any nonseasonal series of numbers that exhibits patterns and is not a series of random events. ARIMA takes 3 parameters which are AR, MA and the order of difference. Hyper parameter tuning technique gives best parameters for the model by trying different sets of parameters. Although The autocorrelation and partial autocorrelation plots can be use to decide AR and MA parameter because partial autocorrelation function shows the partial correlation of a stationary time series with its own lagged values so using PACF we can decide the value of AR and from ACF we can decide the value of MA parameter as ACF shows how data points in a time series are related.

Yearly difference of CO2 emissions – ARIMA Prediction

Apart from ARIMA, few other model were trained which are AR, ARMA, Simple Linear Regression, Quadratic method, Holts winter exponential smoothing, Ridge and Lasso Regression, LGBM and XGboost methods, Recurrent neural network (RNN) Long Short Term Memory (LSTM) and Fbprophet. I would like to mention my experience with LSTM here because it is another model which gives good result as ARIMA. the reason for not choosing LSTM as final model is its complexity. As ARIMA is giving appropriate results and it is simple to understand and requires less dependencies. while using lstm, lot of data preprocessing and other dependencies required, the dataset was small thus we used to train the model on CPU, otherwise gpu is required to train the LSTM model. we face one more challenge in deployment part. the challenge is to get the data into original form because the model was trained on differenced time series, so it will predict the future values in differenced format. After lot of research on the internet and by deeply understanding mathematical concepts finally we got the solution for it. solution for this issue is we have to add previous value from the original data from into first order differencing and then we have to add the last value of this time series into predicted values. To create the user interface streamlit was used, it is commonly used python library. the pickle file of the ARIMA model were used to predict the future values based on user input. The limit for forecasting is the year 2050. The project was uploaded on google cloud platform. so the flow is, first the starting year from which user want to forecast was taken and the end year till which year user want to forecast was taken and then according to the range of this inputs the prediction takes place. so by taking the inputs the pickle file will produce the future Co2 emissions in differenced format, then the values will be converted to original format and then the original values will be displayed on the user interface as well as the interactive line graph were displayed on the interface.

You will find the full python code and all visuals for this article here in this gitlab repository.

What is Portfolio Risk Management in Python?

Data science is a crucial industry, with multiple processes today relying on it. One of its more helpful and intriguing applications is in investing, where it helps investors make more informed decisions. Practices like portfolio management in Python help take the guesswork out of this notoriously risky undertaking.

Investing is a complicated science, making it hard to do well. Some estimates hold that as much as 90% of people lose money in stocks. While stock trading will always involve some risk, Python-based portfolio management can help.

What Is Portfolio Management in Python?

Portfolio management is the process of planning, making and overseeing investments to meet your long-term investment goals. Portfolio management in Python uses data science to analyze risks and rewards to make the best investment decisions.

Since the future is uncertain, buying stocks is inherently risky, but some assets are riskier than others. For example, since many companies are trying to reach carbon neutrality by 2050, investing in sustainable technologies is a fairly sound strategy. However, that doesn’t guarantee that every eco-friendly startup will succeed, so investors need to consider more factors.

Some data scientists have found that you can use Python to understand these factors better. By plugging various figures into a Python equation, investors can chart potential risks and returns to find the best investments.

How Does Python Portfolio Management Work?

Portfolio risk management in Python operates on a principle called Modern Portfolio Theory (MPT). MPT helps investors find an optimal mix of high-risk, high-return investments and low-risk, low-return ones based on their risk tolerance. Investors can either look for the highest returns at a certain risk level or look for the lowest risk to get a certain return.

To apply this in Python, data scientists create one list for portfolio returns, one for risk and one for weights, or how much each investment accounts for the overall portfolio. They then randomly generate weight for the assets, then normalize it to sum to a value of one.

Data scientists then calculate the risks and returns for each asset and plug them into the different randomly generated weights. This will produce a list of various scenarios, showing how much overall risk and reward each portfolio would have.

Investors can then look at this list to see how much of each asset they should include in their portfolio. They can either use the mix that produces the greatest return or the one with the lowest risk.

Why Does It Matter?

Using Python for portfolio risk management helps remove a lot of the guesswork from investing. Running these calculations gives investors multiple scenarios to choose from, helping them find the best portfolio strategy for their needs and goals.

This presents a promising opportunity for data scientists. Data analytics are quickly becoming an essential part of the stock market. Algorithmic trading, which applies data and AI to MPT, already accounts for 60 to 73% of all U.S. equity trading. Portfolio management in Python could help more data scientists capitalize on this trend.

This practice is a relatively straightforward way to apply data science to stock trading. Data scientists that can make the most of that opportunity stand to make a name for themselves in investing circles.

Python Portfolio Management Can Maximize Returns

In the past, stock trading was almost akin to gambling, involving huge amounts of risk. While portfolio management in Python doesn’t remove volatility from the stock market, it helps put it in perspective. Investors can then make safer, more informed decisions to meet their investing goals.

Python-based portfolio management stands as a natural intersection between data science and stock trading. As a result, it can help both data scientists and investors achieve new success.

Coffee Shop Location Predictor

As part of this article, we will explore the main steps involved in predicting the best location for a coffee shop in Vancouver. We will also take into consideration that the coffee shop is near a transit station, and has no Starbucks near it. Well, while at it, let us also add an extra feature where we make sure the crime in the area is lower.

Introduction

In this article, we will highlight the main steps involved to predict a location for a coffee shop in Vancouver. We also want to make sure that the coffee shop is near a transit station, and has no Starbucks near it. As an added feature, we will make sure that the crime concentration in the area is low, and the entire program should be implemented in Python. So let’s walk through the steps.

Steps Required

  • Get crime history for the last two years
  • Get locations of all transit stations and Starbucks in Vancouver
  • Check all the transit stations that do not have any Starbucks near them
  • Get all the data regarding crimes near the filtered transit stations
  • Create a grid of all possible coordinates around the transit station
  • Check crime around each created coordinate and display the top 5 locations.

Gathering Data

This covers the first two steps required to get data from the internet, both manually and automatically.

Getting all Crime History

We can get crime history for the past 14 years in Vancouver from here. This data is in raw crime.csv format, so we have to process it and filter out useless data. We then write this processed information on the crime_processed.csv file.

Note: There are 530,653 records of crime in this file

In this program, we will just use the type and coordinate of the crime. There are many crime types, but we have classified them into three major categories namely;

Theft (red), Break and Enter (orange) and Mischief (green)

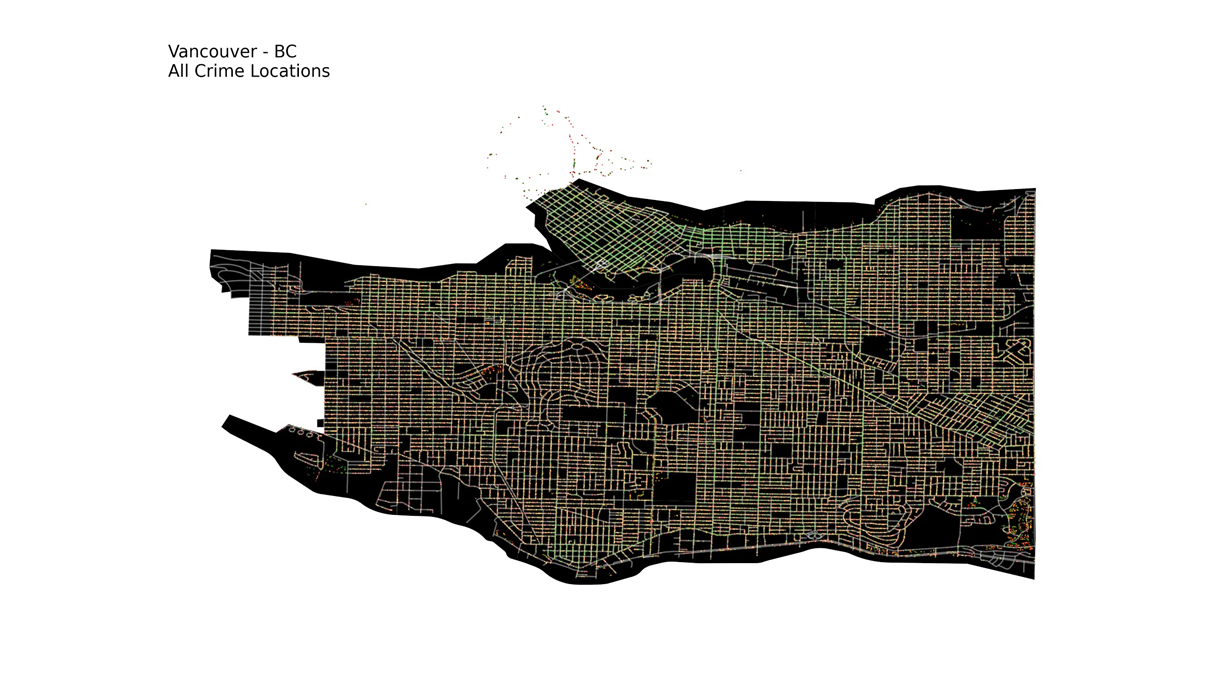
These all crimes can be plotted on Graph as displayed below.

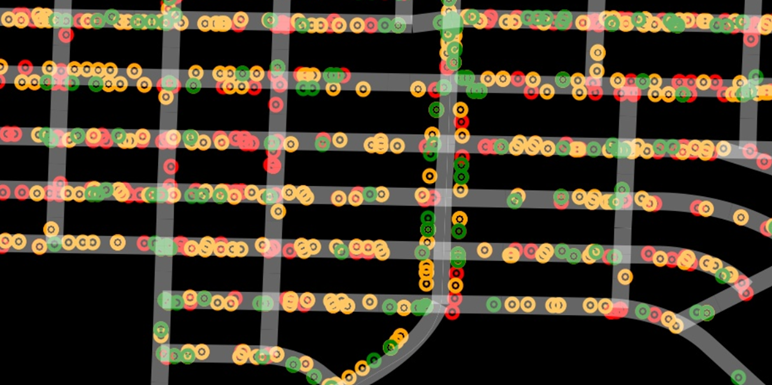
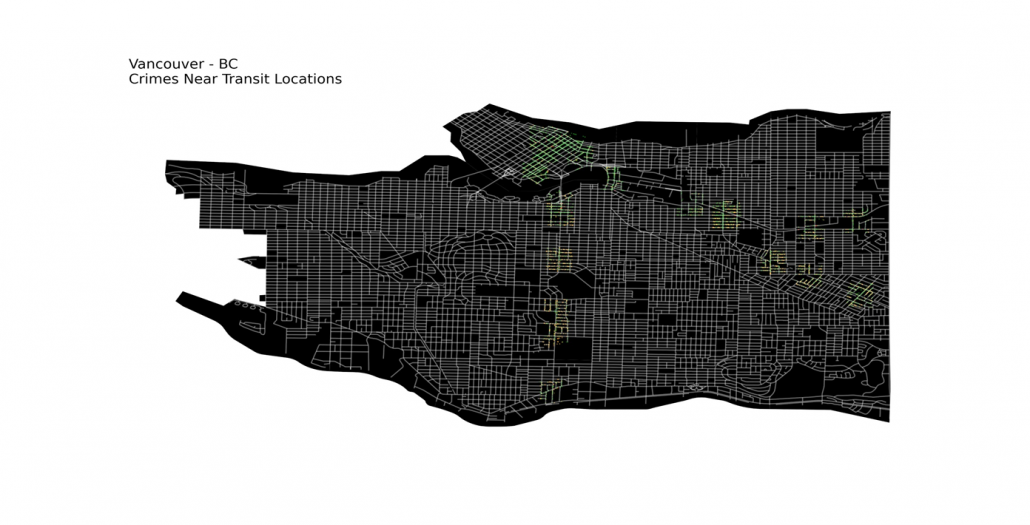
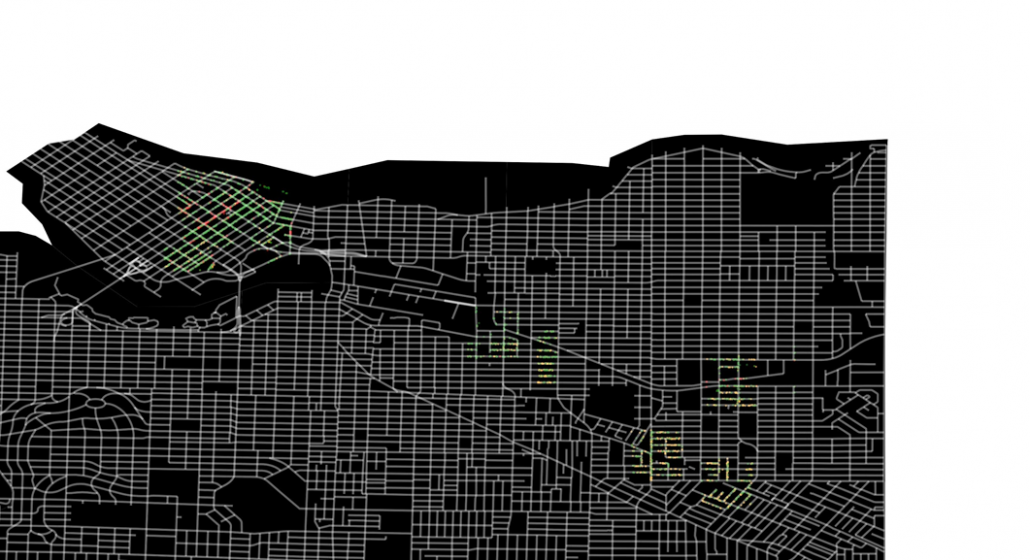
This may seem very congested and full, so let’s see a closeup image for future references.

Getting Locations of all Rapid Transit Stations

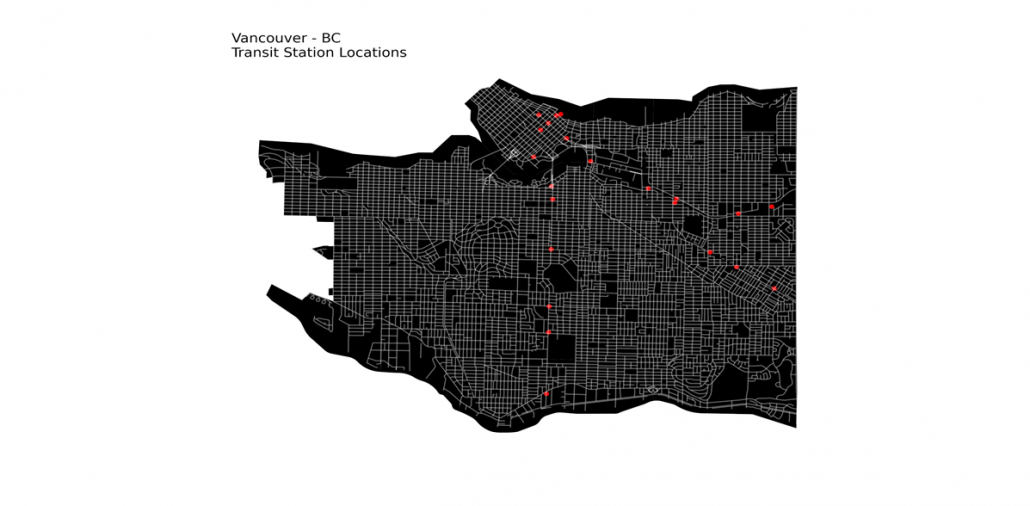
We can get the coordinates of all Transit Stations in Vancouver from here. This dataset has all coordinates of rapid transit stations in three transit lines in Vancouver. There are a total of 23 of them in Vancouver, we can then use it for further processing.

Getting Locations of all Starbucks

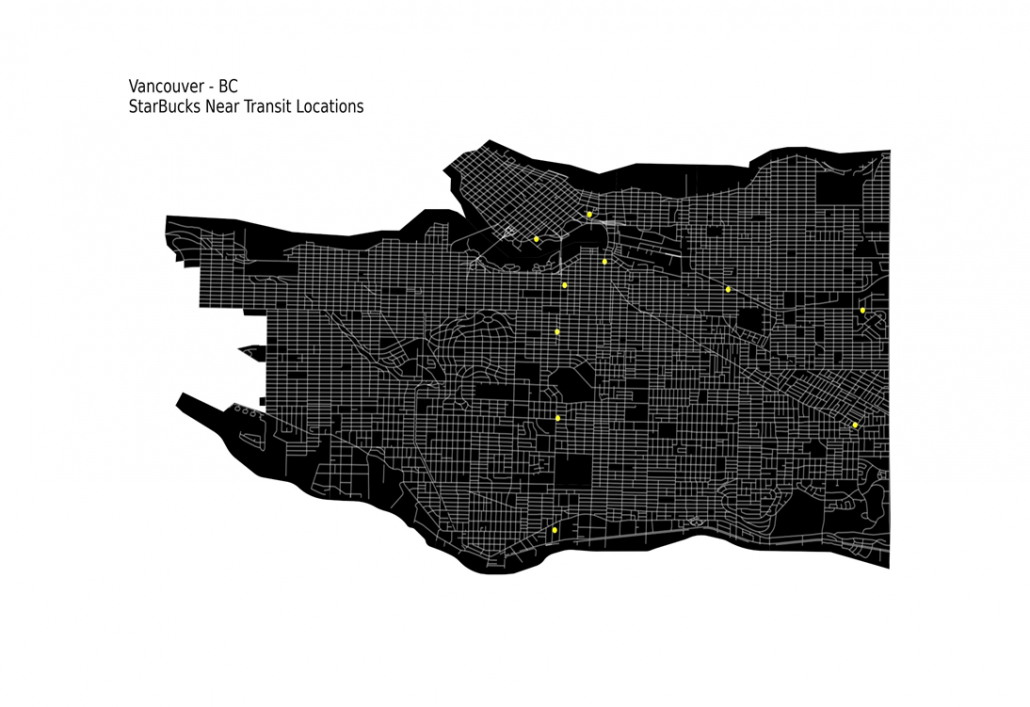
The Starbucks data is present here, we can scrape it easily and get the locations of all the Starbucks in Vancouver. We just need the Starbucks that is near transit stations, so we’ll filter out the rest. There are a total 24 Starbucks in Vancouver, and 10 of them are near Transit Stations.

Note: Other than the coordinates of Transit Stations and Starbucks, we also need coordinates and type of the crime.

Transit Stations with no Starbucks

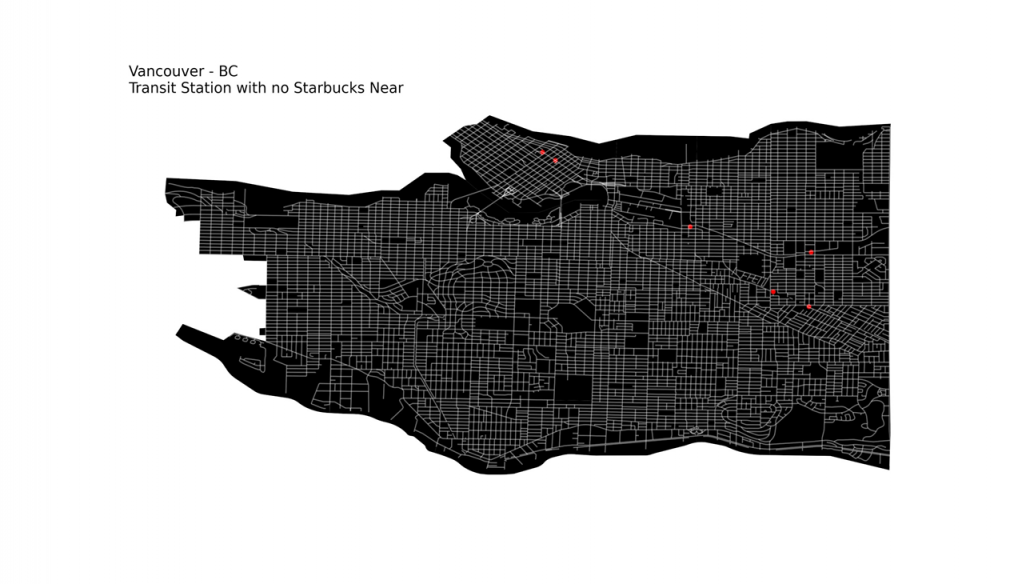
As we have all the data required, now moving to the next step. We need to get to the transit Station locations that have no Starbucks near them. For that we can create an area of particular radius around each Transit Station. Then check all Starbucks locations with respect to them, whether they are within that area or not.

If none of the Starbucks are within that particular Transit Station’s area, we can append it to a list. At the end, we have a list of all Transit locations with no Starbucks near them. There are a total of 6 Transit Stations with no Starbucks near them.

Crime near Transit Stations

Now lets filter out all crime records and get just what we are interested in, which means the crime near Transit stations. For that we will plot an area of specific radius around each of them to see the crimes. These are more than 110,000 crime records.

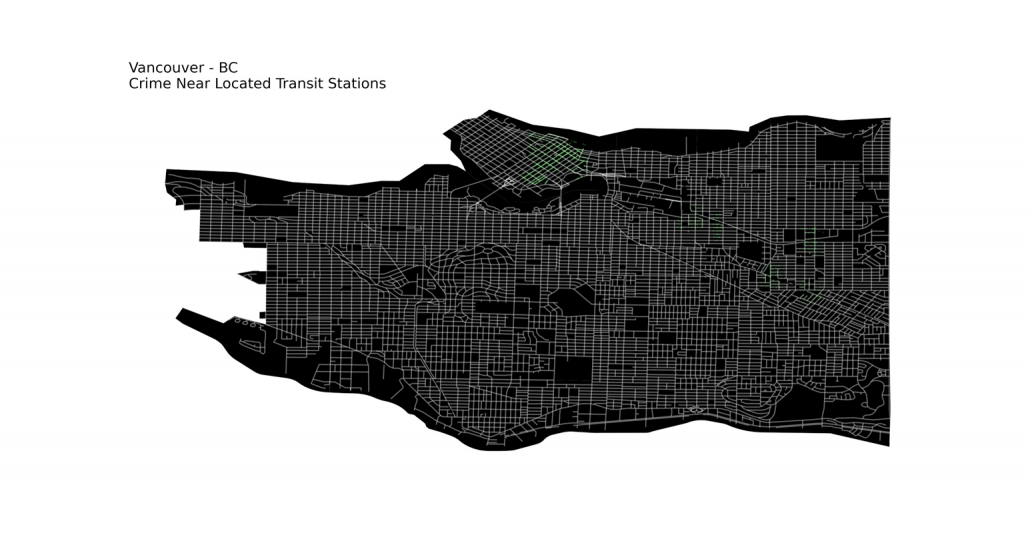
Crime near located Transit Stations

Now that we have all the Transit Stations that don’t have any Starbucks near them and also the crime near all Transit Stations. So, let’s use this information and get crime near the located Transit Stations. These are about 44,000 crime records.

This may seem correct at first glance, but the points are overlapping due to abundance, so we can create different lists of crimes based on their types.

Theft

Break and Enter

Mischief

Generating all possible coordinates

Now finally, we have all the prerequisites and let’s get to the main task at hand, predicting the best coordinate for the coffee shop.

There may be many approaches to solve this problem, but the one I used in this program is that I will create a grid of all possible locations (coordinates) in the area of 1 km radius around each located transit station.

Initially I generated 1 coordinate for every m, this resulted in 1000,000 coordinates in every km. This is a huge number, and for the 6 located Transit stations, it becomes 6 Million. It may not seem much at first glance because computers can handle such data in a few seconds.

But for location prediction we need to compare each coordinate with crime coordinates. As the algorithm has to check for ~7,000 Thefts, ~19,000 Break ins, and ~17,000 Mischiefs around each generated coordinate. Computing this would want the program to process an estimate of 432.4 Billion times. This sort of execution takes many hours on normal computers (sometimes days).

The solution to this is to create a coordinate for each 10 m area, this results about 10,000 coordinate per km. For the above mentioned number of crimes, the estimated processes will be several Billions. That would significantly reduce the time, but is still not less.

To control this, we can remove the duplicate values in crime coordinates and those which are too close to each other ~1m. Doing so, we are left with just 816 Thefts, 2,654 Break ins, and 8,234 Mischiefs around each generated coordinate.
The precision will not be affected much but the time and computational resources required will be reduced a lot.


Checking Crime near Generated coordinates

Now that we have all the locations, we will start some processing on it and check each coordinate against some constraints. That are respectively;

  1. Filter out Coordinates having Theft near 1 km
    We get 122,000 coordinates with no Thefts (Below merged 1000 to 1)
  2. Filter out Coordinates having Break Ins near 200m
    We get 8000 coordinates with no Thefts (Below merged 1000 to 1)
  3. Filter out Coordinates having Mischief near 200m
    We get 6000 coordinates with no Thefts (Below merged 1000 to 1)
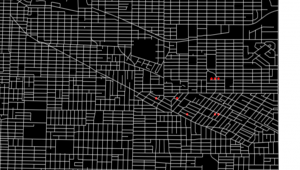
    Now that we have 6 Coordinates of best locations that have passed through all the constraints, we will order them.To order them, we will check their distance from the nearest transit location. The nearest will be on top of the list as the best possible location, then the second and so on. The generated List is;

    1. -123.0419406741792, 49.24824259252004
    2. -123.05887151659479, 49.24327221040713
    3. -123.05287151659476, 49.24327221040713
    4. -123.04994067417924, 49.239242592520064
    5. -123.0419406741792, 49.239242592520064
    6. -123.0409406741792, 49.239242592520064

How can MindTrades help?

MindTrades Consulting Services, a leading marketing agency provides in-depth analysis and insights for the global IT sector including leading data integration brands such as Diyotta. From Cloud Migration, Big Data, Digital Transformation, Agile Deliver, Cyber Security, to Analytics- Mind trades provides published breakthrough ideas, and prompt content delivery. For more information, refer to mindtrades.com.

Code

https://github.com/Mindtrades-Consulting/Coffee-Shop-Location-Predictor


How to make a toy English-German translator with multi-head attention heat maps: the overall architecture of Transformer

If you have been patient enough to read the former articles of this article series Instructions on Transformer for people outside NLP field, but with examples of NLP, you should have already learned a great deal of Transformer model, and I hope you gained a solid foundation of learning theoretical sides on this algorithm.

This article is going to focus more on practical implementation of a transformer model. We use codes in the Tensorflow official tutorial. They are maintained well by Google, and I think it is the best practice to use widely known codes.

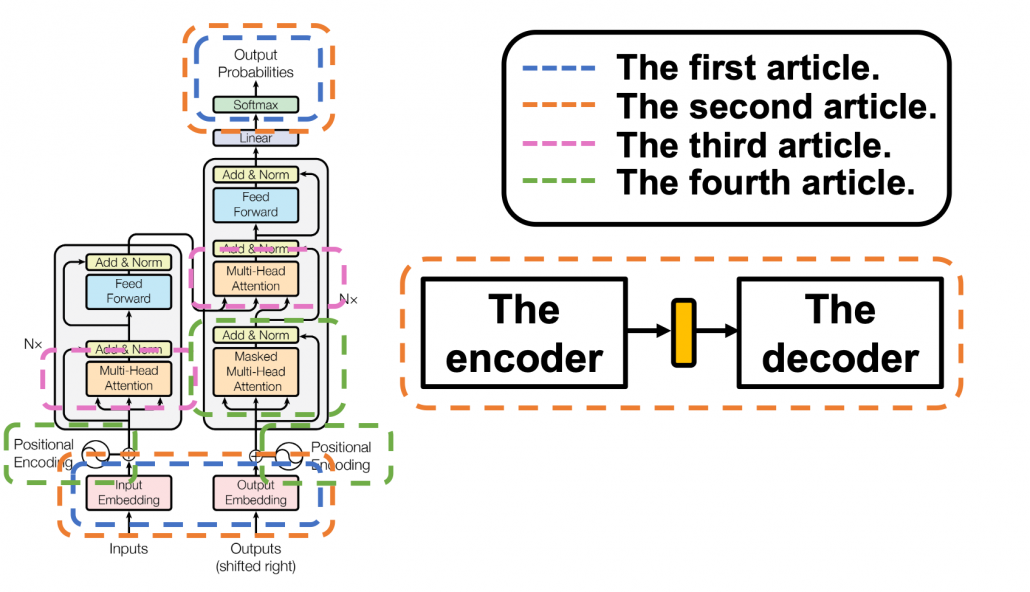
The figure below shows what I have explained in the articles so far. Depending on your level of understanding, you can go back to my former articles. If you are familiar with NLP with deep learning, you can start with the third article.

1 The datasets

I think this article series appears to be on NLP, and I do believe that learning Transformer through NLP examples is very effective. But I cannot delve into effective techniques of processing corpus in each language. Thus we are going to use a library named BPEmb. This library enables you to encode any sentences in various languages into lists of integers. And conversely you can decode lists of integers to the language. Thanks to this library, we do not have to do simplification of alphabets, such as getting rid of Umlaut.

*Actually, I am studying in computer vision field, so my codes would look elementary to those in NLP fields.

The official Tensorflow tutorial makes a Portuguese-English translator, but in article we are going to make an English-German translator. Basically, only the codes below are my original. As I said, this is not an article on NLP, so all you have to know is that at every iteration you get a batch of (64, 41) sized tensor as the source sentences, and a batch of (64, 42) tensor as corresponding target sentences. 41, 42 are respectively the maximum lengths of the input or target sentences, and when input sentences are shorter than them, the rest positions are zero padded, as you can see in the codes below.

*If you just replace datasets and modules for encoding, you can make translators of other pairs of languages.

We are going to train a seq2seq-like Transformer model of converting those list of integers, thus a mapping from a vector to another vector. But each word, or integer is encoded as an embedding vector, so virtually the Transformer model is going to learn a mapping from sequence data to another sequence data. Let’s formulate this into a bit more mathematics-like way: when we get a pair of sequence data \boldsymbol{X} = (\boldsymbol{x}^{(1)}, \dots, \boldsymbol{x}^{(\tau _x)}) and \boldsymbol{Y} = (\boldsymbol{y}^{(1)}, \dots, \boldsymbol{y}^{(\tau _y)}), where \boldsymbol{x}^{(t)} \in \mathbb{R}^{|\mathcal{V}_{\mathcal{X}}|}, \boldsymbol{x}^{(t)} \in \mathbb{R}^{|\mathcal{V}_{\mathcal{Y}}|}, respectively from English and German corpus, then we learn a mapping f: \boldsymbol{X} \to \boldsymbol{Y}.

*In this implementation the vocabulary sizes are both 10002. Thus |\mathcal{V}_{\mathcal{X}}|=|\mathcal{V}_{\mathcal{Y}}|=10002

2 The whole architecture

This article series has covered most of components of Transformer model, but you might not understand how seq2seq-like models can be constructed with them. It is very effective to understand how transformer is constructed by actually reading or writing codes, and in this article we are finally going to construct the whole architecture of a Transforme translator, following the Tensorflow official tutorial. At the end of this article, you would be able to make a toy English-German translator.

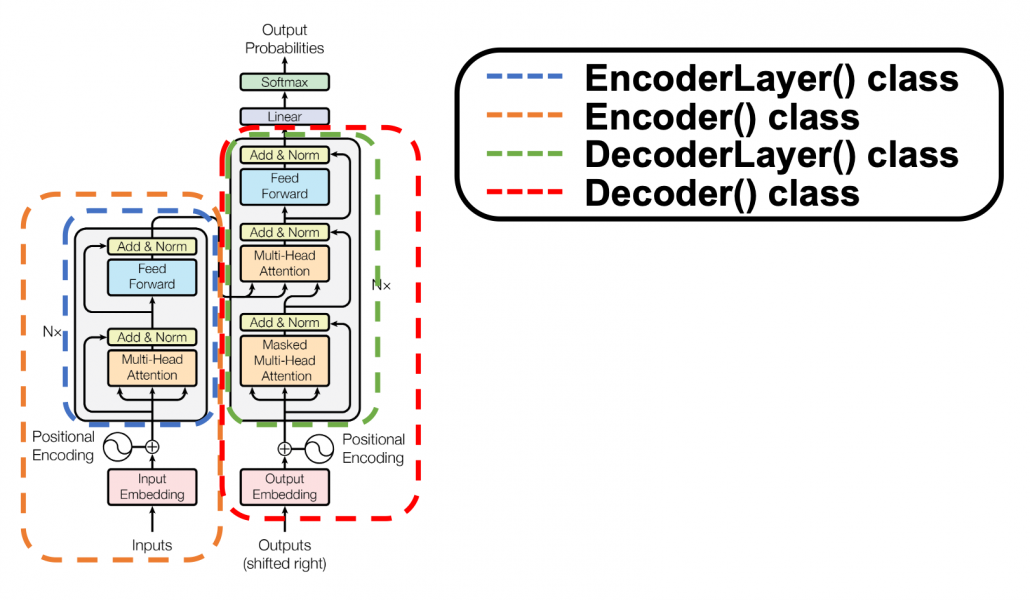
The implementation is mainly composed of 4 classes, EncoderLayer(), Encoder(), DecoderLayer(), and Decoder() class. The inclusion relations of the classes are displayed in the figure below.

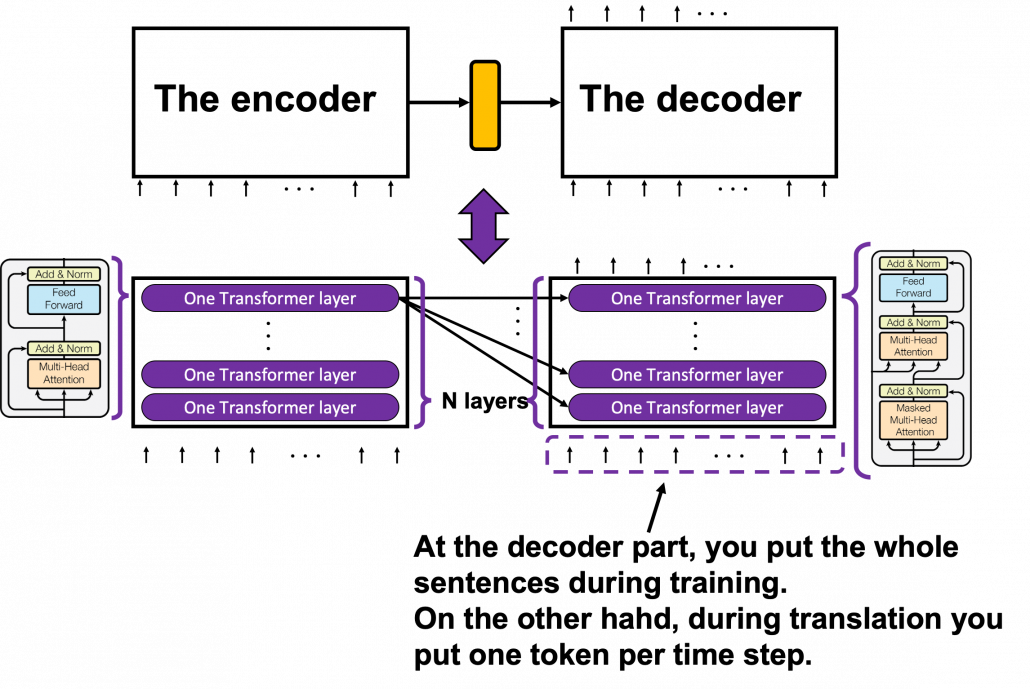
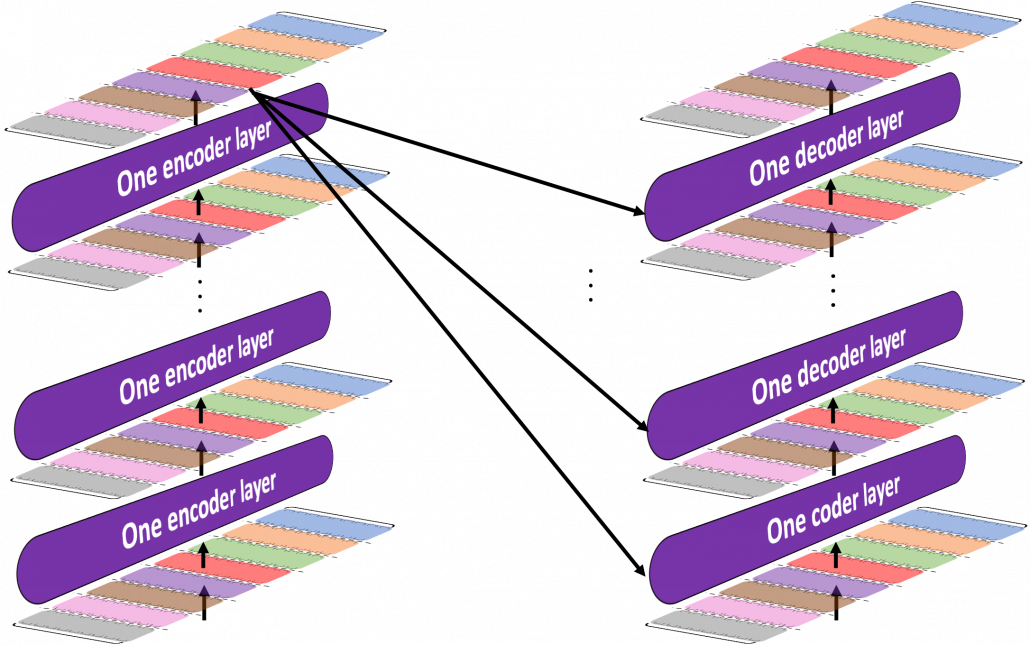
To be more exact in a seq2seq-like model with Transformer, the encoder and the decoder are connected like in the figure below. The encoder part keeps converting input sentences in the original language through N layers. The decoder part also keeps converting the inputs in the target languages, also through N layers, but it receives the output of the final layer of the Encoder at every layer.

You can see how the Encoder() class and the Decoder() class are combined in Transformer in the codes below. If you have used Tensorflow or Pytorch to some extent, the codes below should not be that hard to read.

3 The encoder

*From now on “sentences” do not mean only the input tokens in natural language, but also the reweighted and concatenated “values,” which I repeatedly explained in explained in the former articles. By the end of this section, you will see that Transformer repeatedly converts sentences layer by layer, remaining the shape of the original sentence.

I have explained multi-head attention mechanism in the third article, precisely, and I explained positional encoding and masked multi-head attention in the last article. Thus if you have read them and have ever written some codes in Tensorflow or Pytorch, I think the codes of Transformer in the official Tensorflow tutorial is not so hard to read. What is more, you do not use CNNs or RNNs in this implementation. Basically all you need is linear transformations. First of all let’s see how the EncoderLayer() and the Encoder() classes are implemented in the codes below.

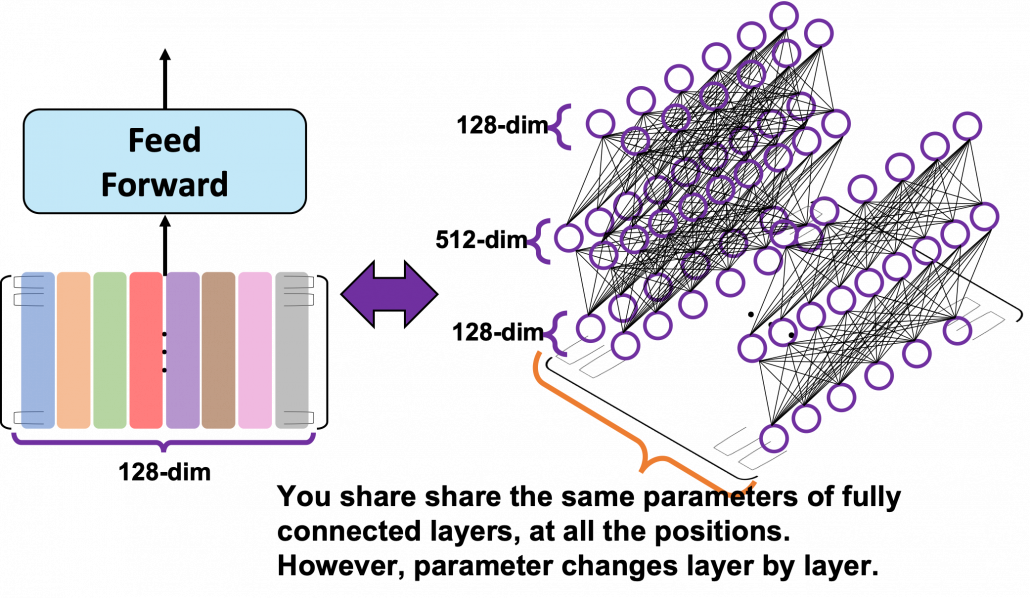
You might be confused what “Feed Forward” means in  this article or the original paper on Transformer. The original paper says this layer is calculated as FFN(x) = max(0, xW_1 + b_1)W_2 +b_2. In short you stack two fully connected layers and activate it with a ReLU function. Let’s see how point_wise_feed_forward_network() function works in the implementation with some simple codes. As you can see from the number of parameters in each layer of the position wise feed forward neural network, the network does not depend on the length of the sentences.

From the number of parameters of the position-wise feed forward neural networks, you can see that you share the same parameters over all the positions of the sentences. That means in the figure above, you use the same densely connected layers at all the positions, in single layer. But you also have to keep it in mind that parameters for position-wise feed-forward networks change from layer to layer. That is also true of “Layer” parts in Transformer model, including the output part of the decoder: there are no learnable parameters which cover over different positions of tokens. These facts lead to one very important feature of Transformer: the number of parameters does not depend on the length of input or target sentences. You can offset the influences of the length of sentences with multi-head attention mechanisms. Also in the decoder part, you can keep the shape of sentences, or reweighted values, layer by layer, which is expected to enhance calculation efficiency of Transformer models.

4, The decoder

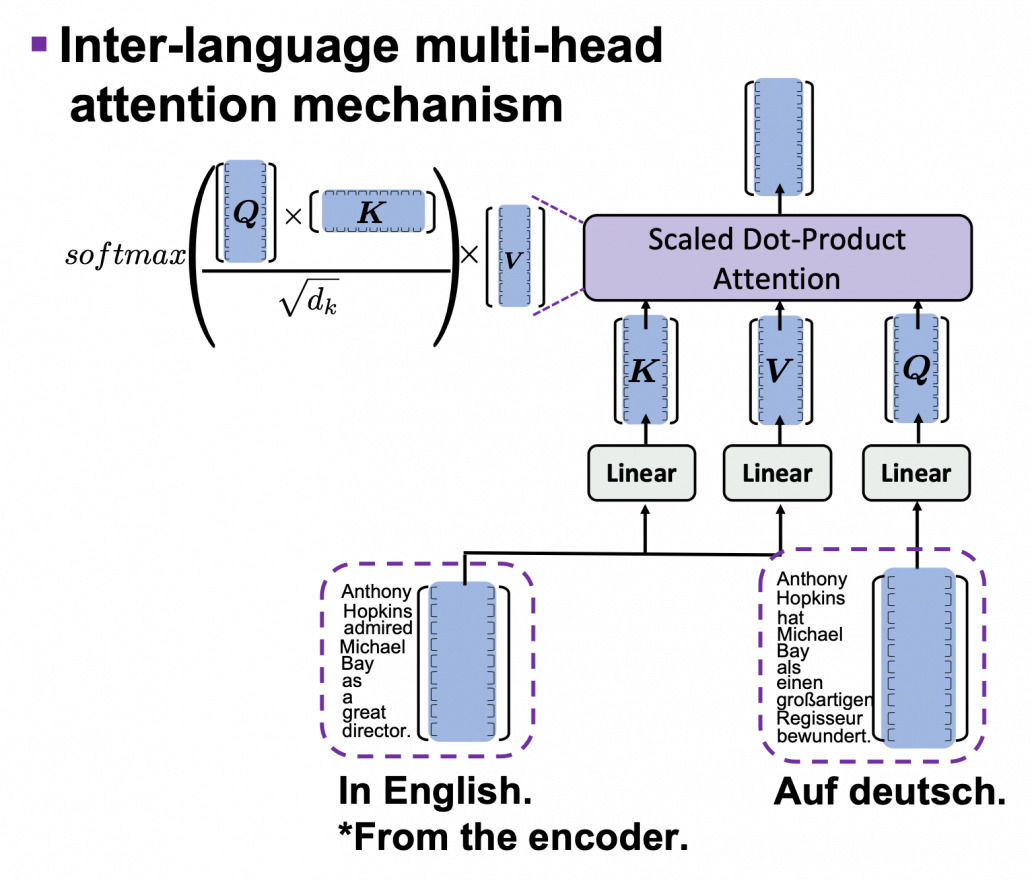
The structures of DecoderLayer() and the Decoder() classes are quite similar to those of EncoderLayer() and the Encoder() classes, so if you understand the last section, you would not find it hard to understand the codes below. What you have to care additionally in this section is inter-language multi-head attention mechanism. In the third article I was repeatedly explaining multi-head self attention mechanism, taking the input sentence “Anthony Hopkins admired Michael Bay as a great director.” as an example. However, as I explained in the second article, usually in attention mechanism, you compare sentences with the same meaning in two languages. Thus the decoder part of Transformer model has not only self-attention multi-head attention mechanism of the target sentence, but also an inter-language multi-head attention mechanism. That means, In case of translating from English to German, you compare the sentence “Anthony Hopkins hat Michael Bay als einen großartigen Regisseur bewundert.” with the sentence itself in masked multi-head attention mechanism (, just as I repeatedly explained in the third article). On the other hand, you compare “Anthony Hopkins hat Michael Bay als einen großartigen Regisseur bewundert.” with “Anthony Hopkins admired Michael Bay as a great director.” in the inter-language multi-head attention mechanism (, just as you can see in the figure above).

*The “inter-language multi-head attention mechanism” is my original way to call it.

I briefly mentioned how you calculate the inter-language multi-head attention mechanism in the end of the third article, with some simple codes, but let’s see that again, with more straightforward figures. If you understand my explanation on multi-head attention mechanism in the third article, the inter-language multi-head attention mechanism is nothing difficult to understand. In the multi-head attention mechanism in encoder layers, “queries”, “keys”, and “values” come from the same sentence in English, but in case of inter-language one, only “keys” and “values” come from the original sentence, and “queries” come from the target sentence. You compare “queries” in German with the “keys” in the original sentence in English, and you re-weight the sentence in English. You use the re-weighted English sentence in the decoder part, and you do not need look-ahead mask in this inter-language multi-head attention mechanism.

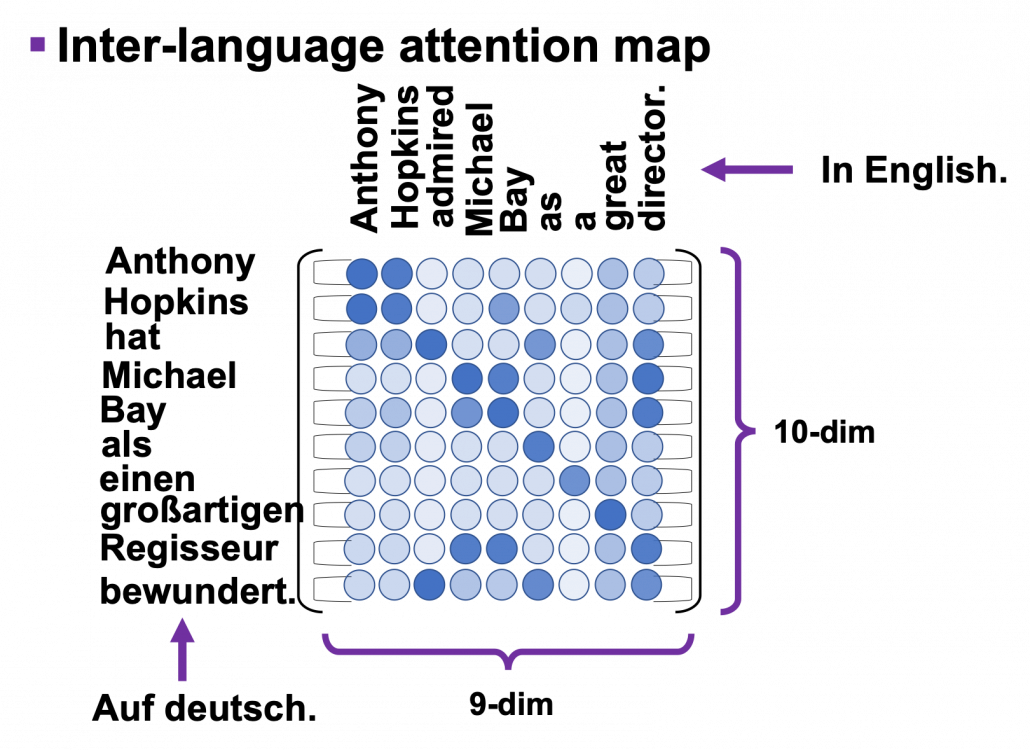
Just as well as multi-head self-attention, you can calculate inter-language multi-head attention mechanism as follows: softmax(\frac{\boldsymbol{Q} \boldsymbol{K} ^T}{\sqrt{d}_k}). In the example above, the resulting multi-head attention map is a 10 \times 9 matrix like in the figure below.

Once you keep the points above in you mind, the implementation of the decoder part should not be that hard.

5 Masking tokens in practice

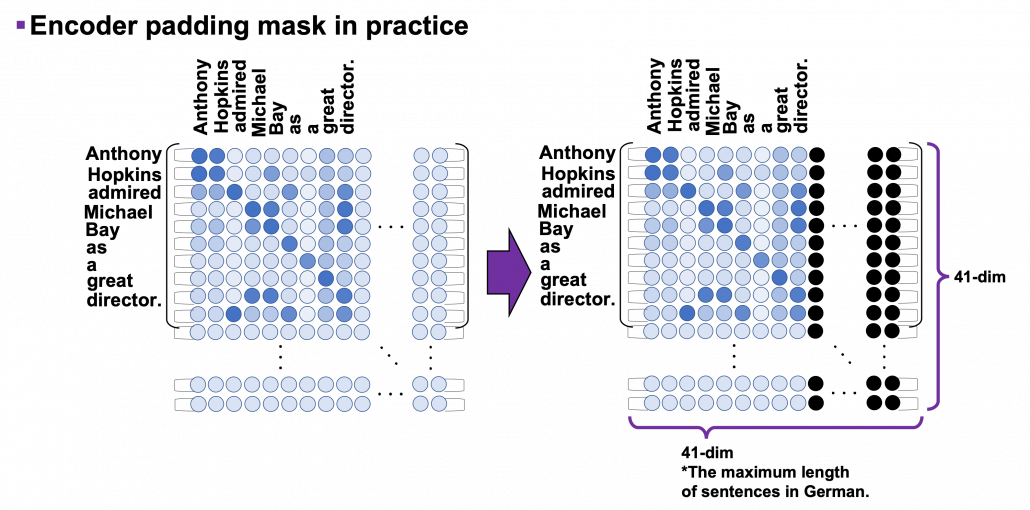
I explained masked-multi-head attention mechanism in the last article, and the ideas itself is not so difficult. However in practice this is implemented in a little tricky way. You might have realized that the size of input matrices is fixed so that it fits the longest sentence. That means, when the maximum length of the input sentences is 41, even if the sentences in a batch have less than 41 tokens, you sample (64, 41) sized tensor as a batch every time (The 64 is a batch size). Let “Anthony Hopkins admired Michael Bay as a great director.”, which has 9 tokens in total, be an input. We have been considering calculating (9, 9) sized attention maps or (10, 9) sized attention maps, but in practice you use (41, 41) or (42, 41) sized ones. When it comes to calculating self attentions in the encoder part, you zero pad self attention maps with encoder padding masks, like in the figure below. The black dots denote the zero valued elements.

As you can see in the codes below, encode padding masks are quite simple. You just multiply the padding masks with -1e9 and add them to attention maps and apply a softmax function. Thereby you can zero-pad the columns in the positions/columns where you added -1e9 to.

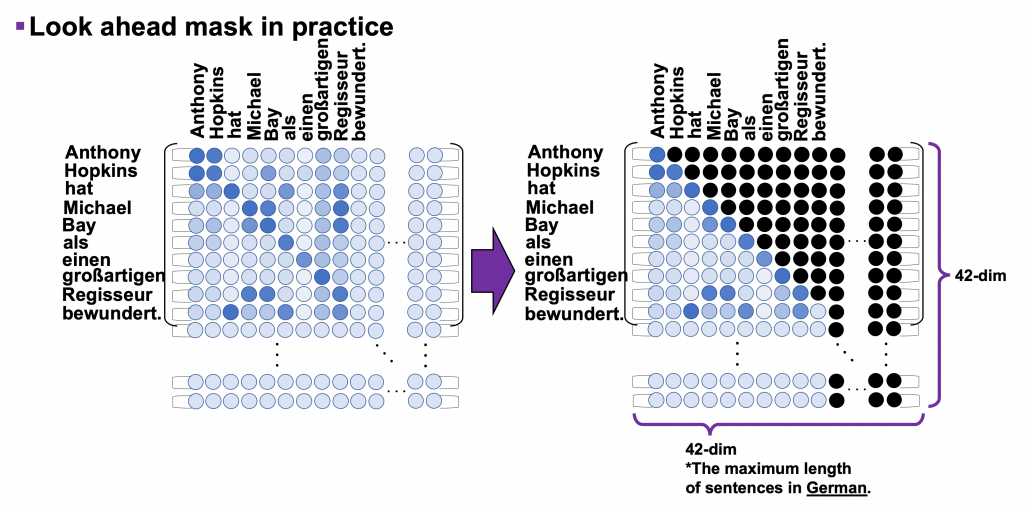
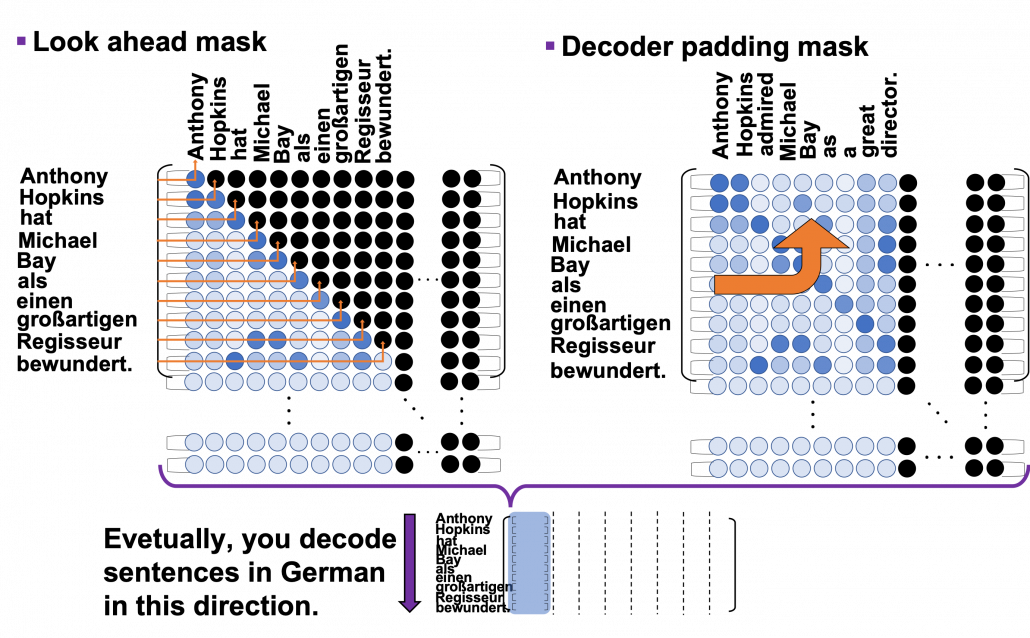
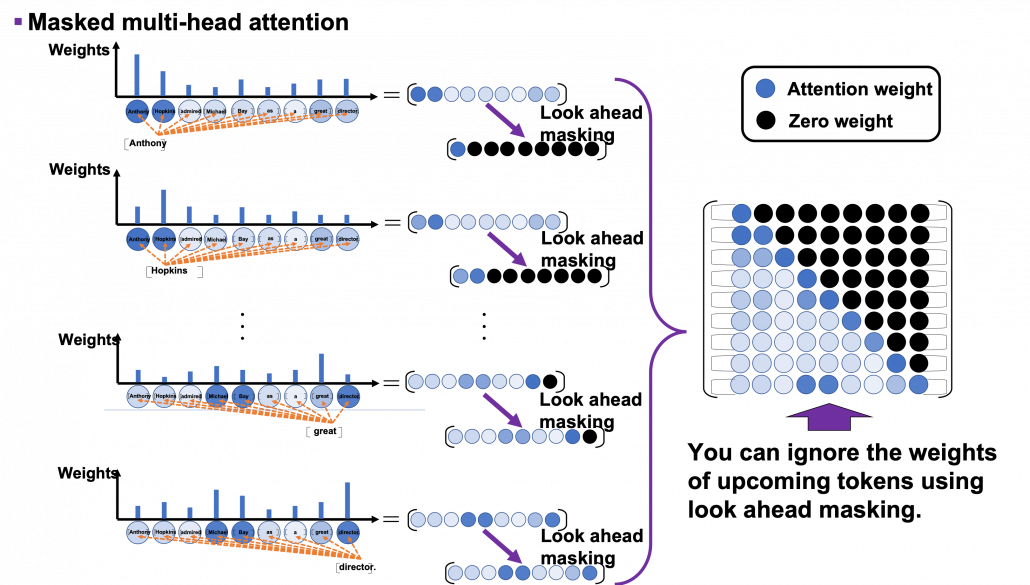
I explained look ahead mask in the last article, and in practice you combine normal padding masks and look ahead masks like in the figure below. You can see that you can compare each token with only its previous tokens. For example you can compare “als” only with “Anthony”, “Hopkins”, “hat”, “Michael”, “Bay”, “als”, not with “einen”, “großartigen”, “Regisseur” or “bewundert.”

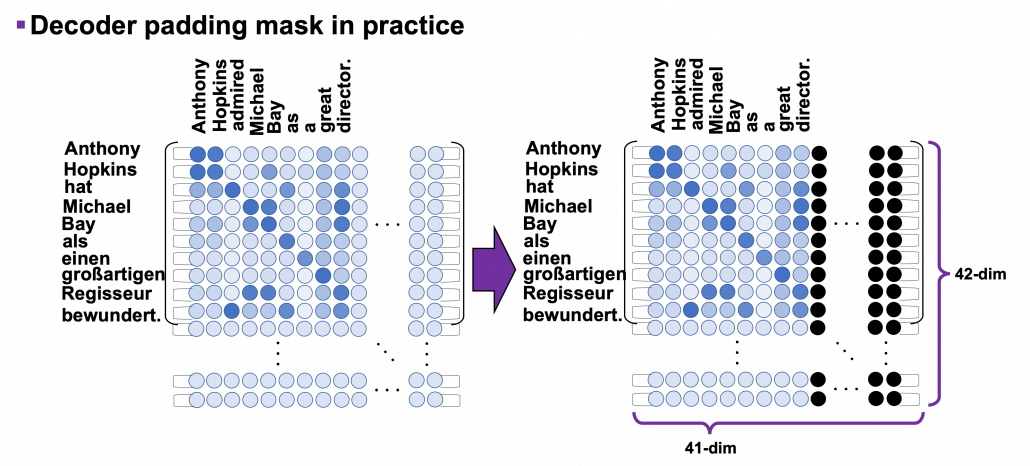
Decoder padding masks are almost the same as encoder one. You have to keep it in mind that you zero pad positions which surpassed the length of the source input sentence.

6 Decoding process

In the last section we have seen that we can zero-pad columns, but still the rows are redundant. However I guess that is not a big problem because you decode the final output in the direction of the rows of attention maps. Once you decode <end> token, you stop decoding. The redundant rows would not affect the decoding anymore.

This decoding process is similar to that of seq2seq models with RNNs, and that is why you need to hide future tokens in the self-multi-head attention mechanism in the decoder. You share the same densely connected layers followed by a softmax function, at all the time steps of decoding. Transformer has to learn how to decode only based on the words which have appeared so far.

According to the original paper, “We also modify the self-attention sub-layer in the decoder stack to prevent positions from attending to subsequent positions. This masking, combined with fact that the output embeddings are offset by one position, ensures that the predictions for position i can depend only on the known outputs at positions less than i.” After these explanations, I think you understand the part more clearly.

The codes blow is for the decoding part. You can see that you first start decoding an output sentence with a sentence composed of only <start>, and you decide which word to decoded, step by step.

*It easy to imagine that this decoding procedure is not the best. In reality you have to consider some possibilities of decoding, and you can do that with beam search decoding.

After training this English-German translator for 30 epochs you can translate relatively simple English sentences into German. I displayed some results below, with heat maps of multi-head attention. Each colored attention maps corresponds to each head of multi-head attention. The examples below are all from the fourth (last) layer, but you can visualize maps in any layers. When it comes to look ahead attention, naturally only the lower triangular part of the maps is activated.

This article series has not covered some important topics machine translation, for example how to calculate translation errors. Actually there are many other fascinating topics related to machine translation. For example beam search decoding, which consider some decoding possibilities, or other topics like how to handle proper nouns such as “Anthony” or “Hopkins.” But this article series is not on NLP. I hope you could effectively learn the architecture of Transformer model with examples of languages so far. And also I have not explained some details of training the network, but I will not cover that because I think that depends on tasks. The next article is going to be the last one of this series, and I hope you can see how Transformer is applied in computer vision fields, in a more “linguistic” manner.

But anyway we have finally made it. In this article series we have seen that one of the earliest computers was invented to break Enigma. And today we can quickly make a more or less accurate translator on our desk. With Transformer models, you can even translate deadly funny jokes into German.

*You can train a translator with this code.

*After training a translator, you can translate English sentences into German with this code.

[References]

[1] Ashish Vaswani, Noam Shazeer, Niki Parmar, Jakob Uszkoreit, Llion Jones, Aidan N. Gomez, Lukasz Kaiser, Illia Polosukhin, “Attention Is All You Need” (2017)

[2] “Transformer model for language understanding,” Tensorflow Core
https://www.tensorflow.org/overview

[3] Jay Alammar, “The Illustrated Transformer,”
http://jalammar.github.io/illustrated-transformer/

[4] “Stanford CS224N: NLP with Deep Learning | Winter 2019 | Lecture 14 – Transformers and Self-Attention,” stanfordonline, (2019)
https://www.youtube.com/watch?v=5vcj8kSwBCY

[5]Tsuboi Yuuta, Unno Yuuya, Suzuki Jun, “Machine Learning Professional Series: Natural Language Processing with Deep Learning,” (2017), pp. 91-94
坪井祐太、海野裕也、鈴木潤 著, 「機械学習プロフェッショナルシリーズ 深層学習による自然言語処理」, (2017), pp. 191-193

* I make study materials on machine learning, sponsored by DATANOMIQ. I do my best to make my content as straightforward but as precise as possible. I include all of my reference sources. If you notice any mistakes in my materials, including grammatical errors, please let me know (email: yasuto.tamura@datanomiq.de). And if you have any advice for making my materials more understandable to learners, I would appreciate hearing it.

Multi-head attention mechanism: “queries”, “keys”, and “values,” over and over again

This is the third article of my article series named “Instructions on Transformer for people outside NLP field, but with examples of NLP.”

In the last article, I explained how attention mechanism works in simple seq2seq models with RNNs, and it basically calculates correspondences of the hidden state at every time step, with all the outputs of the encoder. However I would say the attention mechanisms of RNN seq2seq models use only one standard for comparing them. Using only one standard is not enough for understanding languages, especially when you learn a foreign language. You would sometimes find it difficult to explain how to translate a word in your language to another language. Even if a pair of languages are very similar to each other, translating them cannot be simple switching of vocabulary. Usually a single token in one language is related to several tokens in the other language, and vice versa. How they correspond to each other depends on several criteria, for example “what”, “who”, “when”, “where”, “why”, and “how”. It is easy to imagine that you should compare tokens with several criteria.

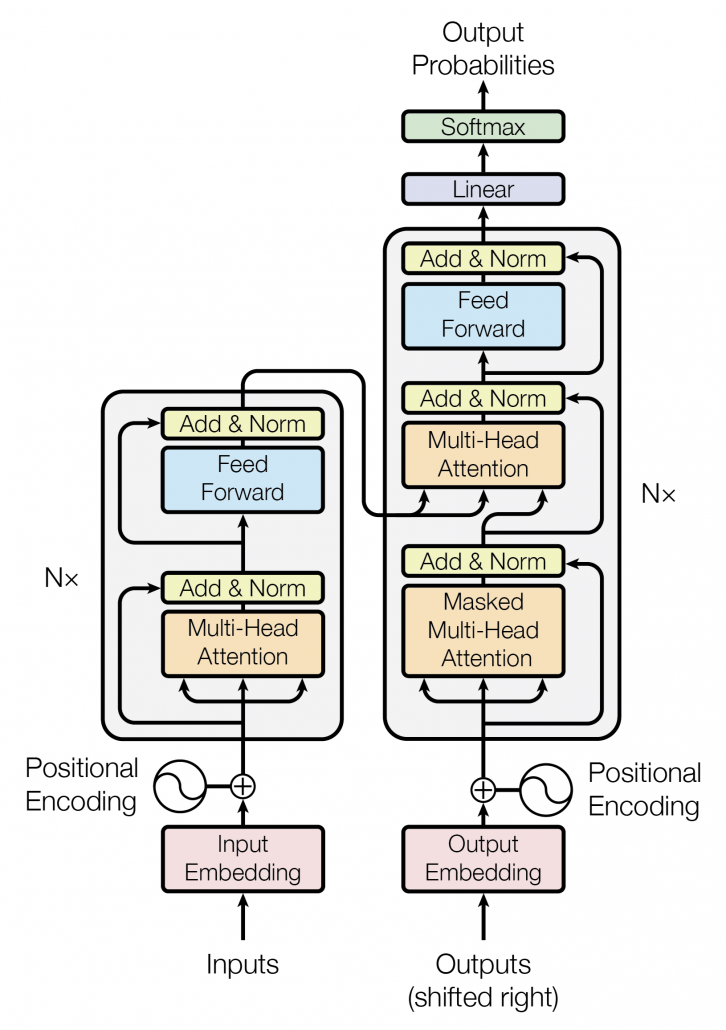
Transformer model was first introduced in the original paper named “Attention Is All You Need,” and from the title you can easily see that attention mechanism plays important roles in this model. When you learn about Transformer model, you will see the figure below, which is used in the original paper on Transformer.  This is the simplified overall structure of one layer of Transformer model, and you stack this layer N times. In one layer of Transformer, there are three multi-head attention, which are displayed as boxes in orange. These are the very parts which compare the tokens on several standards. I made the head article of this article series inspired by this multi-head attention mechanism.

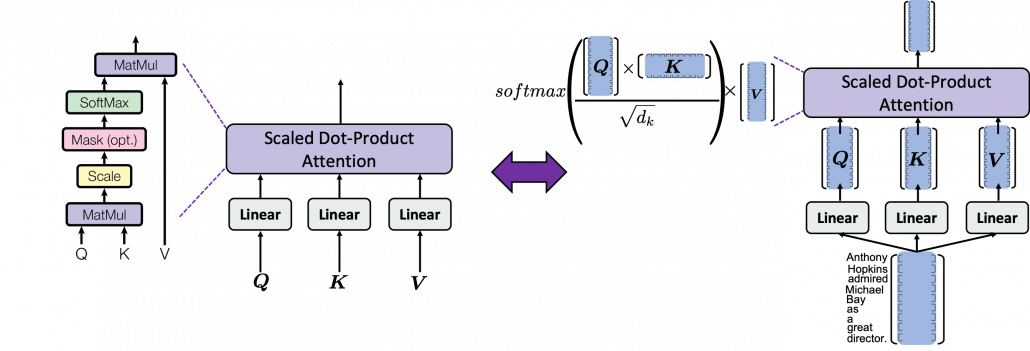
The figure below is also from the original paper on Transfromer. If you can understand how multi-head attention mechanism works with the explanations in the paper, and if you have no troubles understanding the codes in the official Tensorflow tutorial, I have to say this article is not for you. However I bet that is not true of majority of people, and at least I need one article to clearly explain how multi-head attention works. Please keep it in mind that this article covers only the architectures of the two figures below. However multi-head attention mechanisms are crucial components of Transformer model, and throughout this article, you would not only see how they work but also get a little control over it at an implementation level.

1 Multi-head attention mechanism

When you learn Transformer model, I recommend you first to pay attention to multi-head attention. And when you learn multi-head attentions, before seeing what scaled dot-product attention is, you should understand the whole structure of multi-head attention, which is at the right side of the figure above. In order to calculate attentions with a “query”, as I said in the last article, “you compare the ‘query’ with the ‘keys’ and get scores/weights for the ‘values.’ Each score/weight is in short the relevance between the ‘query’ and each ‘key’. And you reweight the ‘values’ with the scores/weights, and take the summation of the reweighted ‘values’.” Sooner or later, you will notice I would be just repeating these phrases over and over again throughout this article, in several ways.

*Even if you are not sure what “reweighting” means in this context, please keep reading. I think you would little by little see what it means especially in the next section.

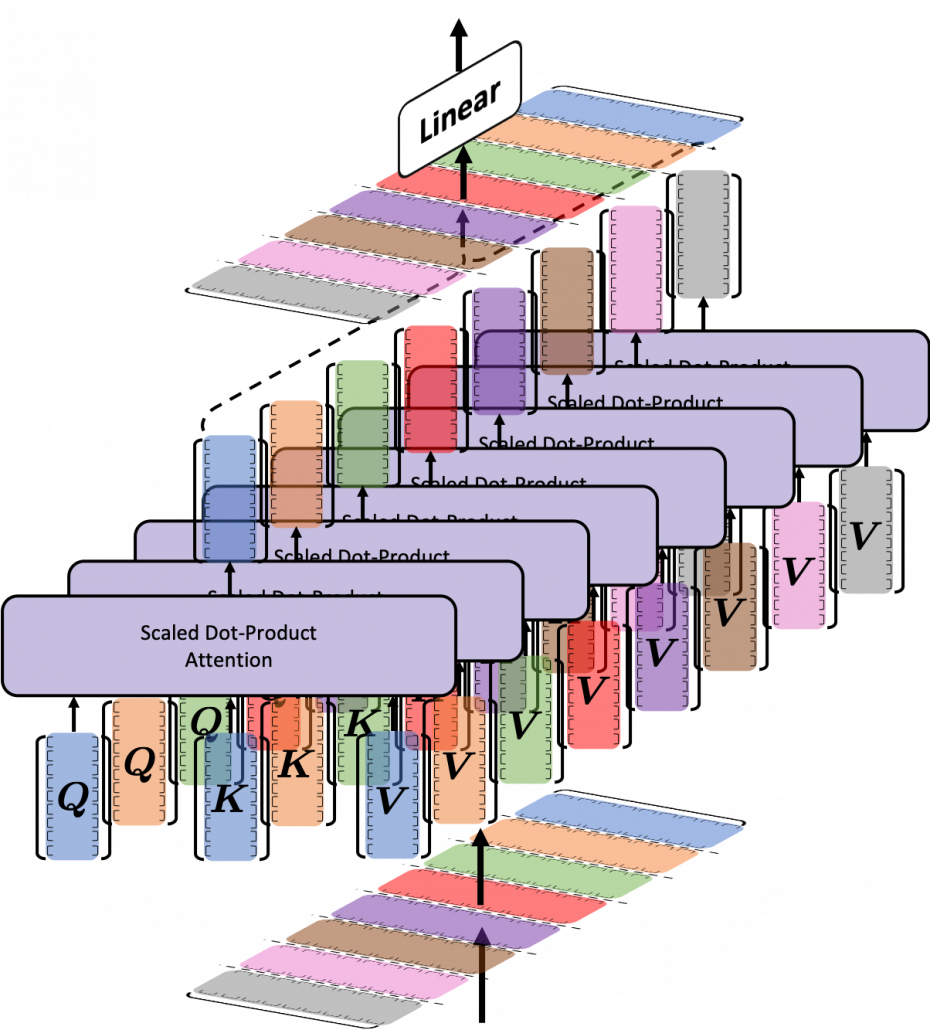
The overall process of calculating multi-head attention, displayed in the figure above, is as follows (Please just keep reading. Please do not think too much.): first you split the V: “values”, K: “keys”, and Q: “queries”, and second you transform those divided “values”, “keys”, and “queries” with densely connected layers (“Linear” in the figure). Next you calculate attention weights and reweight the “values” and take the summation of the reiweighted “values”, and you concatenate the resulting summations. At the end you pass the concatenated “values” through another densely connected layers. The mechanism of scaled dot-product attention is just a matter of how to concretely calculate those attentions and reweight the “values”.

*In the last article I briefly mentioned that “keys” and “queries” can be in the same language. They can even be the same sentence in the same language, and in this case the resulting attentions are called self-attentions, which we are mainly going to see. I think most people calculate “self-attentions” unconsciously when they speak. You constantly care about what “she”, “it” , “the”, or “that” refers to in you own sentence, and we can say self-attention is how these everyday processes is implemented.

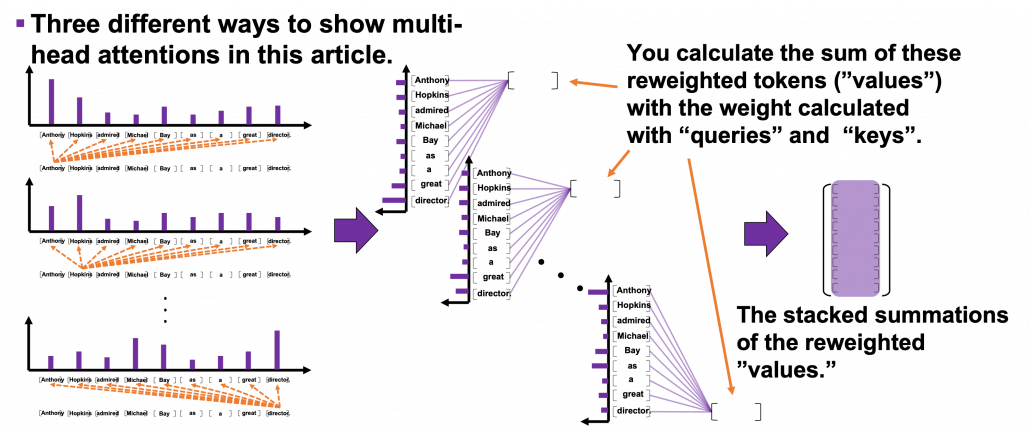
Let’s see the whole process of calculating multi-head attention at a little abstract level. From now on, we consider an example of calculating multi-head self-attentions, where the input is a sentence “Anthony Hopkins admired Michael Bay as a great director.” In this example, the number of tokens is 9, and each token is encoded as a 512-dimensional embedding vector. And the number of heads is 8. In this case, as you can see in the figure below, the input sentence “Anthony Hopkins admired Michael Bay as a great director.” is implemented as a 9\times 512 matrix. You first split each token into 512/8=64 dimensional, 8 vectors in total, as I colored in the figure below. In other words, the input matrix is divided into 8 colored chunks, which are all 9\times 64 matrices, but each colored matrix expresses the same sentence. And you calculate self-attentions of the input sentence independently in the 8 heads, and you reweight the “values” according to the attentions/weights. After this, you stack the sum of the reweighted “values”  in each colored head, and you concatenate the stacked tokens of each colored head. The size of each colored chunk does not change even after reweighting the tokens. According to Ashish Vaswani, who invented Transformer model, each head compare “queries” and “keys” on each standard. If the a Transformer model has 4 layers with 8-head multi-head attention , at least its encoder has 4\times 8 = 32 heads, so the encoder learn the relations of tokens of the input on 32 different standards.

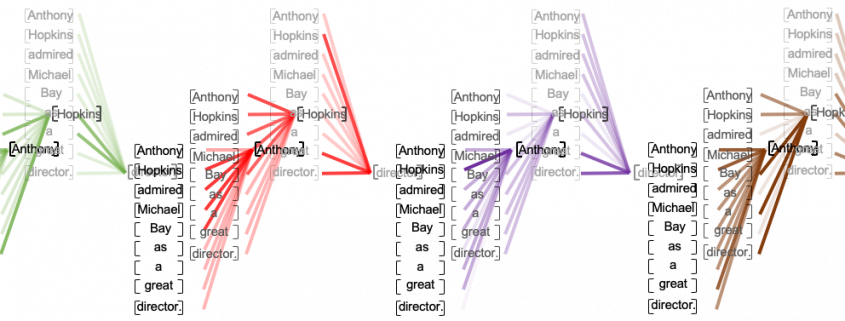
I think you now have rough insight into how you calculate multi-head attentions. In the next section I am going to explain the process of reweighting the tokens, that is, I am finally going to explain what those colorful lines in the head image of this article series are.

*Each head is randomly initialized, so they learn to compare tokens with different criteria. The standards might be straightforward like “what” or “who”, or maybe much more complicated. In attention mechanisms in deep learning, you do not need feature engineering for setting such standards.

2 Calculating attentions and reweighting “values”

If you have read the last article or if you understand attention mechanism to some extent, you should already know that attention mechanism calculates attentions, or relevance between “queries” and “keys.” In the last article, I showed the idea of weights as a histogram, and in that case the “query” was the hidden state of the decoder at every time step, whereas the “keys” were the outputs of the encoder. In this section, I am going to explain attention mechanism in a more abstract way, and we consider comparing more general “tokens”, rather than concrete outputs of certain networks. In this section each [ \cdots ] denotes a token, which is usually an embedding vector in practice.

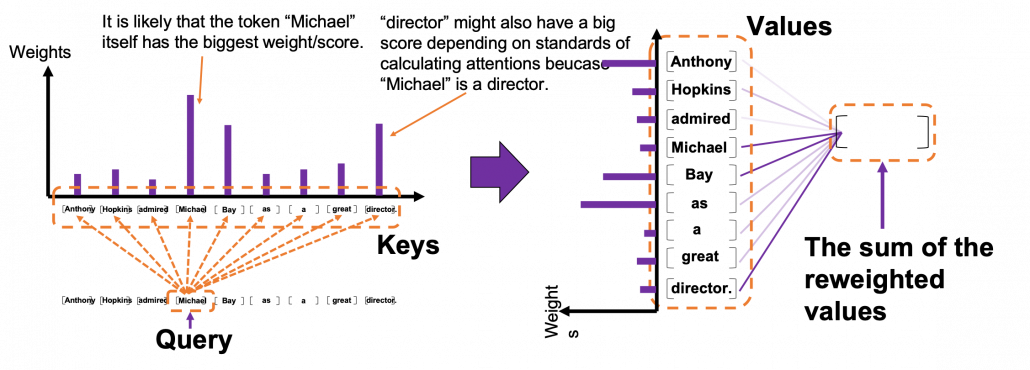
Please remember this mantra of attention mechanism: “you compare the ‘query’ with the ‘keys’ and get scores/weights for the ‘values.’ Each score/weight is in short the relevance between the ‘query’ and each ‘key’. And you reweight the ‘values’ with the scores/weights, and take the summation of the reweighted ‘values’.” The figure below shows an overview of a case where “Michael” is a query. In this case you compare the query with the “keys”, that is, the input sentence “Anthony Hopkins admired Michael Bay as a great director.” and you get the histogram of attentions/weights. Importantly the sum of the weights 1. With the attentions you have just calculated, you can reweight the “values,” which also denote the same input sentence. After that you can finally take a summation of the reweighted values. And you use this summation.

*I have been repeating the phrase “reweighting ‘values’  with attentions,”  but you in practice calculate the sum of those reweighted “values.”

Assume that compared to the “query”  token “Michael”, the weights of the “key” tokens “Anthony”, “Hopkins”, “admired”, “Michael”, “Bay”, “as”, “a”, “great”, and “director.” are respectively 0.06, 0.09, 0.05, 0.25, 0.18, 0.06, 0.09, 0.06, 0.15. In this case the sum of the reweighted token is 0.06″Anthony” + 0.09″Hopkins” + 0.05″admired” + 0.25″Michael” + 0.18″Bay” + 0.06″as” + 0.09″a” + 0.06″great” 0.15″director.”, and this sum is the what wee actually use.

*Of course the tokens are embedding vectors in practice. You calculate the reweighted vector in actual implementation.

You repeat this process for all the “queries.”  As you can see in the figure below, you get summations of 9 pairs of reweighted “values” because you use every token of the input sentence “Anthony Hopkins admired Michael Bay as a great director.” as a “query.” You stack the sum of reweighted “values” like the matrix in purple in the figure below, and this is the output of a one head multi-head attention.

3 Scaled-dot product

This section is a only a matter of linear algebra. Maybe this is not even so sophisticated as linear algebra. You just have to do lots of Excel-like operations. A tutorial on Transformer by Jay Alammar is also a very nice study material to understand this topic with simpler examples. I tried my best so that you can clearly understand multi-head attention at a more mathematical level, and all you need to know in order to read this section is how to calculate products of matrices or vectors, which you would see in the first some pages of textbooks on linear algebra.

We have seen that in order to calculate multi-head attentions, we prepare 8 pairs of “queries”, “keys” , and “values”, which I showed in 8 different colors in the figure in the first section. We calculate attentions and reweight “values” independently in 8 different heads, and in each head the reweighted “values” are calculated with this very simple formula of scaled dot-product: Attention(\boldsymbol{Q}, \boldsymbol{K}, \boldsymbol{V}) =softmax(\frac{\boldsymbol{Q} \boldsymbol{K} ^T}{\sqrt{d}_k})\boldsymbol{V}. Let’s take an example of calculating a scaled dot-product in the blue head.

At the left side of the figure below is a figure from the original paper on Transformer, which explains one-head of multi-head attention. If you have read through this article so far, the figure at the right side would be more straightforward to understand. You divide the input sentence into 8 chunks of matrices, and you independently put those chunks into eight head. In one head, you convert the input matrix by three different fully connected layers, which is “Linear” in the figure below, and prepare three matrices Q, K, V, which are “queries”, “keys”, and “values” respectively.

*Whichever color attention heads are in, the processes are all the same.

*You divide \frac{\boldsymbol{Q} \boldsymbol{K}} ^T by \sqrt{d}_k in the formula. According to the original paper, it is known that re-scaling \frac{\boldsymbol{Q} \boldsymbol{K}} ^T by \sqrt{d}_k is found to be effective. I am not going to discuss why in this article.

As you can see in the figure below, calculating Attention(\boldsymbol{Q}, \boldsymbol{K}, \boldsymbol{V}) is virtually just multiplying three matrices with the same size (Only K is transposed though). The resulting 9\times 64 matrix is the output of the head.

softmax(\frac{\boldsymbol{Q} \boldsymbol{K} ^T}{\sqrt{d}_k}) is calculated like in the figure below. The softmax function regularize each row of the re-scaled product \frac{\boldsymbol{Q} \boldsymbol{K} ^T}{\sqrt{d}_k}, and the resulting 9\times 9 matrix is a kind a heat map of self-attentions.

The process of comparing one “query” with “keys” is done with simple multiplication of a vector and a matrix, as you can see in the figure below. You can get a histogram of attentions for each query, and the resulting 9 dimensional vector is a list of attentions/weights, which is a list of blue circles in the figure below. That means, in Transformer model, you can compare a “query” and a “key” only by calculating an inner product. After re-scaling the vectors by dividing them with \sqrt{d_k} and regularizing them with a softmax function, you stack those vectors, and the stacked vectors is the heat map of attentions.

You can reweight “values” with the heat map of self-attentions, with simple multiplication. It would be more straightforward if you consider a transposed scaled dot-product \boldsymbol{V}^T \cdot softmax(\frac{\boldsymbol{Q} \boldsymbol{K} ^T}{\sqrt{d}_k})^T. This also should be easy to understand if you know basics of linear algebra.

One column of the resulting matrix (\boldsymbol{V}^T \cdot softmax(\frac{\boldsymbol{Q} \boldsymbol{K} ^T}{\sqrt{d}_k})^T) can be calculated with a simple multiplication of a matrix and a vector, as you can see in the figure below. This corresponds to the process or “taking a summation of reweighted ‘values’,” which I have been repeating. And I would like you to remember that you got those weights (blue) circles by comparing a “query” with “keys.”

Again and again, let’s repeat the mantra of attention mechanism together: “you compare the ‘query’ with the ‘keys’ and get scores/weights for the ‘values.’ Each score/weight is in short the relevance between the ‘query’ and each ‘key’. And you reweight the ‘values’ with the scores/weights, and take the summation of the reweighted ‘values’.” If you have been patient enough to follow my explanations, I bet you have got a clear view on how multi-head attention mechanism works.

We have been seeing the case of the blue head, but you can do exactly the same procedures in every head, at the same time, and this is what enables parallelization of multi-head attention mechanism. You concatenate the outputs of all the heads, and you put the concatenated matrix through a fully connected layers.

If you are reading this article from the beginning, I think this section is also showing the same idea which I have repeated, and I bet more or less you no have clearer views on how multi-head attention mechanism works. In the next section we are going to see how this is implemented.

4 Tensorflow implementation of multi-head attention

Let’s see how multi-head attention is implemented in the Tensorflow official tutorial. If you have read through this article so far, this should not be so difficult. I also added codes for displaying heat maps of self attentions. With the codes in this Github page, you can display self-attention heat maps for any input sentences in English.

The multi-head attention mechanism is implemented as below. If you understand Python codes and Tensorflow to some extent, I think this part is relatively easy.  The multi-head attention part is implemented as a class because you need to train weights of some fully connected layers. Whereas, scaled dot-product is just a function.

*I am going to explain the create_padding_mask() and create_look_ahead_mask() functions in upcoming articles. You do not need them this time.

Let’s see a case of using multi-head attention mechanism on a (1, 9, 512) sized input tensor, just as we have been considering in throughout this article. The first axis of (1, 9, 512) corresponds to the batch size, so this tensor is virtually a (9, 512) sized tensor, and this means the input is composed of 9 512-dimensional vectors. In the results below, you can see how the shape of input tensor changes after each procedure of calculating multi-head attention. Also you can see that the output of the multi-head attention is the same as the input, and you get a 9\times 9 matrix of attention heat maps of each attention head.

I guess the most complicated part of this implementation above is the split_head() function, especially if you do not understand tensor arithmetic. This part corresponds to splitting the input tensor to 8 different colored matrices as in one of the figures above. If you cannot understand what is going on in the function, I recommend you to prepare a sample tensor as below.

This is just a simple (1, 9, 512) sized tensor with sequential integer elements. The first row (1, 2, …., 512) corresponds to the first input token, and (4097, 4098, … , 4608) to the last one. You should try converting this sample tensor to see how multi-head attention is implemented. For example you can try the operations below.

These operations correspond to splitting the input into 8 heads, whose sizes are all (9, 64). And the second axis of the resulting (1, 8, 9, 64) tensor corresponds to the index of the heads. Thus sample_sentence[0][0] corresponds to the first head, the blue 9\times 64 matrix. Some Tensorflow functions enable linear calculations in each attention head, independently as in the codes below.

Very importantly, we have been only considering the cases of calculating self attentions, where all “queries”, “keys”, and “values” come from the same sentence in the same language. However, as I showed in the last article, usually “queries” are in a different language from “keys” and “values” in translation tasks, and “keys” and “values” are in the same language. And as you can imagine, usualy “queries” have different number of tokens from “keys” or “values.” You also need to understand this case, which is not calculating self-attentions. If you have followed this article so far, this case is not that hard to you. Let’s briefly see an example where the input sentence in the source language is composed 9 tokens, on the other hand the output is composed 12 tokens.

As I mentioned, one of the outputs of each multi-head attention class is 9\times 9 matrix of attention heat maps, which I displayed as a matrix composed of blue circles in the last section. The the implementation in the Tensorflow official tutorial, I have added codes to display actual heat maps of any input sentences in English.

*If you want to try displaying them by yourself, download or just copy and paste codes in this Github page. Please maker “datasets” directory in the same directory as the code. Please download “spa-eng.zip” from this page, and unzip it. After that please put “spa.txt” on the “datasets” directory. Also, please download the “checkpoints_en_es” folder from this link, and place the folder in the same directory as the file in the Github page. In the upcoming articles, you would need similar processes to run my codes.

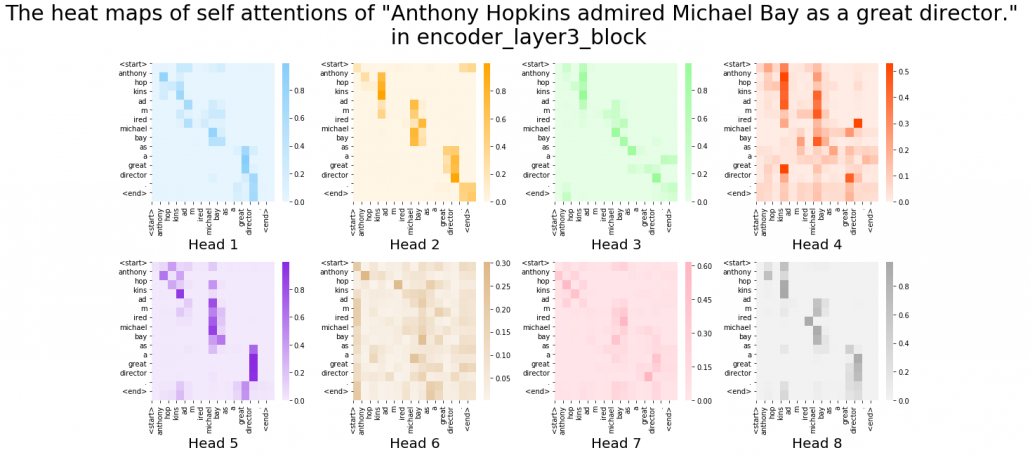
After running codes in the Github page, you can display heat maps of self attentions. Let’s input the sentence “Anthony Hopkins admired Michael Bay as a great director.” You would get a heat maps like this.

In fact, my toy implementation cannot handle proper nouns such as “Anthony” or “Michael.” Then let’s consider a simple input sentence “He admired her as a great director.” In each layer, you respectively get 8 self-attention heat maps.

I think we can see some tendencies in those heat maps. The heat maps in the early layers, which are close to the input, are blurry. And the distributions of the heat maps come to concentrate more or less diagonally. At the end, presumably they learn to pay attention to the start and the end of sentences.

You have finally finished reading this article. Congratulations.

You should be proud of having been patient, and you passed the most tiresome part of learning Transformer model. You must be ready for making a toy English-German translator in the upcoming articles. Also I am sure you have understood that Michael Bay is a great director, no matter what people say.

*Hannibal Lecter, I mean Athony Hopkins, also wrote a letter to the staff of “Breaking Bad,” and he told them the tv show let him regain his passion. He is a kind of admiring around, and I am a little worried that he might be getting senile. He played a role of a father forgetting his daughter in his new film “The Father.” I must see it to check if that is really an acting, or not.

[References]

[1] Ashish Vaswani, Noam Shazeer, Niki Parmar, Jakob Uszkoreit, Llion Jones, Aidan N. Gomez, Lukasz Kaiser, Illia Polosukhin, “Attention Is All You Need” (2017)

[2] “Transformer model for language understanding,” Tensorflow Core
https://www.tensorflow.org/overview

[3] “Neural machine translation with attention,” Tensorflow Core
https://www.tensorflow.org/tutorials/text/nmt_with_attention

[4] Jay Alammar, “The Illustrated Transformer,”
http://jalammar.github.io/illustrated-transformer/

[5] “Stanford CS224N: NLP with Deep Learning | Winter 2019 | Lecture 14 – Transformers and Self-Attention,” stanfordonline, (2019)
https://www.youtube.com/watch?v=5vcj8kSwBCY

[6]Tsuboi Yuuta, Unno Yuuya, Suzuki Jun, “Machine Learning Professional Series: Natural Language Processing with Deep Learning,” (2017), pp. 91-94
坪井祐太、海野裕也、鈴木潤 著, 「機械学習プロフェッショナルシリーズ 深層学習による自然言語処理」, (2017), pp. 191-193

[7]”Stanford CS224N: NLP with Deep Learning | Winter 2019 | Lecture 8 – Translation, Seq2Seq, Attention”, stanfordonline, (2019)
https://www.youtube.com/watch?v=XXtpJxZBa2c

[8]Rosemary Rossi, “Anthony Hopkins Compares ‘Genius’ Michael Bay to Spielberg, Scorsese,” yahoo! entertainment, (2017)
https://www.yahoo.com/entertainment/anthony-hopkins-transformers-director-michael-bay-guy-genius-010058439.html

* I make study materials on machine learning, sponsored by DATANOMIQ. I do my best to make my content as straightforward but as precise as possible. I include all of my reference sources. If you notice any mistakes in my materials, including grammatical errors, please let me know (email: yasuto.tamura@datanomiq.de). And if you have any advice for making my materials more understandable to learners, I would appreciate hearing it.

Positional encoding, residual connections, padding masks: covering the rest of Transformer components

This is the fourth article of my article series named “Instructions on Transformer for people outside NLP field, but with examples of NLP.”

1 Wrapping points up so far

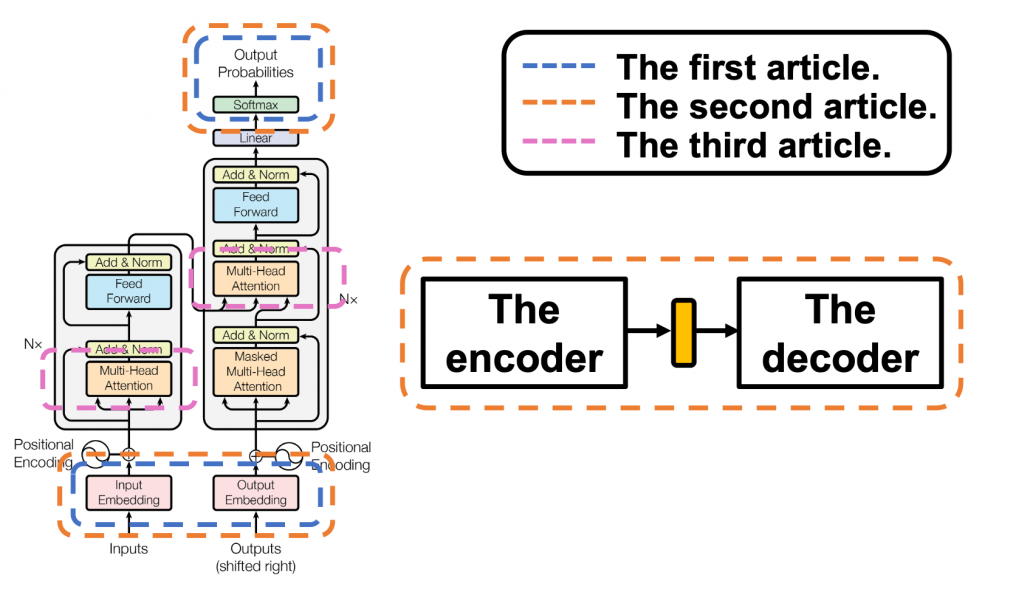
This article series has already covered a great deal of the Transformer mechanism. Whether you have read my former articles or not, I bet you are more or less lost in the course of learning Transformer model. The left side of the figure below is from the original paper on Transformer model, and my previous articles explained the parts in each colored frame. In the first article, I  mainly explained how language is encoded in deep learning task and how that is evaluated.

This is more of a matter of inputs and the outputs of deep learning networks, which are in blue dotted frames in the figure. They are not so dependent on types of deep learning NLP tasks. In the second article, I explained seq2seq models, which are encoder-decoder models used in machine translation. Seq2seq models can can be simplified like the figure in the orange frame. In the article I mainly explained seq2seq models with RNNs, but the purpose of this article series is ultimately replace them with Transformer models. In the last article, I finally wrote about some actual components of Transformer models: multi-head attention mechanism. I think this mechanism is the core of Transformed models, and I did my best to explain it with a whole single article, with a lot of visualizations. However, there are still many elements I have not explained.

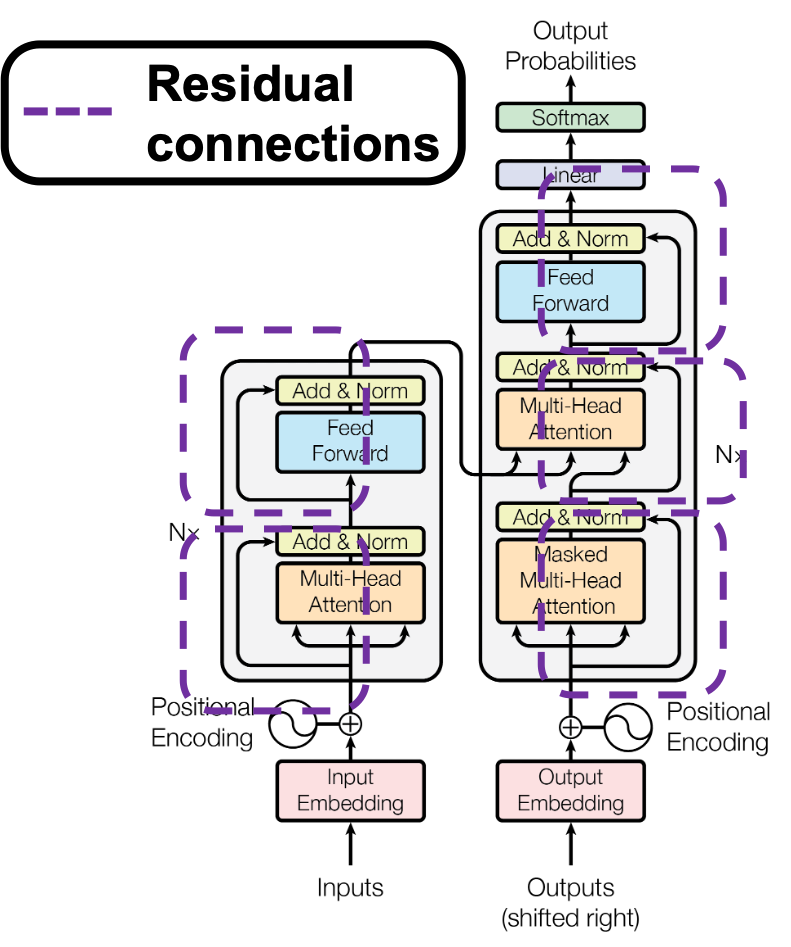
First, you need to do positional encoding to the word embedding so that Transformer models can learn the relations of the positions of input tokens. At least I was too stupid to understand what this is only with the original paper on Transformer. I am going to explain this algorithm in illustrative ways, which I needed to self-teach it. The second point is residual connections.

The last article has already explained multi-head attention, as precisely as I could do, but I still have to say I covered only two multi-head attention parts in a layer of Transformer model, which are in pink frames. During training, you have to mask some tokens at the decoder part so that some of tokens are invisible, and masked multi-head attention enables that.

You might be tired of the words “queries,” “keys,” and “values,” if you read the last article. But in fact that was not enough. When you think about applying Transformer in other tasks, such as object detection or image generation, you need to reconsider what the structure of data and how “queries,” “keys,” and “values,” correspond to each elements of the data, and probably one of my upcoming articles would cover this topic.

2 Why Transformer?

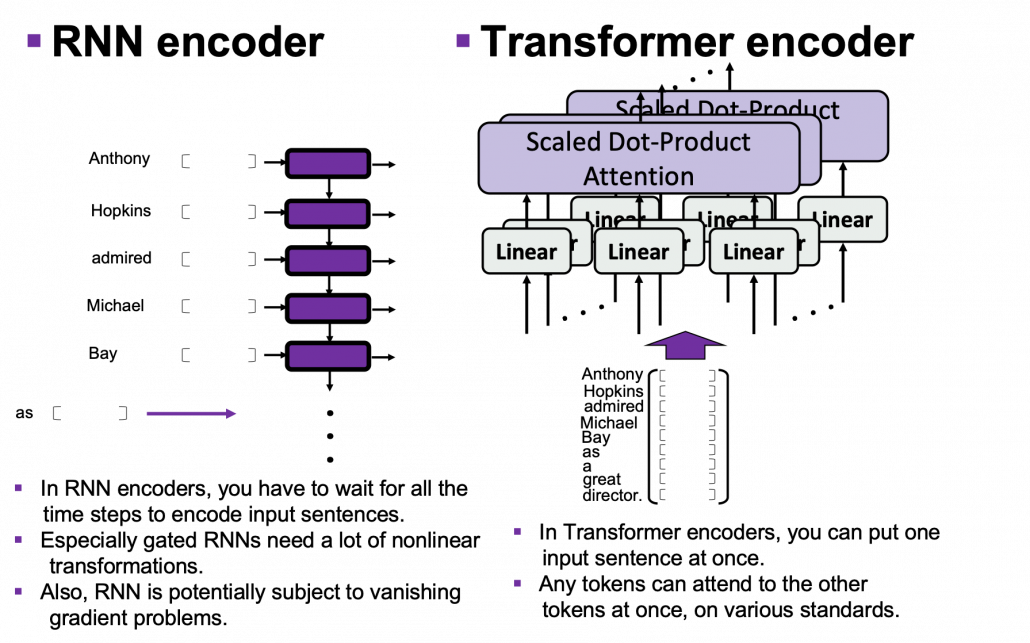
One powerful strength of Transformer model is its parallelization. As you saw in the last article, Trasformer models enable calculating relations of tokens to all other tokens, on different standards, independently in each head. And each head requires very simple linear transformations. In case of RNN encoders, if an input has \tau tokens, basically you have to wait for \tau time steps to finish encoding the input sentence. Also, at the time step (\tau) the RNN cell retains the information at the time step (1) only via recurrent connections. In this way you cannot attend to tokens in the earlier time steps, and this is obviously far from how we compare tokens in a sentence. You can bring information backward by bidirectional connection s in RNN models, but that all the more deteriorate parallelization of the model. And possessing information via recurrent connections, like a telephone game, potentially has risks of vanishing gradient problems. Gated RNN, such as LSTM or GRU mitigate the problems by a lot of nonlinear functions, but that adds to computational costs. If you understand multi-head attention mechanism, I think you can see that Transformer solves those problems.

I guess this is closer to when you speak a foreign language which you are fluent in. You wan to say something in a foreign language, and you put the original sentence in your mother tongue in the “encoder” in your brain. And you decode it, word by word, in the foreign language. You do not have to wait for the word at the end in your language, or rather you have to consider the relations of of a chunk of words to another chunk of words, in forward and backward ways. This is crucial especially when Japanese people speak English. You have to make the conclusion clear in English usually with the second word, but the conclusion is usually at the end of the sentence in Japanese.

3 Positional encoding

I explained disadvantages of RNN in the last section, but RNN has been a standard algorithm of neural machine translation. As I mentioned in the fourth section of the first article of my series on RNN, other neural nets like fully connected layers or convolutional neural networks cannot handle sequence data well. I would say RNN could be one of the only algorithms to handle sequence data, including natural language data, in more of classical methods of time series data processing.

*As I explained in this article, the original idea of RNN was first proposed in 1997, and I would say the way it factorizes time series data is very classical, and you would see similar procedures in many other algorithms. I think Transformer is a successful breakthrough which gave up the idea of processing sequence data time step by time step.

You might have noticed that multi-head attention mechanism does not explicitly uses the the information of the orders or position of input data, as it basically calculates only the products of matrices. In the case where the input is “Anthony Hopkins admired Michael Bay as a great director.”, multi head attention mechanism does not uses the information that “Hopkins” is the second token, or the information that the token two time steps later is “Michael.” Transformer tackles this problem with an almost magical algorithm named positional encoding.

In order to learn positional encoding, you should first think about what kind of encoding is ideal. According to this blog post, ideal encoding of positions of tokens have the following features.

  • Positional encoding of one token deterministically represents the position of the token.
  • The actual values of positional encoding should not be too big compared to the values of elements of embedding vectors.
  • Positional encodings of different tokens should successfully express their relative positions.

The most straightforward way to give the information of position is implementing the index of times steps (t), but if you naively give the term (t) to the data, the term could get too big compared to the values of data ,for example when the sequence data is 100 time steps long. The next straightforward idea is compressing the idea of time steps to for example the range [0, 1]. With this approach, however, the resolution of encodings can vary depending on the length of the input sequence data. Thus these naive approaches do not meet the requirements above, and I guess even conventional RNN-based models were not so successful in these points.

*I guess that is why attention mechanism of RNN seq2seq models, which I explained in the second article, was successful. You can constantly calculate the relative positions of decoder tokens compared to the encoder tokens.

Positional encoding, to me almost magically, meets the points I have mentioned. However the explanation of positional encoding in the original paper of Transformer is unkindly brief. It says you can encode positions of tokens with the following vector PE_{(pos, 2i)} = sin(pos / 10000^{2i/d_model}), PE_{(pos, 2i+1)} = cos(pos / 10000^{2i/d_model}), where i = 0, 1, \dots, d_{model}/2 - 1. d_{model} is the dimension of word embedding. The heat map below is the most typical type of visualization of positional encoding you would see everywhere, and in this case d_{model}=256, and pos is discrete number which varies from 0 to 49, thus the heat map blow is equal to a 50\times 256 matrix, whose elements are from -1 to 1. Each row of the graph corresponds to one token, and you can see that lower dimensional part is constantly changing like waves. Also it is quite easy to encode an input with this positional encoding: assume that you have a matrix of an input sentence composed of 50 tokens, each of which is a 256 dimensional vector, then all you have to do is just adding the heat map below to the matrix.

Concretely writing down, the encoding of the 256-dim token at pos  is (PE_{(pos, 0)}, PE_{(pos, 1)}, \dots ,  PE_{(pos, 254)}, PE_{(pos, 255)})^T = \bigl( sin(pos / 10000^{0/256}), cos(pos / 10000^{0/256}) \bigr),  \dots , \bigl( sin(pos / 10000^{254/256}), cos(pos / 10000^{254/256}) \bigr)^T.

You should see this encoding more as d_{model} / 2 pairs of circles rather than d_{model} dimensional vectors. When you fix the i, the index of the depth of each encoding, you can extract a 2 dimensional vector \boldsymbol{PE}_i = \bigl( sin(pos / 10000^{2i/d_model}), cos(pos / 10000^{2i/d_model}) \bigr). If you constantly change the value pos, the vector \boldsymbol{PE}_i rotates clockwise on the unit circle in the figure below.

Also, the deeper the dimension of the embedding is, I mean the bigger the index i is, the smaller the frequency of rotation is. I think the video below is a more intuitive way to see how each token is encoded with positional encoding. You can see that the bigger pos is, that is the more tokens an input has, the deeper part positional encoding starts to rotate on the circles.


Very importantly, the original paper of Transformer says, “We chose this function because we hypothesized it would allow the model to easily learn to attend by relative positions, since for any fixed offset k, PE_{pos+k} can be represented as a linear function of PE_{pos}.” For each circle at any depth, I mean for any i, the following simple equation holds:

\left( \begin{array}{c} sin(\frac{pos+k}{10000^{2i/d_{model}}}) \\ cos(\frac{pos+k}{10000^{2i/d_{model}}}) \end{array} \right) =
\left( \begin{array}{ccc} cos(\frac{k}{10000^{2i/d_{model}}}) & sin(\frac{k}{10000^{2i/d_{model}}}) \\ -sin(\frac{k}{10000^{2i/d_{model}}}) & cos(\frac{k}{10000^{2i/d_{model}}}) \\ \end{array} \right) \cdot \left( \begin{array}{c} sin(\frac{pos}{10000^{2i/d_{model}}}) \\ cos(\frac{pos}{10000^{2i/d_{model}}}) \end{array} \right)

The matrix is a simple rotation matrix, so if i is fixed the rotation only depends on k, how many positions to move forward or backward. Then we get a very important fact: as the pos changes (pos is a discrete number), each point rotates in proportion to the offset of “pos,” with different frequencies depending on the depth of the circles. The deeper the circle is, the smaller the frequency is. That means, this type of positional encoding encourages Transformer models to learn definite and relative positions of tokens with rotations of those circles, and the values of each element of the rotation matrices are from -1 to 1, so they do not get bigger no matter how many tokens inputs have.

For example when an input is “Anthony Hopkins admired Michael Bay as a great director.”, a shift from the token “Hopkins” to “Bay” is a rotation matrix  \left( \begin{array}{ccc} cos(\frac{k}{10000^{2i/d_{model}}}) & sin(\frac{k}{10000^{2i/d_{model}}}) \\ -sin(\frac{k}{10000^{2i/d_{model}}}) & cos(\frac{k}{10000^{2i/d_{model}}}) \\ \end{array} \right), where k=3. Also the shift from “Bay” to “great” has the same rotation.

*Positional encoding reminded me of Enigma, a notorious cipher machine used by Nazi Germany. It maps alphabets to different alphabets with different rotating gear connected by cables. With constantly changing gears and keys, it changed countless patterns of alphabetical mappings, every day, which is impossible for humans to solve. One of the first form of computers was invented to break Enigma.

*As far as I could understand from “Imitation Game (2014).”

*But I would say Enigma only relied on discrete deterministic algebraic mapping of alphabets. The rotations of positional encoding is not that tricky as Enigma, but it can encode both definite and deterministic positions of much more variety of tokens. Or rather I would say AI algorithms developed enough to learn such encodings with subtle numerical changes, and I am sure development of NLP increased the possibility of breaking the Turing test in the future.

5 Residual connections

If you naively stack neural networks with simple implementation, that would suffer from vanishing gradient problems during training. Back propagation is basically multiplying many gradients, so

One way to mitigate vanishing gradient problems is quite easy: you have only to make a bypass of propagation. You would find a lot of good explanations on residual connections, so I am not going to explain how this is effective for vanishing gradient problems in this article.

In Transformer models you add positional encodings to the input only in the first layer, but I assume that the encodings remain through the layers by these bypass routes, and that might be one of reasons why Transformer models can retain information of positions of tokens.

6 Masked multi-head attention

Even though Transformer, unlike RNN, can attend to the whole input sentence at once, the decoding process of Transformer-based translator is close to RNN-based one, and you are going to see that more clearly in the codes in the next article. As I explained in the second article, RNN decoders decode each token only based on the tokens the have generated so far. Transformer decoder also predicts the output sequences autoregressively one token at a time step, just as RNN decoders. I think it easy to understand this process because RNN decoder generates tokens just as you connect RNN cells one after another, like connecting rings to a chain. In this way it is easy to make sure that generating of one token in only affected by the former tokens. On the other hand, during training Transformer decoders, you input the whole sentence at once. That means Transformer decoders can see the whole sentence during training. That is as if a student preparing for a French translation test could look at the whole answer French sentences. It is easy to imagine that you cannot prepare for the French test effectively if you study this way. Transformer decoders also have to learn to decode only based on the tokens they have generated so far.

In order to properly train a Transformer-based translator to learn such decoding, you have to hide the upcoming tokens in target sentences during training. During calculating multi-head attentions in each Transformer layer, if you keep ignoring the weights from up coming tokens like in the figure below, it is likely that Transformer models learn to decode only based on the tokens generated so far. This is called masked multi-head attention.

*I am going to take an input “Anthonly Hopkins admire Michael Bay as a great director.” as an example of calculating masked multi-head attention mechanism, but this is supposed to be in the target laguage. So when you train an translator from English to German, in practice you have to calculate masked multi-head atetntion of “Anthony Hopkins hat Michael Bay als einen großartigen Regisseur bewundert.”

As you can see from the whole architecture of Transformer, you only need to consider masked multi-head attentions of of self-attentions of the input sentences at the decoder side. In order to concretely calculate masked multi-head attentions, you need a technique named look ahead masking. This is also quite simple. Just as well as the last article, let’s take an example of calculating self attentions of an input “Anthony Hopkins admired Michael Bay as a great director.” Also in this case you just calculate multi-head attention as usual, but when you get the histograms below, you apply look ahead masking to each histogram and delete the weights from the future tokens. In the figure below the black dots denote zero, and the sum of each row of the resulting attention map is also one. In other words, you get a lower triangular matrix, the sum of whose each row is 1.

Also just as I explained in the last article, you reweight vlaues with the triangular attention map. The figure below is calculating a transposed masked multi-head attention because I think it is a more straightforward way to see how vectors are reweighted in multi-head attention mechanism.

When you closely look at how each column of the transposed multi-head attention is reweighted, you can clearly see that the token is reweighted only based on the tokens generated so far.

*If you are still not sure why you need such masking in multi-head attention of target sentences, you should proceed to the next article for now. Once you check the decoding processes of Transformer-based translators, you would see why you need masked multi-head attention mechanism on the target sentence during training.

If you have read my articles, at least this one and the last one, I think you have gained more or less clear insights into how each component of Transfomer model works. You might have realized that each components require simple calculations. Combined with the fact that multi-head attention mechanism is highly parallelizable, Transformer is easier to train, compared to RNN.

In this article, we are going to see how masking of multi-head attention is implemented and how the whole Transformer structure is constructed. By the end of the next article, you would be able to create a toy English-German translator with more or less clear understanding on its architecture.

Appendix

You can visualize positional encoding the way I explained with simple Python codes below. Please just copy and paste them, importing necessary libraries. You can visualize positional encoding as both heat maps and points rotating on rings, and in this case the dimension of word embedding is 256, and the maximum length of sentences is 50.

# I borrowed this code from Tensorflow official tutorial. 
# https://www.tensorflow.org/tutorials/text/transformer

import matplotlib as mpl
from mpl_toolkits.mplot3d import Axes3D
import numpy as np
import matplotlib.pyplot as plt
from matplotlib import cm

def get_angles(pos, i, d_model):
  angle_rates = 1 / np.power(10000, (2 * (i//2)) / np.float32(d_model))
  return pos * angle_rates

def positional_encoding(position, d_model):
  angle_rads = get_angles(np.arange(position)[:, np.newaxis],
                          np.arange(d_model)[np.newaxis, :],
                          d_model)

  # apply sin to even indices in the array; 2i
  angle_rads[:, 0::2] = np.sin(angle_rads[:, 0::2])

  # apply cos to odd indices in the array; 2i+1
  angle_rads[:, 1::2] = np.cos(angle_rads[:, 1::2])

  pos_encoding = angle_rads[np.newaxis, ...]

  return pos_encoding.astype(np.float32)

resolution = 50
d_model = 256

n, d = resolution, d_model
pos_encoding = positional_encoding(n, d)
pos_encoding = pos_encoding[0]

plt.figure(figsize=(25, 10))
plt.pcolormesh(pos_encoding, cmap='RdBu')
plt.gca().invert_yaxis()
plt.ylabel('pos (the position of token)', fontsize=30)
plt.xlabel('2i, 2i+1', fontsize=30)
plt.colorbar()
plt.title("Positional encoding of 50 256-d tokens", fontsize=40)
plt.savefig("positional_encoding_heat_map.png")
plt.show()


import matplotlib as mpl
from mpl_toolkits.mplot3d import Axes3D
import numpy as np
import matplotlib.pyplot as plt
from matplotlib import cm

def get_angles(pos, i, d_model):
  angle_rates = 1 / np.power(10000, (2 * (i//2)) / np.float32(d_model))
  return pos * angle_rates

def positional_encoding(position, d_model):
  angle_rads = get_angles(np.arange(position)[:, np.newaxis],
                          np.arange(d_model)[np.newaxis, :],
                          d_model)

  # apply sin to even indices in the array; 2i
  angle_rads[:, 0::2] = np.sin(angle_rads[:, 0::2])

  # apply cos to odd indices in the array; 2i+1
  angle_rads[:, 1::2] = np.cos(angle_rads[:, 1::2])

  pos_encoding = angle_rads[np.newaxis, ...]

  return pos_encoding.astype(np.float32)


# A function to mix blue and red colors. 
def blue_red_gradation(x, y):
    red = np.array([1.0, 0.0, 0.0])
    blue = np.array([0.0, 0.0, 1.0])
    combined_color_x = (max(0, x)*blue + abs(min(x, 0))*red)/(abs(x) + abs(y))
    combined_color_y = (max(0, y)*blue + abs(min(y, 0))*red)/(abs(x) + abs(y))
    combined_color = (combined_color_x*abs(x) + combined_color_y*abs(y))/(abs(x) + abs(y))
    return combined_color[np.newaxis, ...]


resolution = 50
d_model = 256
x_range = 512
x_coordinates = np.linspace(0, d_model//2 - 1, d_model//2)
radius = 1
angular_velocity = np.pi / 12
y_coordinates = radius*np.cos(np.linspace(0, 1, resolution)*2*np.pi)
z_coordinates = radius*np.sin(np.linspace(0, 1, resolution)*2*np.pi)


n, d = resolution, d_model
pos_encoding = positional_encoding(n, d)
pos_encoding = pos_encoding[0]


#ax = fig.add_subplot(1, 1, 1, projection='3d')
color_vec = [[1., 0., 1.]]

markersize = 1
for j in range(resolution):
#for j in range(5):
    fig = plt.figure(figsize=(25, 10))
    ax = fig.gca(projection='3d')
    for i in range(d_model//2):
        ax.plot(x_coordinates[i]*np.ones(len(y_coordinates)), y_coordinates, z_coordinates, c='black', alpha=0.2)
    
    
    for i in range(len(x_coordinates)):
        ax.scatter(x_coordinates[i], radius*pos_encoding[:, 0::2][j, i], radius*pos_encoding[:, 1::2][j, i], 
                   c=blue_red_gradation(pos_encoding[:, 0::2][j, i], pos_encoding[:, 1::2][j, i]), alpha=0.5, s=20)
        ax.grid(False)

    ax.set_title(r'No. {} token  (pos)'.format(j+1), fontsize=40)
    ax.set_xlabel(r"i  (index of dimension)", fontsize=40)
    ax.set_ylabel(r'PE_{(pos, 2i)}', fontsize=40)
    ax.set_zlabel(r'PE_{(pos, 2i+1)}', fontsize=40)
    ax.set_xticks(np.arange(0, d_model//2, 10))
    plt.subplots_adjust(left=0, right=1, bottom=0, top=1)
    #plt.savefig('./positional_encoding_gif/{}.png'.format(j+1))
    plt.show()


*In fact some implementations use different type of positional encoding, as you can see in the codes below. In this case, embedding vectors are roughly divided into two parts, and each part is encoded with different sine waves. I have been using a metaphor of rotating rings or gears in this article to explain positional encoding, but to be honest that is not necessarily true of all the types of Transformer implementation. Some papers compare different types of pairs of positional encoding. The most important point is, Transformer models is navigated to learn positions of tokens with certain types of mathematical patterns.

[References]

[1] Ashish Vaswani, Noam Shazeer, Niki Parmar, Jakob Uszkoreit, Llion Jones, Aidan N. Gomez, Lukasz Kaiser, Illia Polosukhin, “Attention Is All You Need” (2017)

[2] “Transformer model for language understanding,” Tensorflow Core
https://www.tensorflow.org/overview

[3] Jay Alammar, “The Illustrated Transformer,”
http://jalammar.github.io/illustrated-transformer/

[4] “Stanford CS224N: NLP with Deep Learning | Winter 2019 | Lecture 14 – Transformers and Self-Attention,” stanfordonline, (2019)
https://www.youtube.com/watch?v=5vcj8kSwBCY

[5]Harada Tatsuya, “Machine Learning Professional Series: Image Recognition,” (2017), pp. 191-193
原田達也 著, 「機械学習プロフェッショナルシリーズ 画像認識」, (2017), pp. 191-193

[6] Amirhossein Kazemnejad, “Transformer Architecture: The Positional Encoding
Let’s use sinusoidal functions to inject the order of words in our model”, Amirhossein Kazemnejad’s Blog, (2019)
https://kazemnejad.com/blog/transformer_architecture_positional_encoding/

[7] Nicolas Carion, Francisco Massa, Gabriel Synnaeve, Nicolas Usunier, Alexander Kirillov, Sergey Zagoruyko, “End-to-End Object Detection with Transformers,” (2020)

[8]中西 啓、「【第5回】機械式暗号機の傑作~エニグマ登場~」、HH News & Reports, (2011)
https://www.hummingheads.co.jp/reports/series/ser01/110714.html

[9]中西 啓、「【第6回】エニグマ解読~第2次世界大戦とコンピュータの誕生~」、HH News & Reports, (2011)

[10]Tsuboi Yuuta, Unno Yuuya, Suzuki Jun, “Machine Learning Professional Series: Natural Language Processing with Deep Learning,” (2017), pp. 91-94
坪井祐太、海野裕也、鈴木潤 著, 「機械学習プロフェッショナルシリーズ 深層学習による自然言語処理」, (2017), pp. 191-193

[11]”Stanford CS224N: NLP with Deep Learning | Winter 2019 | Lecture 8 – Translation, Seq2Seq, Attention”, stanfordonline, (2019)
https://www.youtube.com/watch?v=XXtpJxZBa2c

* I make study materials on machine learning, sponsored by DATANOMIQ. I do my best to make my content as straightforward but as precise as possible. I include all of my reference sources. If you notice any mistakes in my materials, including grammatical errors, please let me know (email: yasuto.tamura@datanomiq.de). And if you have any advice for making my materials more understandable to learners, I would appreciate hearing it.


On the difficulty of language: prerequisites for NLP with deep learning

1 Preface

This section is virtually just my essay on language. You can skip this if you want to get down on more technical topic.

As I do not study in natural language processing (NLP) field, I would not be able to provide that deep insight into this fast changing deep leaning field throughout my article series. However at least I do understand language is a difficult and profound field, not only in engineering but also in many other study fields. Some people might be feeling that technologies are eliminating languages, or one’s motivations to understand other cultures. First of all, I would like you to keep it in mind that I am not a geek who is trying to turn this multilingual world into a homogeneous one and rebuild Tower of Babel, with deep learning. I would say I am more keen on social or anthropological sides of language.

I think you would think more about languages if you have mastered at least one foreign language. As my mother tongue is Japanese, which is totally different from many other Western languages in terms of characters and ambiguity, I understand translating is not what learning a language is all about. Each language has unique characteristics, and I believe they more or less influence one’s personalities. For example, many Western languages make the verb, I mean the conclusion, of sentences clear in the beginning part of the sentences. That is also true of Chinese, I heard. However in Japanese, the conclusion comes at the end, so that is likely to give an impression that Japanese people are being obscure or indecisive. Also, Japanese sentences usually omit their subjects. In German as well, the conclusion of a sentences tend to come at the end, but I am almost 100% sure that no Japanese people would feel German people make things unclear. I think that comes from the structures of German language, which tends to make the number, verb, relations of words crystal clear.

Let’s take an example to see how obscure Japanese is. A Japanese sentence 「頭が赤い魚を食べる猫」can be interpreted in five ways, depending on where you put emphases on.

Common sense tells you that the sentence is likely to mean the first two cases, but I am sure they can mean those five possibilities. There might be similarly obscure sentences in other languages, but I bet few languages can be as obscure as Japanese. Also as you can see from the last two sentences, you can omit subjects in Japanese. This rule is nothing exceptional. Japanese people usually don’t use subjects in normal conversations. And when you read classical Japanese, which Japanese high school students have to do just like Western students learn some of classical Latin, the writings omit subjects much more frequently.

*However interestingly we have rich vocabulary of subjects. The subject “I” can be translated to 「私」、「僕」、「俺」、「自分」、「うち」etc, depending on your personality, who you are talking to, and the time when it is written in.

I believe one can see the world only in the framework of their language, and it seems one’s personality changes depending on the language they use. I am not sure whether the language originally determines how they think, or how they think forms the language. But at least I would like you to keep it in mind that if you translate a conversation, for example a random conversation at a bar in Berlin, into Japanese, that would linguistically sound Japanese, but not anthropologically. Imagine that such kind of random conversation in Berlin or something is like playing a catch, I mean throwing a ball named “your opinion.” On the other hand,  normal conversations of Japanese people are in stead more of, I would say,  “resonance” of several tuning forks. They do their bests to show that they are listening to each other, by excessively nodding or just repeating “Really?”, but usually it seems hardly any constructive dialogues have been made.

*I sometimes feel you do not even need deep learning to simulate most of such Japanese conversations. Several-line Python codes would be enough.

My point is, this article series is mainly going to cover only a few techniques of NLP in deep learning field: sequence to sequence model (seq2seq model) , and especially Transformer. They are, at least for now, just mathematical models and mappings of a small part of this profound field of language (as far as I can cover in this article series). But still, examples of language would definitely help you understand Transformer model in the long run.

2 Tokens and word embedding

*Throughout my article series, “words” just means the normal words you use in daily life. “Tokens” means more general unit of NLP tasks. For example the word “Transformer” might be denoted as a single token “Transformer,” or maybe as a combination of two tokens “Trans” and “former.”

One challenging part of handling language data is its encodings. If you started learning programming in a language other than English, you would have encountered some troubles of using keyboards with different arrangements or with characters. Some comments on your codes in your native languages are sometimes not readable on some software. You can easily get away with that by using only English, but when it comes to NLP you have to deal with this difficulty seriously. How to encode characters in each language should be a first obstacle of NLP. In this article we are going to rely on a library named BPEmb, which provides word embedding in various languages, and you do not have to care so much about encodings in languages all over the world with this library.

In the first section, you might have noticed that Japanese sentence is not separated with spaces like Western languages. This is also true of Chinese language, and that means we need additional tasks of separating those sentences at least into proper chunks of words. This is not only a matter of engineering, but also of some linguistic fields. Also I think many people are not so conscious of how sentences in their native languages are grammatically separated.

The next point is, unlike other scientific data, such as temperature, velocity, voltage, or air pressure, language itself is not measured as numerical data. Thus in order to process language, including English, you first have to map language to certain numerical data, and after some processes you need to conversely map the output numerical data into language data. This section is going to be mainly about one-hot encoding and word embedding, the ways to convert word/token into numerical data. You might already have heard about this

You might have learnt about word embedding to some extent, but I hope you could get richer insight into this topic through this article.

2.1 One-hot encoding

One-hot encoding would be the most straightforward way to encode words/tokens. Assume that you have a dictionary whose size is |\mathcal{V}|, and it includes words from “a”, “ablation”, “actually” to “zombie”, “?”, “!”

In a mathematical manner, in order to choose a word out of those |\mathcal{V}| words, all you need is a |\mathcal{V}| dimensional vector, one of whose elements is 1, and the others are 0. When you want to choose the No. i word, which is “indeed” in the example below, its corresponding one-hot vector is \boldsymbol{v} = (0, \dots, 1, \dots, 0 ), where only the No. i element is 1. One-hot encoding is also easy to understand, and that’s all. It is easy to imagine that people have already come up with more complicated and better way to encoder words. And one major way to do that is word embedding.

2.2 Word embedding

Source: Francois Chollet, Deep Learning with Python,(2018), Manning

Actually word embedding is related to one-hot encoding, and if you understand how to train a simple neural network, for example densely connected layers, you would understand word embedding easily. The key idea of word embedding is denoting each token with a D dimensional vector, whose dimension is fewer than the vocabulary size |\mathcal{V}|. The elements of the resulting word embedding vector are real values, I mean not only 0 or 1. Obviously you can encode much richer variety of tokens with such vectors. The figure at the left side is from “Deep Learning with Python” by François Chollet, and I think this is an almost perfect and simple explanation of the comparison of one-hot encoding and word embedding. But the problem is how to get such convenient vectors. The answer is very simple: you have only to train a network whose inputs are one-hot vector of the vocabulary.

The figure below is a simplified model of word embedding of a certain word. When the word is input into a neural network, only the corresponding element of the one-hot vector is 1, and that virtually means the very first input layer is composed of one neuron whose value is 1. And the only one neuron propagates to the next D dimensional embedding layer. These weights are the very values which most other study materials call “an embedding vector.”

When you input each word into a certain network, for example RNN or Transformer, you map the input one-hot vector into the embedding layer/vector. The examples in the figure are how inputs are made when the input sentences are “You’ve got the touch” and “You’ve got the power.”   Assume that you have a dictionary of one-hot encoding, whose vocabulary is {“the”, “You’ve”, “Walberg”, “touch”, “power”, “Nights”, “got”, “Mark”, “Boogie”}, and the dimension of word embeding is 6. In this case |\mathcal{V}| = 9, D=6. When the inputs are “You’ve got the touch” or “You’ve got the power” , you put the one-hot vector corresponding to “You’ve”, “got”, “the”, “touch” or “You’ve”, “got”, “the”, “power” sequentially every time step t.

In order to get word embedding of certain vocabulary, you just need to train the network. We know that the words “actually” and “indeed” are used in similar ways in writings. Thus when we propagate those words into the embedding layer, we can expect that those embedding layers are similar. This is how we can mathematically get effective word embedding of certain vocabulary.

More interestingly, if word embedding is properly trained, you can mathematically “calculate” words. For example, \boldsymbol{v}_{king} - \boldsymbol{v}_{man} + \boldsymbol{v}_{woman} \approx \boldsymbol{v}_{queen}, \boldsymbol{v}_{Japan} - \boldsymbol{v}_{Tokyo} + \boldsymbol{v}_{Vietnam} \approx \boldsymbol{v}_{Hanoi}.

*I have tried to demonstrate this type of calculation on several word embedding, but none of them seem to work well. At least you should keep it in mind that word embedding learns complicated linear relations between words.

I should explain word embedding techniques such as word2vec in detail, but the main focus of this article is not NLP, so the points I have mentioned are enough to understand Transformer model with NLP examples in the upcoming articles.


3 Language model

Language models is one of the most straightforward, but crucial ideas in NLP. This is also a big topic, so this article is going to cover only basic points. Language model is a mathematical model of the probabilities of which words to come next, given a context. For example if you have a sentence “In the lecture, he opened a _.”, a language model predicts what comes at the part “_.” It is obvious that this is contextual. If you are talking about general university students, “_” would be “textbook,” but if you are talking about Japanese universities, especially in liberal art department, “_” would be more likely to be “smartphone. I think most of you use this language model everyday. When you type in something on your computer or smartphone, you would constantly see text predictions, or they might even correct your spelling or grammatical errors. This is language modelling. You can make language models in several ways, such as n-gram and neural language models, but in this article I can explain only general formulations for such models.

*I am not sure which algorithm is used in which services. That must be too fast changing and competitive for me to catch up.

As I mentioned in the first article series on RNN, a sentence is usually processed as sequence data in NLP. One single sentence is denoted as \boldsymbol{X} = (\boldsymbol{x}^{(1)}, \dots, \boldsymbol{x}^{(\tau)}), a list of vectors. The vectors are usually embedding vectors, and the (t) is the index of the order of tokens. For example the sentence “You’ve go the power.” can be expressed as \boldsymbol{X} = (\boldsymbol{x}^{(1)}, \boldsymbol{x}^{(2)}, \boldsymbol{x}^{(3)}, \boldsymbol{x}^{(4)}), where \boldsymbol{x}^{(1)}, \boldsymbol{x}^{(2)}, \boldsymbol{x}^{(3)}, \boldsymbol{x}^{(4)} denote “You’ve”, “got”, “the”, “power”, “.” respectively. In this case \tau = 4.

In practice a sentence \boldsymbol{X} usually includes two tokens BOS and EOS at the beginning and the end of the sentence. They mean “Beginning Of Sentence” and “End Of Sentence” respectively. Thus in many cases \boldsymbol{X} = (\boldsymbol{BOS} , \boldsymbol{x}^{(1)}, \dots, \boldsymbol{x}^{(\tau)}, \boldsymbol{EOS} ). \boldsymbol{BOS} and \boldsymbol{EOS} are also both vectors, at least in the Tensorflow tutorial.

P(\boldsymbol{X} = (\boldsymbol{BOS}, \boldsymbol{x}^{(1)}, \dots, \boldsymbol{x}^{(\tau)}, \boldsymbol{EOS}) is the probability of incidence of the sentence. But it is easy to imagine that it would be very hard to directly calculate how likely the sentence \boldsymbol{X} appears out of all possible sentences. I would rather say it is impossible. Thus instead in NLP we calculate the probability P(\boldsymbol{X}) as a product of the probability of incidence or a certain word, given all the words so far. When you’ve got the words (\boldsymbol{x}^{(1)}, \dots, \boldsymbol{x}^{(t-1}) so far, the probability of the incidence of \boldsymbol{x}^{(t)}, given the context is  P(\boldsymbol{x}^{(t)}|\boldsymbol{x}^{(1)}, \dots, \boldsymbol{x}^{(t-1)}). P(\boldsymbol{BOS}) is a probability of the the sentence \boldsymbol{X} being (\boldsymbol{BOS}), and the probability of \boldsymbol{X} being (\boldsymbol{BOS}, \boldsymbol{x}^{(1)}) can be decomposed this way: P(\boldsymbol{BOS}, \boldsymbol{x}^{(1)}) = P(\boldsymbol{x}^{(1)}|\boldsymbol{BOS})P(\boldsymbol{BOS}).

Just as well P(\boldsymbol{BOS}, \boldsymbol{x}^{(1)}, \boldsymbol{x}^{(2)}) = P(\boldsymbol{x}^{(2)}| \boldsymbol{BOS}, \boldsymbol{x}^{(1)}) P( \boldsymbol{BOS}, \boldsymbol{x}^{(1)})= P(\boldsymbol{x}^{(2)}| \boldsymbol{BOS}, \boldsymbol{x}^{(1)}) P(\boldsymbol{x}^{(1)}| \boldsymbol{BOS}) P( \boldsymbol{BOS}).

Hence, the general probability of incidence of a sentence \boldsymbol{X} is P(\boldsymbol{X})=P(\boldsymbol{BOS}, \boldsymbol{x}^{(1)}, \boldsymbol{x}^{(2)}, \dots, \boldsymbol{x}^{(\tau -1)}, \boldsymbol{x}^{(\tau)}, \boldsymbol{EOS}) = P(\boldsymbol{EOS}| \boldsymbol{BOS}, \boldsymbol{x}^{(1)}, \dots, \boldsymbol{x}^{(\tau)}) P(\boldsymbol{x}^{(\tau)}| \boldsymbol{BOS}, \boldsymbol{x}^{(1)}, \dots, \boldsymbol{x}^{(\tau - 1)}) \cdots P(\boldsymbol{x}^{(2)}| \boldsymbol{BOS}, \boldsymbol{x}^{(1)}) P(\boldsymbol{x}^{(1)}| \boldsymbol{BOS}) P(\boldsymbol{BOS}).

Let \boldsymbol{x}^{(0)} be \boldsymbol{BOS} and \boldsymbol{x}^{(\tau + 1)} be \boldsymbol{EOS}. Plus, let P(\boldsymbol{x}^{(t+1)}|\boldsymbol{X}_{[0, t]}) be P(\boldsymbol{x}^{(t+1)}|\boldsymbol{x}^{(0)}, \dots, \boldsymbol{x}^{(t)}), then P(\boldsymbol{X}) = P(\boldsymbol{x}^{(0)})\prod_{t=0}^{\tau}{P(\boldsymbol{x}^{(t+1)}|\boldsymbol{X}_{[0, t]})}. Language models calculate which words to come sequentially in this way.

Here’s a question: how would you evaluate a language model?

I would say the answer is, when the language model generates words, the more confident the language model is, the better the language model is. Given a context, when the distribution of the next word is concentrated on a certain word, we can say the language model is confident about which word to come next, given the context.

*For some people, it would be more understandable to call this “entropy.”

Let’s take the vocabulary {“the”, “You’ve”, “Walberg”, “touch”, “power”, “Nights”, “got”, “Mark”, “Boogie”} as an example. Assume that P(\boldsymbol{X}) = P(\boldsymbol{BOS}, \boldsymbol{You've}, \boldsymbol{got}, \boldsymbol{the}, \boldsymbol{touch}, \boldsymbol{EOS}) = P(\boldsymbol{BOS}, \boldsymbol{x}^{(1)}, \boldsymbol{x}^{(2)}, \boldsymbol{x}^{(3)}, \boldsymbol{x}^{(4)}, \boldsymbol{EOS})= P(\boldsymbol{x}^{(0)})\prod_{t=0}^{4}{P(\boldsymbol{x}^{(t+1)}|\boldsymbol{X}_{[0, t]})}. Given a context (\boldsymbol{BOS}, \boldsymbol{x}^{(1)}), the probability of incidence of \boldsymbol{x}^{(2)} is P(\boldsymbol{x}^{2}|\boldsymbol{BOS}, \boldsymbol{x}^{(1)}). In the figure below, the distribution at the left side is less confident because probabilities do not spread widely, on the other hand the one at the right side is more confident that next word is “got” because the distribution concentrates on “got”.

*You have to keep it in mind that the sum of all possible probability P(\boldsymbol{x}^{(2)} | \boldsymbol{BOS}, \boldsymbol{x}^{(1)}) is 1, that is, P(\boldsymbol{the}| \boldsymbol{BOS}, \boldsymbol{x}^{(1)}) + P(\boldsymbol{You've}| \boldsymbol{BOS}, \boldsymbol{x}^{(1)}) + \cdots + P(\boldsymbol{Boogie}| \boldsymbol{BOS}, \boldsymbol{x}^{(1)}) = 1.

While the language model generating the sentence “BOS You’ve got the touch EOS”, it is better if the language model keeps being confident. If it is confident, P(\boldsymbol{X})= P(\boldsymbol{BOS}) P(\boldsymbol{x}^{(1)}|\boldsymbol{BOS}}P(\boldsymbol{x}^{(3)}|\boldsymbol{BOS}, \boldsymbol{x}^{(1)}, \boldsymbol{x}^{(2)}) P(\boldsymbol{x}^{(4)}|\boldsymbol{BOS}, \boldsymbol{x}^{(1)}, \boldsymbol{x}^{(2)}, \boldsymbol{x}^{(3)}) P(\boldsymbol{EOS}|\boldsymbol{BOS}, \boldsymbol{x}^{(1)}, \boldsymbol{x}^{(2)}, \boldsymbol{x}^{(3)}, \boldsymbol{x}^{(4)})} gets higher. Thus (-1) \{ log_{b}{P(\boldsymbol{BOS})} + log_{b}{P(\boldsymbol{x}^{(1)}|\boldsymbol{BOS}}) + log_{b}{P(\boldsymbol{x}^{(3)}|\boldsymbol{BOS}, \boldsymbol{x}^{(1)}, \boldsymbol{x}^{(2)})} + log_{b}{P(\boldsymbol{x}^{(4)}|\boldsymbol{BOS}, \boldsymbol{x}^{(1)}, \boldsymbol{x}^{(2)}, \boldsymbol{x}^{(3)})} + log_{b}{P(\boldsymbol{EOS}|\boldsymbol{BOS}, \boldsymbol{x}^{(1)}, \boldsymbol{x}^{(2)}, \boldsymbol{x}^{(3)}, \boldsymbol{x}^{(4)})} \} gets lower, where usually b=2 or b=e.

This is how to measure how confident language models are, and the indicator of the confidence is called perplexity. Assume that you have a data set for evaluation \mathcal{D} = (\boldsymbol{X}_1, \dots, \boldsymbol{X}_n, \dots, \boldsymbol{X}_{|\mathcal{D}|}), which is composed of |\mathcal{D}| sentences in total. Each sentence \boldsymbol{X}_n = (\boldsymbol{x}^{(0)})\prod_{t=0}^{\tau ^{(n)}}{P(\boldsymbol{x}_{n}^{(t+1)}|\boldsymbol{X}_{n, [0, t]})} has \tau^{(n)} tokens in total excluding \boldsymbol{BOS}, \boldsymbol{EOS}. And let |\mathcal{V}| be the size of the vocabulary of the language model. Then the perplexity of the language model is b^z, where z = \frac{-1}{|\mathcal{V}|}\sum_{n=1}^{|\mathcal{D}|}{\sum_{t=0}^{\tau ^{(n)}}{log_{b}P(\boldsymbol{x}_{n}^{(t+1)}|\boldsymbol{X}_{n, [0, t]})}. The b is usually 2 or e.

For example, assume that \mathcal{V} is vocabulary {“the”, “You’ve”, “Walberg”, “touch”, “power”, “Nights”, “got”, “Mark”, “Boogie”}. Also assume that the evaluation data set for perplexity of a language model is \mathcal{D} = (\boldsymbol{X}_1, \boldsymbol{X}_2), where \boldsymbol{X_1} =(\boldsymbol{You've}, \boldsymbol{got}, \boldsymbol{the}, \boldsymbol{touch}) \boldsymbol{X_2} = (\boldsymbol{You've}, \boldsymbol{got}, \boldsymbol{the }, \boldsymbol{power}). In this case |\mathcal{V}|=9, |\mathcal{D}|=2. I have already showed you how to calculate the perplexity of the sentence “You’ve got the touch.” above. You just need to do a similar thing on another sentence “You’ve got the power”, and then you can get the perplexity of the language model.

*If the network is not properly trained, it would also be confident of generating wrong outputs. However, such network still would give high perplexity because it is “confident” at any rate. I’m sorry I don’t know how to tackle the problem. Please let me put this aside, and let’s get down on Transformer model soon.

Appendix

Let’s see how word embedding is implemented with a very simple example in the official Tensorflow tutorial. It is a simple binary classification task on IMDb Dataset. The dataset is composed to comments on movies by movie critics, and you have only to classify if the commentary is positive or negative about the movie. For example when you get you get an input “To be honest, Michael Bay is a terrible as an action film maker. You cannot understand what is going on during combat scenes, and his movies rely too much on advertisements. I got a headache when Mark Walberg used a Chinese cridit card in Texas. However he is very competent when it comes to humorous scenes. He is very talented as a comedy director, and I have to admit I laughed a lot.“, the neural netowork has to judge whether the statement is positive or negative.

This networks just takes an average of input embedding vectors and regress it into a one dimensional value from 0 to 1. The shape of embedding layer is (8185, 16). Weights of neural netowrks are usually implemented as matrices, and you can see that each row of the matrix corresponds to emmbedding vector of each token.

*It is easy to imagine that this technique is problematic. This network virtually taking a mean of input embedding vectors. That could mean if the input sentence includes relatively many tokens with negative meanings, it is inclined to be classified as negative. But for example, if the sentence is “This masterpiece is a dark comedy by Charlie Chaplin which depicted stupidity of the evil tyrant gaining power in the time. It thoroughly mocked Germany in the time as an absurd group of fanatics, but such propaganda could have never been made until ‘Casablanca.'” , this can be classified as negative, because only the part “masterpiece” is positive as a token, and there are much more words with negative meanings themselves.

The official Tensorflow tutorial provides visualization of word embedding with Embedding Projector, but I would like you to take more control over the data by yourself. Please just copy and paste the codes below, installing necessary libraries. You would get a map of vocabulary used in the text classification task. It seems you cannot find clear tendency of the clusters of the tokens. You can try other dimension reduction methods to get maps of the vocabulary by for example using Scikit Learn.

import tensorflow as tf
from tensorflow import keras
from tensorflow.keras import layers
import tensorflow_datasets as tfds
tfds.disable_progress_bar()

(train_data, test_data), info = tfds.load(
    'imdb_reviews/subwords8k', 
    split = (tfds.Split.TRAIN, tfds.Split.TEST), 
    with_info=True, as_supervised=True)

train_batches = train_data.shuffle(1000).padded_batch(10)
test_batches = test_data.shuffle(1000).padded_batch(10)

embedding_dim=16

encoder = info.features['text'].encoder

model = keras.Sequential([
  layers.Embedding(encoder.vocab_size, embedding_dim),
  layers.GlobalAveragePooling1D(),
  layers.Dense(16, activation='relu'),
  layers.Dense(1)
])

print("\n\nThe size of the vocabulary generated from IMDb Dataset is " + str(encoder.vocab_size) + '\n\n')

model.summary()

model.compile(optimizer='adam',
              loss=tf.keras.losses.BinaryCrossentropy(from_logits=True),
              metrics=['accuracy'])

history = model.fit(
    train_batches,
    epochs=10,
    validation_data=test_batches, validation_steps=20)

word_embedding_vectors = model.layers[0].get_weights()[0]

print("\n\nThe shape of the trained weigths of the embedding layer is " + str(word_embedding_vectors.shape) + '\n\n')

from sklearn.manifold import TSNE
X_reduced = TSNE(n_components = 2, init='pca', random_state=0).fit_transform(word_embedding_vectors)

import numpy as np
embedding_dict = zip(encoder.subwords, np.arange(len(encoder.subwords)))
embedding_dict = dict(embedding_dict)

import matplotlib.pyplot as plt

plt.figure(figsize=(60, 45))
plt.scatter(X_reduced[:, 0], X_reduced[:, 1])

for i in range(0, len(encoder.subwords), 5):
    plt.text(X_reduced[i, 0], X_reduced[i, 1], encoder.subwords[i], fontsize=20, color='red')
plt.title("The map of vocabulary of IMDb Dataset mapped to a 2 dimensional space by t-SNE", fontsize=60)
#plt.savefig('imdb_tsne_map.png')
plt.show()


Top 10 Python Libraries Of All Time

Python is a very popular and renowned language that has replaced several programming languages in the market. Its amazing collection of libraries makes it a convenient programming language for developers.

Python is an ocean of libraries serving an ample number of purposes and as a developer; you must possess sound knowledge of the 10 libraries. One needs to familiarize themselves with the libraries to go on and work on different projects. For the data scientist, it has been a charmer now.

Here today, for you this is a curated list of 10 Python libraries that can help you along with its significant features, when to use them, and also the benefits.

10 Best Python Libraries of All Times

  1. Pandas: Pandas is an open-source library that offers instant high performance, data analysis, and simple data structures. When can you use it? It can be used for data munging and wrangling. If one is looking for quick data visuals, aggregation, manipulation, and reading, then this library is suitable. You can impute the missing data files, plot the data, and make edits in the data column. Moreover, for renaming and merging, this tool can do wonders. It is a foundation library, and a data scientist should have in-depth knowledge about Pandas before any other library knowledge.
  1. TensorFlow: TensorFlow is developed by Google in collaboration with the Brain Team. Using this tool, you can instantly visualize any part of the graphical representation. It comes with modularity and offers high flexibility in its operations. This library is ideal for running and operating in large scale systems. So, as long as you have good internet connectivity, you can use it because it is an open-source platform. What is the beauty of this library? It comes with an unending list of applications associated with it.
  1. NumPy: NumPy is the most popular Python library used by developers. It is used by various libraries for conducting easy operations. What is the beauty of NumPy? Array Interface is the beauty of NumPy and it is always a highlighted feature. NumPy is interactive and very simple to use. It can instantly solve complicated mathematical problems. With this, you need not worry about daunting phases of coding and offering open-source contributions. This interface is widely used for expressing raw streams, sound waves, and other images. If you are looking to implement this into machine learning, you must possess in-depth knowledge about NumPy.
  1. Keras: Are you looking for a cool Python library? Well, Keras is the coolest machine learning python library. It runs smoothly on both CPU and GPU. Do you want to know where Keras is used? It is used in popular applications like Uber, Swiggy, Netflix, Square, and Yelp. Keras easily supports the fully connected, pooling, convolution, and recurrent neural networks. For any innovative research, it does fine because it is expressive and flexible. Keras is completely based on a framework, which enables easy debugging and exploring. Various large scientific organizations use Keras for innovative research.
  1. Scikit- Learn: If your project deals with complex data, it has to be the Scikit- Learn python library. This Python Machine Learning Library is associated with NumPy and SciPy. After various modifications, one such feather cross-validation is used for enabling more than one metric. It is used for extracting features and data from texts and images. It uses various algorithms to make changes in machine learning. What are its functions? It is used in model selection, classification, clustering, and regression. Various training methods like nearest neighbor and logistics regressions are subjected to minimal modification.
  1. PyTorch: PyTorch is the largest library which conducts various computations and accelerations. Also, it solves complicated application issues that are related to the neural networks. It is completely based on the machine language Torch, which is a free and open-source platform. PyTorch is new but gaining huge popularity and very much a favorite among the developers. Why such popularity? It comes with a hybrid end-user which ensures easy usage and flexibility. For processing natural language applications, this library is used. Do you know what the best part is? It is outperforming and taking the popularity of Tensor Flow in recent times.
  1. MoviePy: The MoviePy is a tool that offers unending functionality related to movies and visuals. It is used for exporting, modifying, and importing various video files. Do you want to add a title to your video or rotate it 90 degrees? Well, MoviePy helps you to do all such tasks related to videos. It is not a tool for manipulating data like Pillow. In any task related to movies and videos in python coding, you can no doubt rely on the functionality of MoviePy. It is designed to conduct all the aspects of a standard task and can get it done instantly. For any common task associated with videos, it has a MoviePy library.
  1. Matplotlib: Matplotlib is no doubt a quintessential python library whose presence can never be forgotten. You can visualize data and create innovative and interesting stories. When can you use it? You can use Matplotlib for embedding different plots into the application as it provides an object-oriented application program interface. Any sort of visualization, be it bar graph, histogram, pie chart, or graphs, Matplotlib can easily depict it. With this library, you can create any type of visualization. Do you want to know what visualizations you can create? You can create a histogram, Bar graph, pie chart, area plot, stem plot, and line plot. It also facilitates the legends, grids, and labels.
  2. Tkinter: Tkinter is a library that can help you create any Python application with the help of a graphical user interface. Tkinter is the most common and easy to use python library for developing apps with GUI. It binds python to the GUI tool kit which can be used in any modern operating system. To create a python GUI, Tkinter is the only best way to start instantly.
  3. Plotly: The Plotly is an essential graph plotting python library for developers. Users can import, copy, paste, export the data that needs to be analyzed and visualized. When can you use it? You can use Plotly to display and create figures and visual images. What is interesting is that it has amazing features for sending data to the various cloud servers.

What are the visual charts prepared with Plotly? You can create line pie, bubble, dot, scatter, and pie. One can also construct financial charts, contours, maps, subplots, carpet, radar, and logs. Do you have anything in your mind which needs to be represented visually? Use Plotly!

Finishing Up

In a nutshell, you have the best python libraries of recent times which contribute hugely to development. If your favorite python library didn’t make it in this list of the top 10 best python libraries, do not take offense.
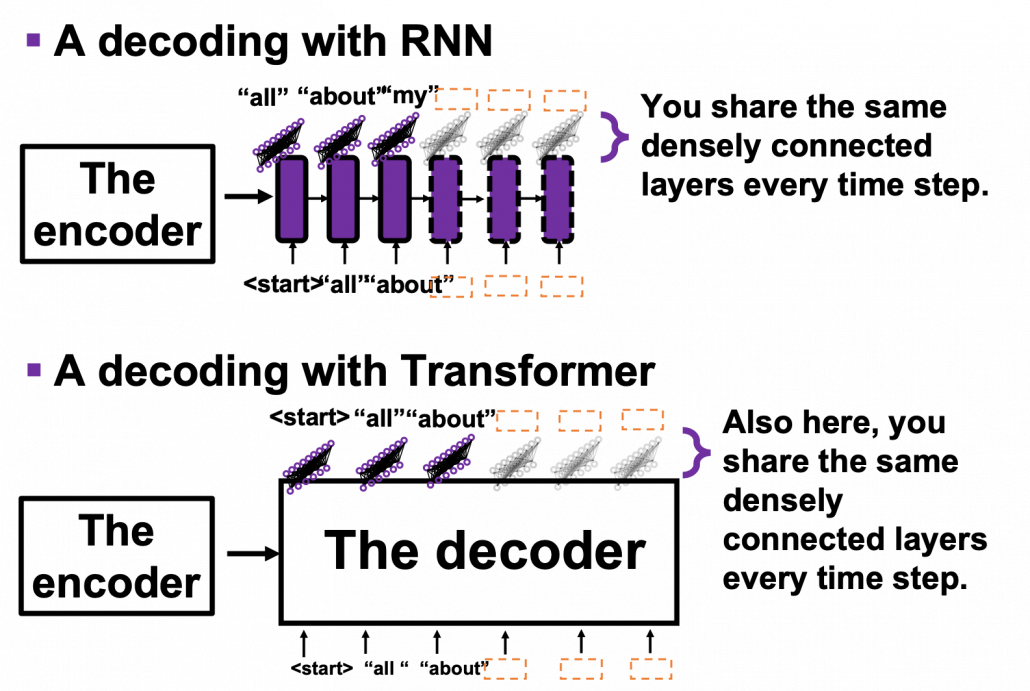
Python comes with unending library packages, and these 10 are some of its popular and best-used ones. If you are a python developer, these are the best libraries you must have in-depth knowledge of.

Article series: 5 Clean Coding Tips – 5.Put yourself in somebody else’s shoes

This is the fifth of the article series “5 tips for clean coding” to follow as soon as you’ve made the first steps into your coding career, in this article series. Read the introduction here, to find out why it is important to write clean code if you missed it.

It might be a bit repetitive to bring up how important the readability of the code is, let’s do it anyway. In the majority of the cases you are writing for others, therefore you need to put yourself in their shoes to be able to assess how good the readability of your code is. For you, it all might be obvious because you wrote it. But it doesn’t have to be easy to read for someone else. If you have a colleague or a friend that has a bit of time for you and is willing to give you feedback, that is great. If, however, you don’t have such a person, having a few imaginary friends might be helpful in this case. It might sound crazy, but don’t close this page just yet. Having a set of imaginary personas at your disposal, to review your work with their eyes, can help you a lot. Imagine that your code met one of those guys. What would they say about it? If you work in a team or collaborate with people, you probably don’t have to imagine them. You’ve met them.

The_PEP8_guy – He has years of experience. He is used to seeing the code in a very particular way. He quotes the style guide during lunch. His fingers make the perfect line splitting and indentation without even his thoughts reaching the conscious state. He knows that lowercase_with_underscore is for variables, UPPER_CASE_NAMES are for constants and the CapitalizedWords are for classes. He will be lost if you do it in any different way. His expectations will not meet what you wrote, and he will not understand anything, because he will be too distracted by the messed up visual. Depending on the character he might start either crying or shouting. Read the style guide and follow it. You might be able to please this guy at least a little bit with the automatic tools like pylint.
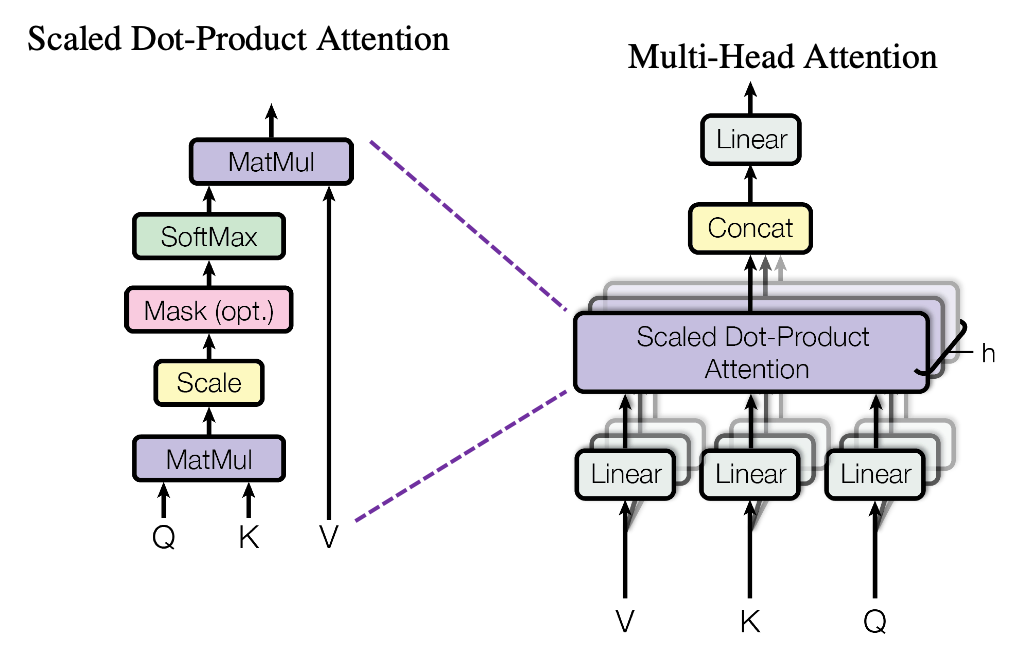
The_ grieving _widow – Imagine that something happens to you. Let’s say, that you get hit by a bus[i]. You leave behind sadness and the_ grieving_widow to manage your code, your legacy. Will the future generations be able to make use of it or were you the only one who can understand anything you wrote? That is a bit of an extreme situation, ok. Alternatively, imagine, that you go for a 5-week vacation to a silent retreat with a strict no-phone policy (or that is what you tell your colleagues). Will they be able to carry on if they cannot ask you anything about the code? Review your code and the documentation from the perspective of the poor grieving_widow.

The_not_your_domain_guy – He is from the outside of the world you are currently in and he just does not understand your jargon. He doesn’t have to know that in data science a feature, a predictor and an x probably mean the same thing. SNR might shout signal-to-noise ratio at you, it will only snort at him. You might use abbreviations that are obvious to you but not to everyone. If you think that the majority of people can understand, and it helps with the code readability keep the abbreviations but just in case, document/comment them. There might be abbreviations specific to your company and, someone from the outside, a new guy, a consultant will not get them. Put yourself in the shoes of that guy and maybe make your code a bit more democratic wherever possible.

The_foreigner– You might be working in an environment, where every single person speaks the same language you speak, and it happens not to be English. So, you and your colleagues name variables and write the comments in your language. However, unless you work in a team with rules a strict as Athletic Bilbao, there might be a foreigner joining your team in the future. It is hard to argue that English is the lingua franca in programming (and in the world), these days. So, it might be worth putting yourself in the_foreigner’s shoes, while writing your code, to avoid a huge amount of work in the future, that the translation and explanation will require. And even if you are working on your own, you might want to make your code public one day and want as many people as possible to read it.
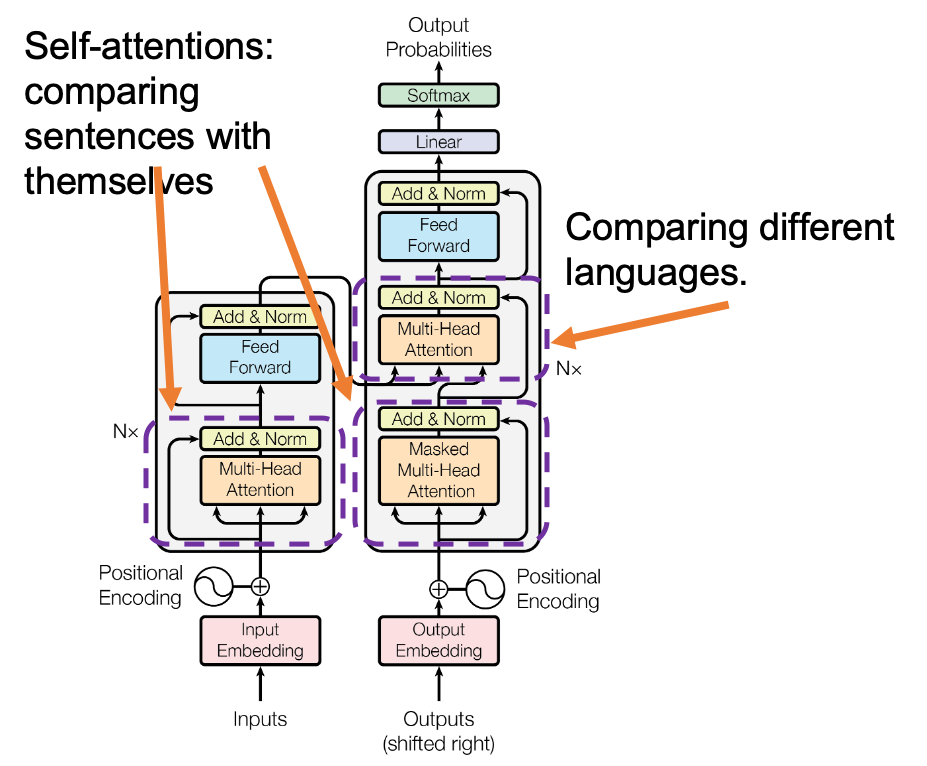
The_hurry_up_guy – we all know this guy. Sometimes he doesn’t have a body or a face, but we can feel his presence. You might want to write a perfect solution, comment it in the best possible way and maybe add a bit of glitter on top but sometimes you just need to give in and do it his way. And that’s ok too.
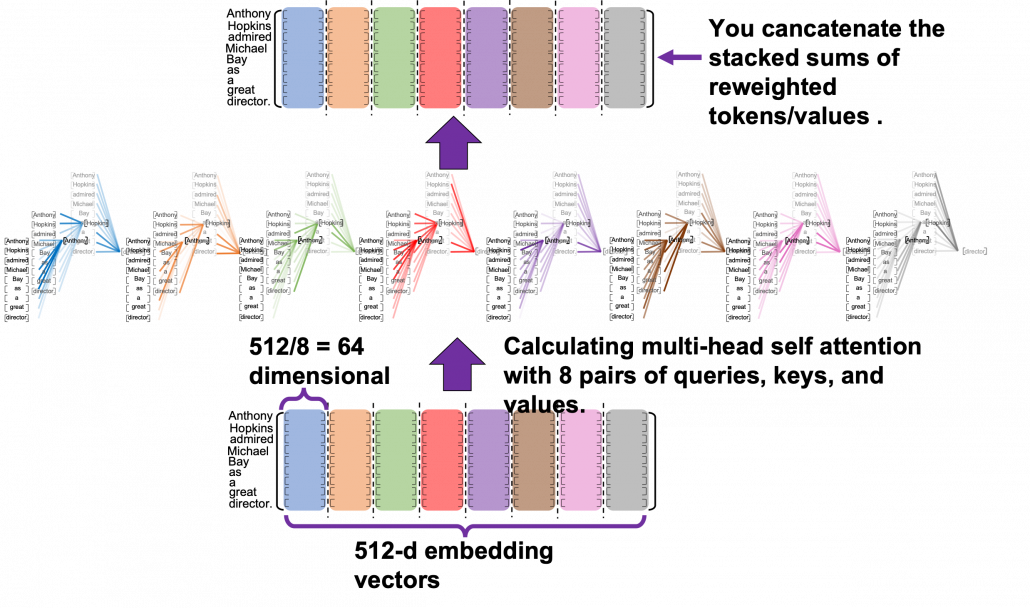
References:

[i] https://en.wikipedia.org/wiki/Bus_factor