Tag Archive for: Machine Learning

K Nearest Neighbour For Supervised Learning

K-Nearest Neighbour (KNN) Algorithms is an easy-to-implement & advanced level supervised machine learning algorithm used for both – classification as well as regression problems. However, you can see a wide of its applications in classification problems across various industries.

If you’ve been shopping a lot in e-commerce sites like Amazon, Flipkart, Myntra, or love watching web series over Netflix and Amazon Prime, one common thing you’ve always noticed, and that is recommendations.

Are you wondering how they recommend you following your choice? They use KNN Supervised Learning to find out what you may need the next when you’re buying and recommend you with a few more products.

Imagine you’re looking for an iPhone to purchase. When you scroll down a little, you see some iPhone cases, tempered glasses – saying, “People who purchased an iPhone have also purchased these items. The same applies to Netflix and Amazon Prime. When you finished a show or a series, they give you recommendations of the same genre. And do it all using KNN supervised learning and classify the items for the best user experience.

Advantages Of KNN

  • Quickest Calculation Time
  • Simple Algorithms
  • High Accuracy
  • Versatile – best use for Regression and Classification.
  • Doesn’t make any assumptions about data.

Where KNN Are Mostly Used

  • Simple Recommendation Models
  • Image Recognition Technology
  • Decision-Making Models
  • Calculating Credit Rating

Choosing The Right Value For K

 To choose the right value of K, you have to run KNN algorithms several times with different values of K and select the value of K, which reduces the number of errors you’ve come across and come out as the most stable value for K.

Your Step-By-Step Guide For Choosing The Value Of K

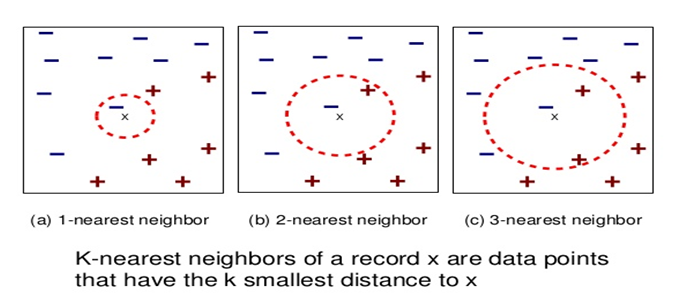
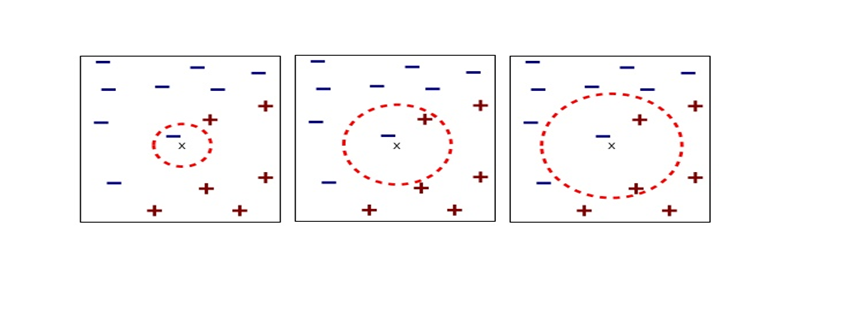
  • As you decrease the value of K to 1 (K = 1), you’ll reach a query point, where you get to see many elements from class A (-) and class B (+) where (-) is the only nearest neighbor. Reasonably, you would think about the query point to be most likely the red one. As K =1, which has a blue color, KNN incorrectly predicts the wrong color blue.
  • As you increase the value of K to 2 (K=2), you get to see two elements, (-) and (+) are the only nearest neighbor. As you have two values, which are of Class A and Class B, KNN incorrectly predicts the wrong values (Blue and Red).
  • As you increase the value of K to 3 (K=3), you get to see three elements (-) and (+), (+) are the only nearest neighbor. And this time, you got three values, one from blue and two from red. As your assumption is red, KNN correctly predicts the right value (Blue and Red, Red). Your answer is more stable this time compared to previous ones.

Conclusion

KNN works by finding the nearest distance between a query and all the elements in the database. By choosing the value for K, we get the closest to the query. And then, KNN algorithms look for the most frequent labels in classification and averages of labels in regression.

Spiky cubes, Pac-Man walking, empty M&M’s chocolate: curse of dimensionality

This is the first article of the article series Illustrative introductions on dimension reduction.

“Curse of dimensionality” means the difficulties of machine learning which arise when the dimension of data is higher. In short if the data have too many features like “weight,” “height,” “width,” “strength,” “temperature”…., that can undermine the performances of machine learning. The fact might be contrary to your image which you get from the terms “big” data or “deep” learning. You might assume that the more hints you have, the better the performances of machine learning are. There are some reasons for curse of dimensionality, and in this article I am going to introduce two major reasons below.

  1. High dimensional data usually have rich expressiveness, but usually training data are too poor for that.
  2. The behaviors of data points in high dimensional space are totally different from our common sense.

Through these topics, you will see that you always have to think about which features to use considering the number of data points.

*From now on I am going to talk about only Euclidean distance. If you are not sure what Euclidean distance means, please just keep it in mind that it is the type of distance most people wold have learnt in normal compulsory education.

1. Number of samples and degree of dimension

The most straightforward demerit of adding many features, or increasing dimensions of data, is the growth of computational costs. More importantly, however, you always have to think about the degree of dimensions in relation of the number of data points you have. Let me take a simple example in a book “Pattern Recognition and Machine Learning” by C. M. Bishop (PRML). This is an example of measurements of a pipeline. The figure below shows a comparison plot of 3 classes (red, green and blue), with parameter x_7 plotted against parameter x_6 out of 12 parameters.

* The meaning of data is not important in this article. If you are interested please refer to the appendix in PRML.

Assume that we are interested in classifying the cross in black into one of the three classes. One of the most naive ideas of this classification is dividing the graph into grids and labeling each grid depending on the number of samples in the classes (which are colored at the right side of the figure). And you can classify the test sample, the cross in black, into the class of the grid where the test sample is in. Thereby the cross is classified to the class in red.
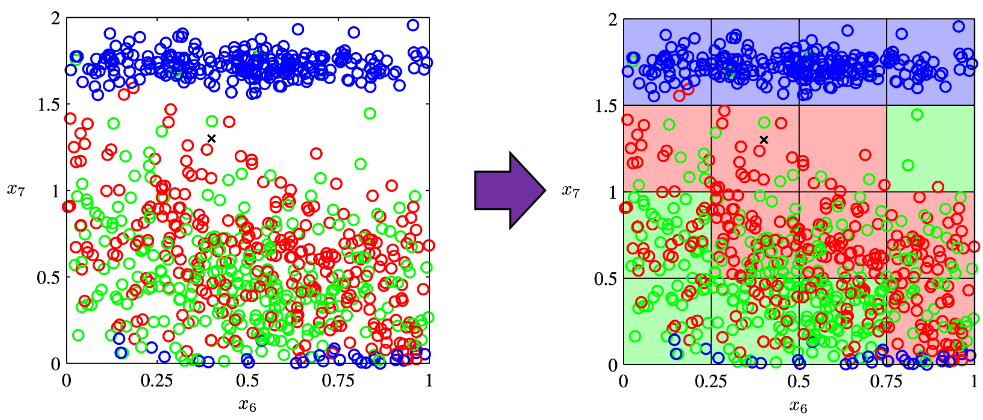
Source: C.M. Bishop, “Pattern Recognition and Machine Learning,” (2006), Springer, pp. 34-35

As I mentioned in the figure above, we used only two features out of 12 features in total. When the total number of data points is fixed and you add remaining ten axes/features one after another, what would happen? Let’s see what “adding axes/features” means. If you are talking about 1, 2, or 3 dimensional grids, you can visualize them. And as you can see from the figure below, if you make each 10^1, 10^2, 100^3 grids respectively in 1, 2, 3 dimensional spaces, the number of the small regions in the grids are respectively 10, 100, 1000. Even though you cannot visualize it anymore, you can make grids for more than 3 dimensional data. If you continue increasing the degree of dimension, the number of grids increases exponentially, and that can soon surpass the number of training data points. That means there would be a lot of empty spaces in such high dimensional grids. And the classifying method above: coloring each grid and classifying unknown samples depending on the colors of the grids, does not work out anymore because there would be a lot of empty grids.

* If you are still puzzled by the idea of “more than 3 dimensional grids,” you should not think too much about that now. It is enough if you can get some understandings on high dimensional data after reading the whole article of this.
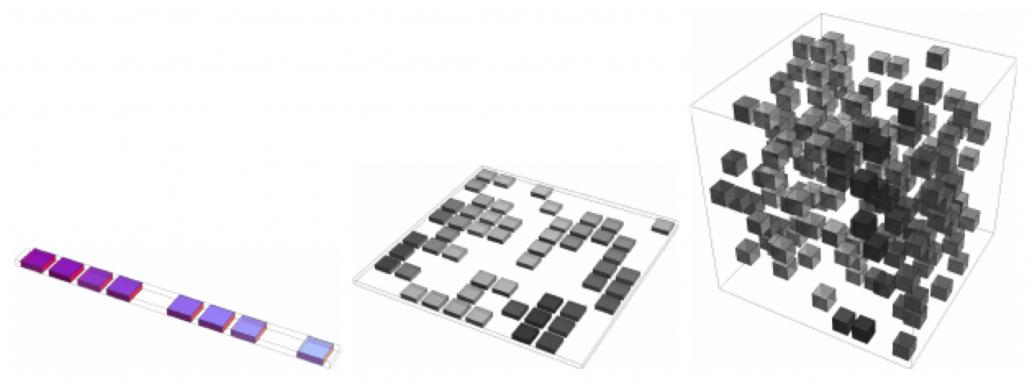
Source: Goodfellow and Yoshua Bengio and Aaron Courville, Deep Learning, (2016), MIT Press, p. 153

I said the method above is the most naive way, but other classical classification methods , for example k-nearest neighbors algorithm, are more or less base on a similar idea. Many of classical machine learning algorithms are based on the idea of smoothness prior, or local constancy prior. In short in classical ways, you  do not expect data to change so much in a small region, so you can expect unknown samples to be similar to data in vicinity. But that soon turns out to be problematic when the dimension of data is bigger because training data would be sparse because the area of multidimensional space grows exponentially as I mentioned above. And sometimes you would not be able to find training data around test data. Plus, in high dimensional data, you cannot treat distance in the same as you do in lower dimensional space. The ideas of “close,” “nearby,” or “vicinity” get more obscure in high dimensional data. That point is related to the next topic: the intuition have cultivated in normal life is not applicable to higher dimensional data.

2. Bizarre characteristics of high dimensional data

We form our sense of recognition in 3-dimensional ways in our normal life. Even though we can visualize only 1, 2, or 3 dimensional data, we can actually generalize the ideas in 1, 2, or 3 dimensional ideas to higher dimensions. For example 4 dimensional cubes, 100 dimensional spheres, or orthogonality in 255 dimensional space. Again, you cannot exactly visualize those ideas, and for many people, such high dimensional phenomenon are just imaginary matters on blackboards. Those high dimensional ideas are designed to retain some conditions just as well as 1, 2, or 3 dimensional space. Let’s take an example of spheres in several dimensional spaces. General spheres in any D-dimensional space can be defined as a set of any \boldsymbol{x}, such that |\boldsymbol{x} - \boldsymbol{c}| = r, where \boldsymbol{c} is the center point and r is length of radius. When \boldsymbol{x} is 2-dimensional, the spheres are called “circles.” When \boldsymbol{x} is 3-dimensional, the spheres are called “spheres” in our normal life, unless it is used in a conversation in a college cafeteria, by some students in mathematics department. And when \boldsymbol{x} is D-dimensional, they are called D-ball, and again, this is just a imaginary phenomenon on blackboard.

* Vectors and points are almost the same because all the vectors are denoted as “arrows” from the an origin point to sample data points.  The only difference is that when you use vectors, you have to consider their directions.

* “D-ball” is usually called “n-ball,” and in such context it is a sphere in a n-dimensional space. But please let me use the term “D-ball” in this article.
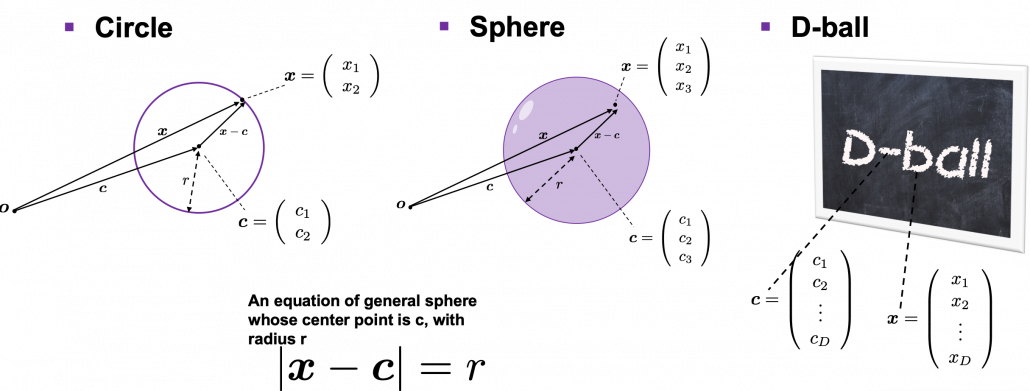
Not only spheres, but only many other ideas have been generalized to D-dimensional space, and many of them are indispensable also for data science. But there is one severe problem: the behaviors of data in high dimensional field is quite different from those in two or three dimensional space. To be concrete, in high dimensional field, cubes are spiky, you have to move like Pac-Man, and M & M’s Chocolate looks empty inside but tastes normal.

2.1: spiky cubes
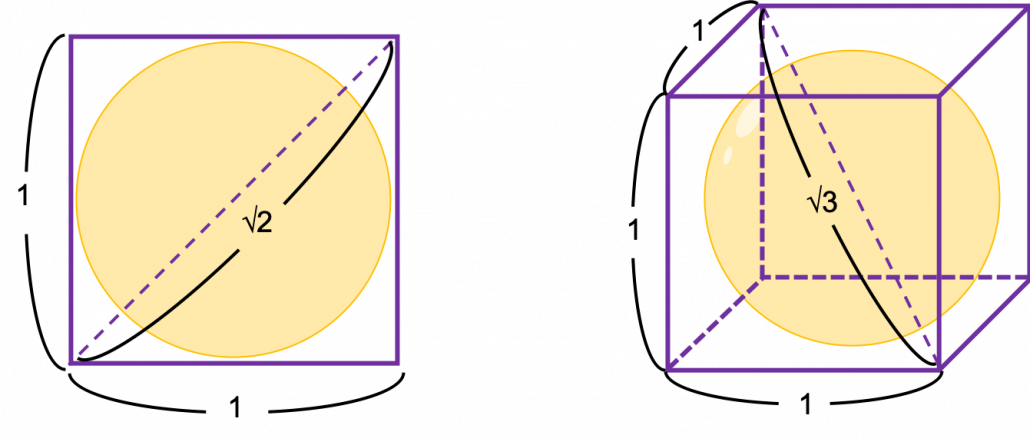
Let’s take a look at an elementary-school-level example of geometry first. Assume that you have several unit squares or unit cubes like below. In each of them a circle or sphere with diameter 1 is inscribed. The length of a diagonal line in each square is \sqrt{2}, and that in each cube is \sqrt{3}.

If you stack the squares or cubes as below, what are the length of diameters of the blue circle or sphere, circumscribing all the 4 orange circles or the 8 orange spheres?
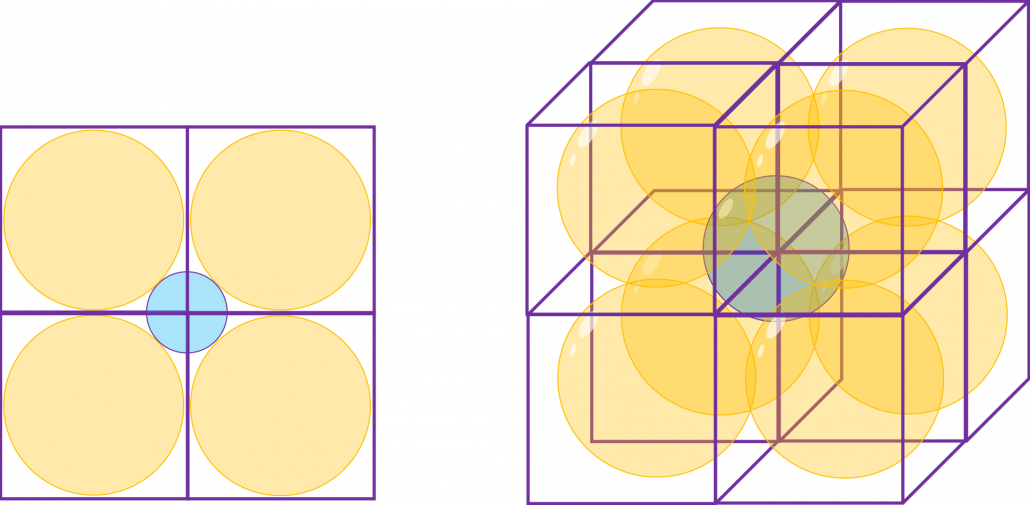
The answers are, the diameter of the blue circle is \sqrt{2} - 1, and the diameter of the blue sphere is \sqrt{3} - 1.

Next let’s think about the same situation in higher dimensional space. Assume that there are some unit D-dimensional hypercubes stacked, in each of which a D-ball with diameter 1 is inscribed, touching all the surfaces inside. Then what is the length of the diameter of  a D-ball circumscribing all the unit D-ball in the hypercubes ? Given the results above, it ca be predicted that its diameter is \sqrt{D}  -1. If that is true, there is one strange point: \sqrt{D} - 1 can soon surpass 2: that means in the chart above the blue sphere will stick out of the stacked cubes. That sounds like a paradox, but with one hypothesis, the phenomenon makes sense: cubes become more spiky as the degree of dimension grows. This hypothesis is a natural deduction because diagonal lines of hyper cubes get longer, and the the center of each surface of hypercubes still touches the unit D-ball with diameter 1, inscribing inscribing inside each unit hypercube.
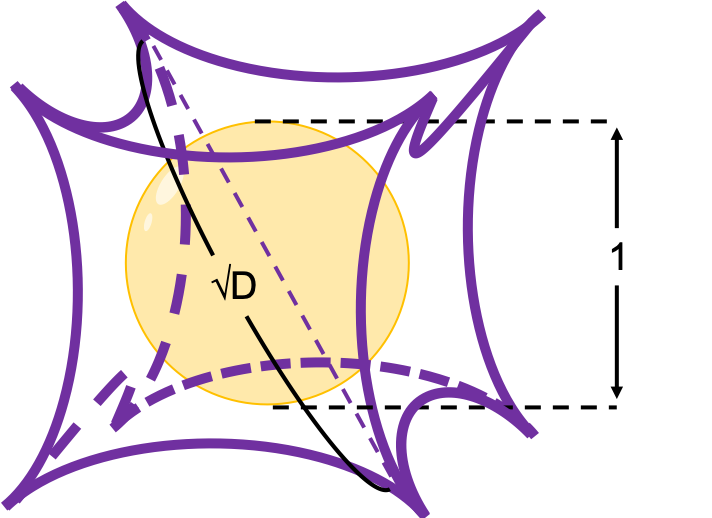
If you stack 4 hypercubes, the blue sphere circumscribing them will not stick out of the stacked hypercubes anymore like the figure below.

*Of course you cannot visualize what is going on in D-dimensional space, so the figure below is just a pseudo simulation of D-dimensional space in our 3-dimensional sense. I guess you have to stack more than four hyper cubes in higher dimensional data, but you cannot easily imagine what will go on in such space anymore.
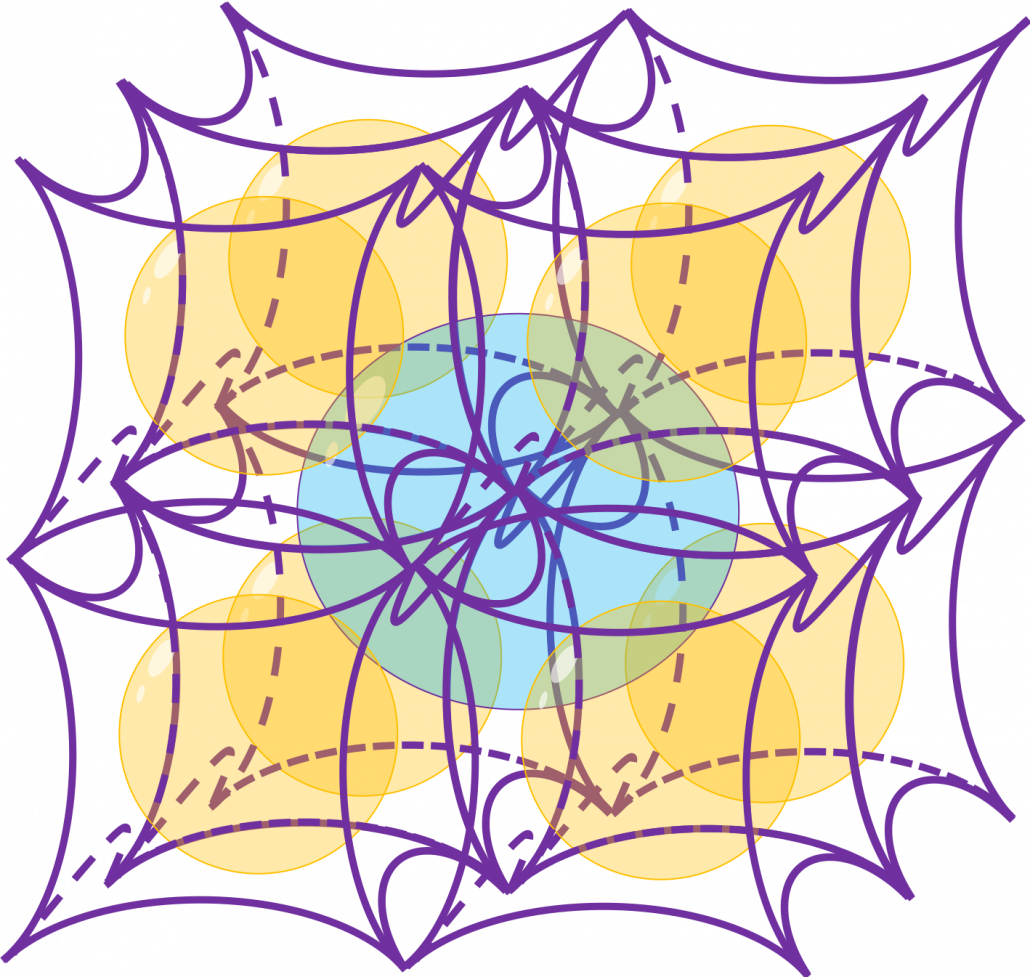
 

*You can confirm the fact that hypercube gets more spiky as the degree of dimension growth, by comparing the volume of the hypercube and the volume of the D-ball inscribed inside the hypercube. Thereby you can prove that the volume of hypercube concentrates on the corners of the hypercube. Plus, as I mentioned the longest diagonal distance of hypercube gets longer as dimension degree increases. That is why hypercube is said to be spiky. For mathematical proof, please check the Exercise 1.19 of PRML.

2.2: Pac-Man walking

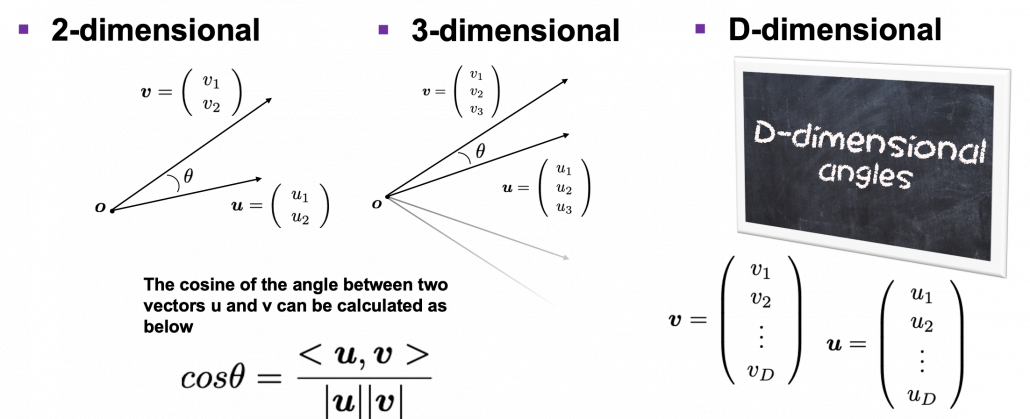
Next intriguing phenomenon in high dimensional field is that most of pairs of vectors in high dimensional space are orthogonal. In other words, if you select two random vectors in high dimensional space, the angle between them are mostly close to 90^\circ. Let’s see the general meaning of angle between two vectors in any dimensional spaces. Assume that the angle between two vectors \boldsymbol{u}, and \boldsymbol{v} is \theta, then cos\theta is calculated as cos\theta = \frac{<\boldsymbol{u}, \boldsymbol{v}>}{|\boldsymbol{u}||\boldsymbol{v}|}. In 1, 2, or 3 dimensional space, you can actually see the angle, but again you can define higher dimensional angle, which you cannot visualize anymore. And angles are sometimes used as similarity of two vectors.

* <\boldsymbol{u}, \boldsymbol{v}> is the inner product of \boldsymbol{u}, and \boldsymbol{v}.

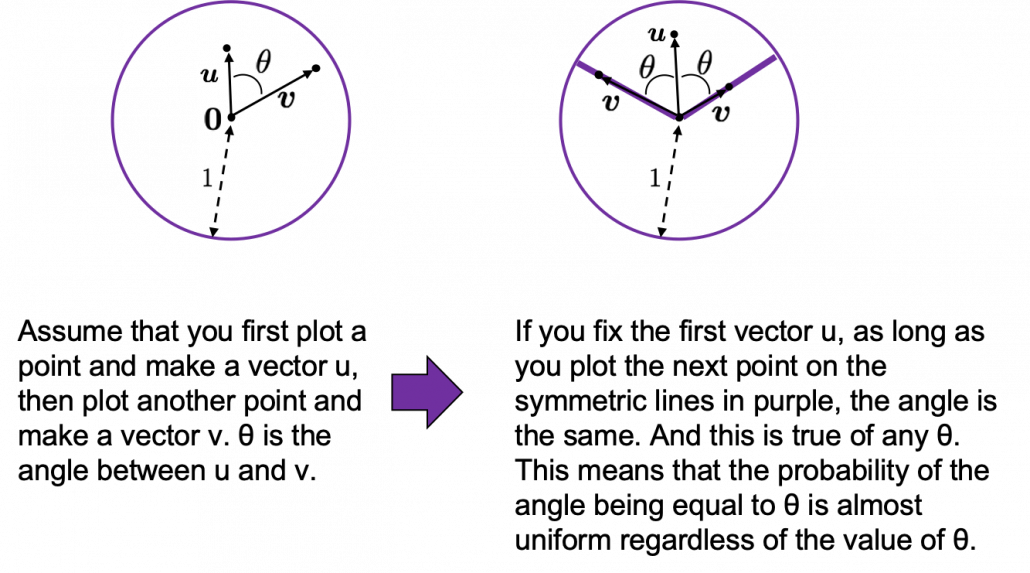
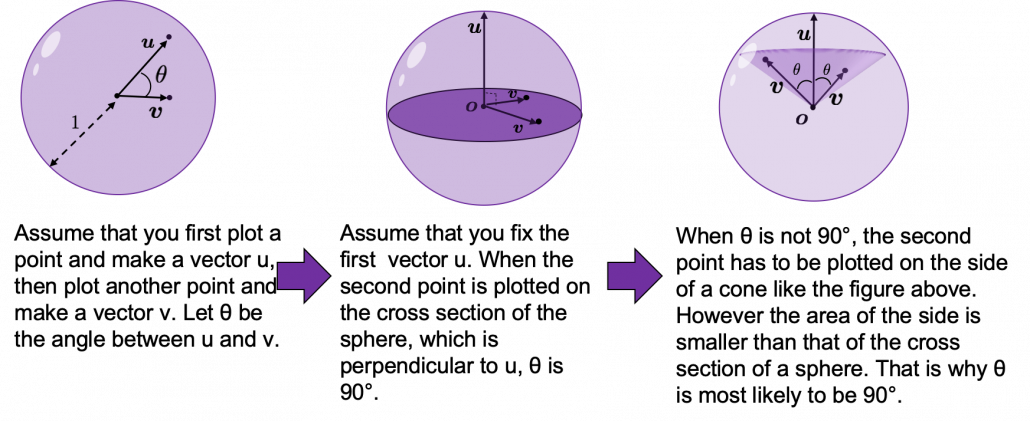
Assume that you generate a pair of two points inside a D-dimensional unit sphere and make two vectors \boldsymbol{u}, and \boldsymbol{v} by connecting the origin point and those two points respectively. When D is 2, I mean spheres are circles in this case, any \theta are equally generated as in the chart below. The fact might be the same as your intuition.   How about in 3-dimensional space? In fact the distribution of \theta is not uniform. \theta = 90^\circ is the most likely to be generated. As I explain in the figure below, if you compare the area of cross section of a hemisphere and the area of a cone whose vertex is the center point of the sphere, you can see why.
I generated 10000 random pairs of points in side a D-dimensional unit sphere, and calculated the angle between them. In other words I just randomly generated two D-dimensional vectors \boldsymbol{u} and \boldsymbol{v}, whose elements are randomly generated values between -1 and 1, and calculated the angle between them, repeating this process 10000 times. The chart below are the histograms of angle between pairs of generated vectors in respectively 2, 3, 50, and 100 dimensional space.
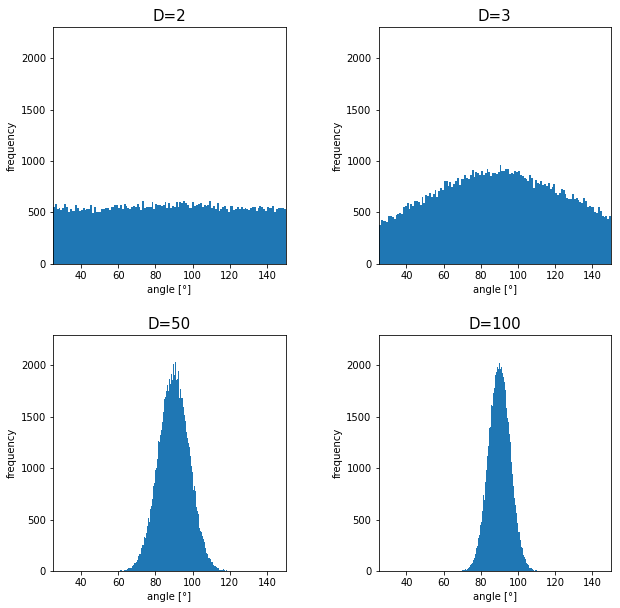
As I explained above, in 2-dimensional space, the distribution of \theta is almost uniform. However the distribution concentrates a little around 90^\circ in 3-dimensional space. You can see that the bigger the degree of dimension is, the more the angles of generated vectors concentrate around 90^\circ. That means most pairs of vectors in high dimensional space are close to orthogonal. Movements are also sequence of vectors, so when most pairs of movement vectors are orthogonal, that means you can only move like Pac-Man in such space.

Source: https://edition.cnn.com/style/article/pac-man-40-anniversary-history/index.html

* Of course I am talking about arcade Mac-Man game. Not Pac-Man in Super Smash Bros.  Retro RPG video games might have more similar playability, but in high dimensional space it is also difficult to turn back. At any rate, I think you have understood it is even difficult to move smoothly in high dimensional space, just like the first notorious Resident Evil on the first PS console also had terrible playability .

2.3: empty M & M’s chocolate

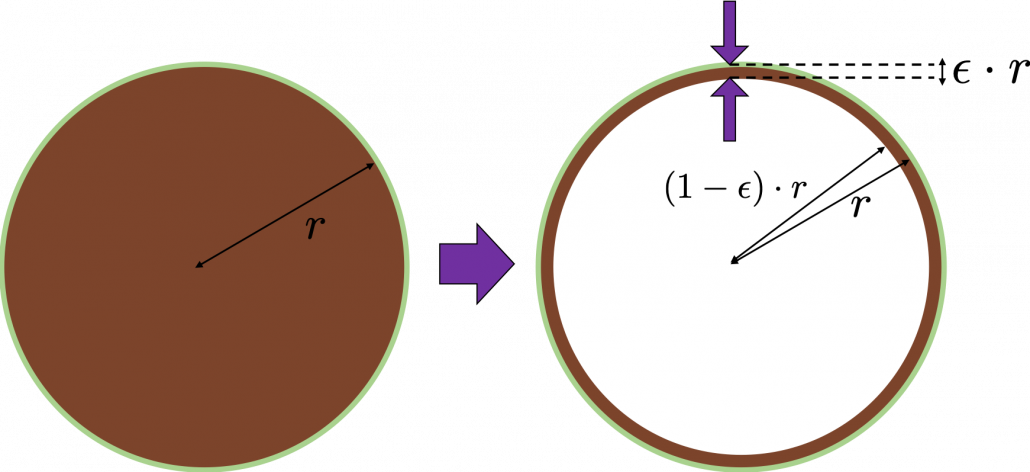
Let’s think about the proportion of the volume of the outermost \epsilon surface of general spheres with radius r. First, in 2 two dimensional space, spheres are circles. The area of the brown part of the circle below is \pi r^2. In order calculate the are of \epsilon \cdot r thick surface of the circle, you have only to subtract the area of \pi \{ (1 - \epsilon)\cdot r\} ^2. When \epsilon = 0.01, the area of outer most surface is \pi r^2 - \pi (0.99\cdot r)^2, and its proportion to the area of the whole circle is \frac{\pi r^2 - \pi (0.99\cdot r)^2}{\pi r^2} = 0.0199.

In case of 3-dimensional space, the value of a sphere with radius r is \frac{4}{3} \pi r^2, so the proportion of the \epsilon surface is calculated in the same way: \frac{\frac{4}{3} \pi r^3 -\frac{4}{3} \pi (0.99\cdot r)^2}{\frac{4}{3}\pi r^2} = 0.0297. Compared to the case in 2 dimensional space, the proportion is a little bigger.
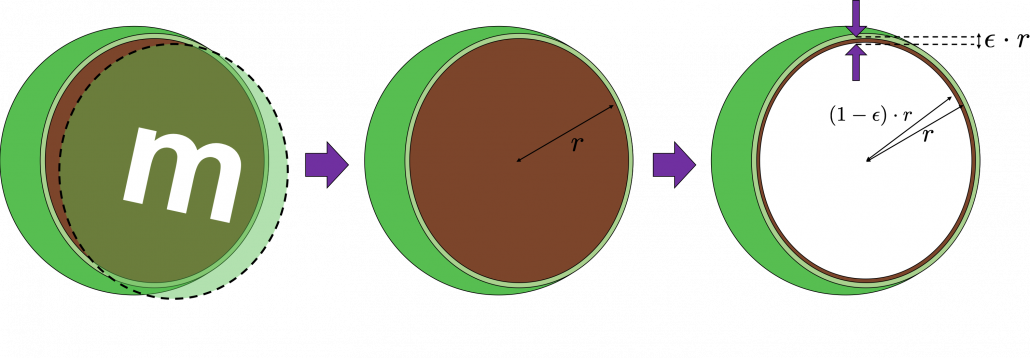
How about in D-dimensional space? We have seen that even in  D-dimensional space the surface of a sphere, I mean D-ball, can be defined as a set of any points whose distance from the center point is all r. And it is known that the volume of D-ball is defined as below.

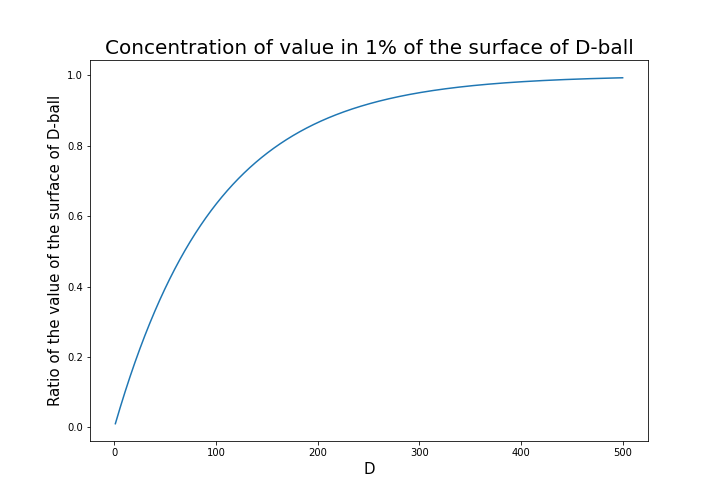
\Gamma () is called gamma function, but in this article it is not so important. The most important point now is, if you discuss any D-ball, their volume only depends on their radius r. That meas the proportion of outer \epsilon surface of D-ball is calculated as \frac{\pi r^2 - \pi \{ (1 - \epsilon)\cdot r\} ^2}{\pi r^2}. When \epsilon is 0.01, the proportion of the 1% surface of D-ball changes like in the chart below.

* And of course when D is 2,  \frac{\pi ^{(\frac{D}{2})}}{\Gamma (\frac{D}{2} + 1)} = \pi, and when D is 3 ,  \frac{\pi ^{(\frac{D}{2})}}{\Gamma (\frac{D}{2} + 1)} = \frac{4}{3} \pi

You can see that when D is over 400, around 90% of volume is concentrated in the very thin 1% surface of D-ball. That is why, in high dimensional space, M & M’s chocolate look empty but tastes normal: all the chocolate are concentrated beneath the sugar coating.

More interestingly, even if you choose any points as a central point of a sphere with radius r, the other points are squashed to the surface of the sphere, even if all the data points are uniformly distributed. This situation is problematic for classical machine learning algorithms, which are often based on the Euclidean distances between pairs of two sample data points: if you go from the central point to another sample point, the possibility of finding the point within (1 - \epsilon)\cdot r radius of the center is almost zero. But if you reach the outermost \epsilon part of the surface of the sphere, most data points are there. However, for one of the data points in the surface, any other data points are distant in the same way.

Inside M & M’s chocolate is a mysterious world.

Source: https://hipwallpaper.com/mms-wallpapers/

You have seen that using high dimensional data can be problematic in many ways. Data science and machine learning are largely based on one idea: you can find a lower dimensional meaningful and easier structure in data. In the next articles I am going to introduce some famous dimension reduction algorithms. And hopefully I would like to give some deeper insights in to these algorithms, in straightforward ways.

* I could not explain the relationships of variance and bias of data. This is also a very important factor when you think about dimensionality of data. I hope I can write about this topic someday. You can also look it up if you are interested.

* I make study materials on machine learning, sponsored by DATANOMIQ. I do my best to make my content as straightforward but as precise as possible. I include all of my reference sources. If you notice any mistakes in my materials, including grammatical errors, please let me know (email: yasuto.tamura@datanomiq.de). And if you have any advice for making my materials more understandable to learners, I would appreciate hearing it.

Illustrative introductions on dimension reduction

“What is your image on dimensions?”

….That might be a cheesy question to ask to reader of Data Science Blog, but most people, with no scientific background, would answer “One dimension is a line, and two dimension is a plain, and we live in three-dimensional world.” After that if you ask “How about the fourth dimension?” many people would answer “Time?”

You can find books or writings about dimensions in various field. And you can use the word “dimension” in normal conversations, in many contexts.

*In Japanese, if you say “He likes two dimension.” that means he prefers anime characters to real women, as is often the case with Japanese computer science students.

The meanings of “dimensions” depend on the context, but in data science dimension is usually the number of rows of your Excel data.

When you study data science or machine learning, usually you should start with understanding the algorithms with 2 or 3 dimensional data, and you can apply those ideas to any D dimensional data. But of course you cannot visualize D dimensional data anymore, and you always have to be careful of what happens if you expand degree of dimension.

Conversely it is also important to reduce dimension to understand abstract high dimensional stuff in 2 or 3 dimensional space, which are close to our everyday sense. That means dimension reduction is one powerful way of data visualization.

In this blog series I am going to explain meanings of dimension itself in machine learning context and algorithms for dimension reductions, such as PCA, LDA, and t-SNE, with 2 or 3 dimensional visible data. Along with that, I am going to delve into the meaning of calculations so that you can understand them in more like everyday-life sense.

This article series is going to be roughly divided into the contents below.

  1. Curse of Dimensionality
  2. PCA, LDA (to be published soon)
  3. Rethinking eigen vectors (to be published soon)
  4. KL expansion and subspace method (to be published soon)
  5. Autoencoder as dimension reduction (to be published soon)
  6. t-SNE (to be published soon)

I hope you could see that reducing dimension is one of the fundamental approaches in data science or machine learning.

Simple RNN

Understanding LSTM forward propagation in two ways

*This article is only for the sake of understanding the equations in the second page of the paper named “LSTM: A Search Space Odyssey”. If you have no trouble understanding the equations of LSTM forward propagation, I recommend you to skip this article and go the the next article.

1. Preface

I  heard that in Western culture, smart people write textbooks so that other normal people can understand difficult stuff, and that is why textbooks in Western countries tend to be bulky, but also they are not so difficult as they look. On the other hand in Asian culture, smart people write puzzling texts on esoteric topics, and normal people have to struggle to understand what noble people wanted to say. Publishers also require the authors to keep the texts as short as possible, so even though the textbooks are thin, usually students have to repeat reading the textbooks several times because usually they are too abstract.

Both styles have cons and pros, and usually I prefer Japanese textbooks because they are concise, and sometimes it is annoying to read Western style long texts with concrete straightforward examples to reach one conclusion. But a problem is that when it comes to explaining LSTM, almost all the text books are like Asian style ones. Every study material seems to skip the proper steps necessary for “normal people” to understand its algorithms. But after actually making concrete slides on mathematics on LSTM, I understood why: if you write down all the equations on LSTM forward/back propagation, that is going to be massive, and actually I had to make 100-page PowerPoint animated slides to make it understandable to people like me.

I already had a feeling that “Does it help to understand only LSTM with this precision? I should do more practical codings.” For example François Chollet, the developer of Keras, in his book, said as below.


For me that sounds like “We have already implemented RNNs for you, so just shut up and use Tensorflow/Keras.” Indeed, I have never cared about the architecture of my Mac Book Air, but I just use it every day, so I think he is to the point. To make matters worse, for me, a promising algorithm called Transformer seems to be replacing the position of LSTM in natural language processing. But in this article series and in my PowerPoint slides, I tried to explain as much as possible, contrary to his advice.

But I think, or rather hope,  it is still meaningful to understand this 23-year-old algorithm, which is as old as me. I think LSTM did build a generation of algorithms for sequence data, and actually Sepp Hochreiter, the inventor of LSTM, has received Neural Network Pioneer Award 2021 for his work.

I hope those who study sequence data processing in the future would come to this article series, and study basics of RNN just as I also study classical machine learning algorithms.

 *In this article “Densely Connected Layers” is written as “DCL,” and “Convolutional Neural Network” as “CNN.”

2. Why LSTM?

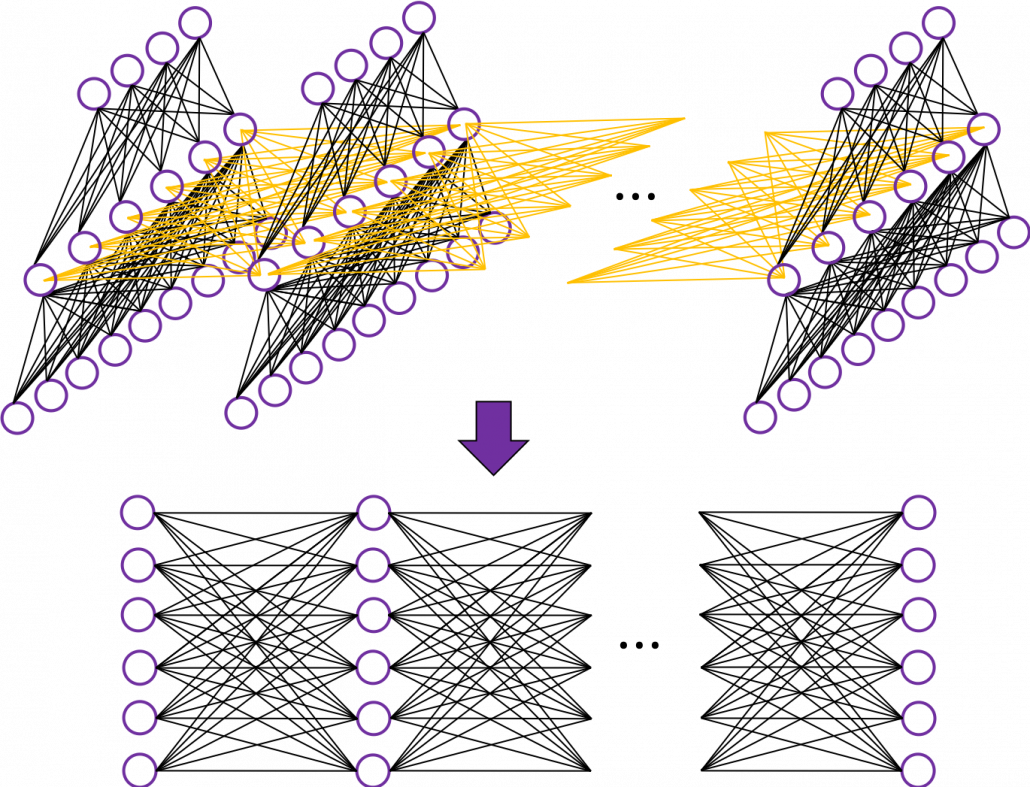
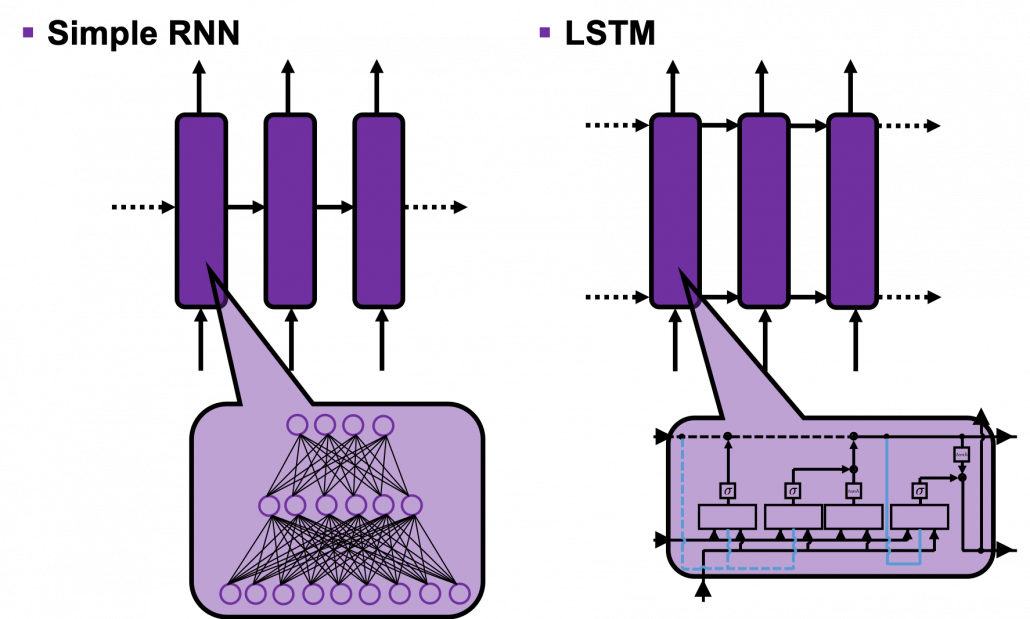
First of all, let’s take a brief look at what I said about the structures of RNNs,  in the first and the second article. A simple RNN is basically densely connected network with a few layers. But the RNN gets an input every time step, and it gives out an output at the time step. Part of information in the middle layer are succeeded to the next time step, and in the next time step, the RNN also gets an input and gives out an output. Therefore, virtually a simple RNN behaves almost the same way as densely connected layers with many layers during forward/back propagation if you focus on its recurrent connections.

That is why simple RNNs suffer from vanishing/exploding gradient problems, where the information exponentially vanishes or explodes when its gradients are multiplied many times through many layers during back propagation. To be exact, I think you need to consider this problem precisely like you can see in this paper. But for now, please at least keep it in mind that when you calculate a gradient of an error function with respect to parameters of simple neural networks, you have to multiply parameters many times like below, and this type of calculation usually leads to vanishing/exploding gradient problem.

LSTM was invented as a way to tackle such problems as I mentioned in the last article.

3. How to display LSTM

I would like you to just go to image search on Google, Bing, or Yahoo!, and type in “LSTM.” I think you will find many figures, but basically LSTM charts are roughly classified into two types: in this article I call them “Space Odyssey type” and “electronic circuit type”, and in conclusion, I highly recommend you to understand LSTM as the “electronic circuit type.”

*I just randomly came up with the terms “Space Odyssey type” and “electronic circuit type” because the former one is used in the paper I mentioned, and the latter one looks like an electronic circuit to me. You do not have to take how I call them seriously.

However, not that all the well-made explanations on LSTM use the “electronic circuit type,” and I am sure you sometimes have to understand LSTM as the “space odyssey type.” And the paper “LSTM: A Search Space Odyssey,” which I learned a lot about LSTM from,  also adopts the “Space Odyssey type.”

LSTM architectur visualization

The main reason why I recommend the “electronic circuit type” is that its behaviors look closer to that of simple RNNs, which you would have seen if you read my former articles.

*Behaviors of both of them look different, but of course they are doing the same things.

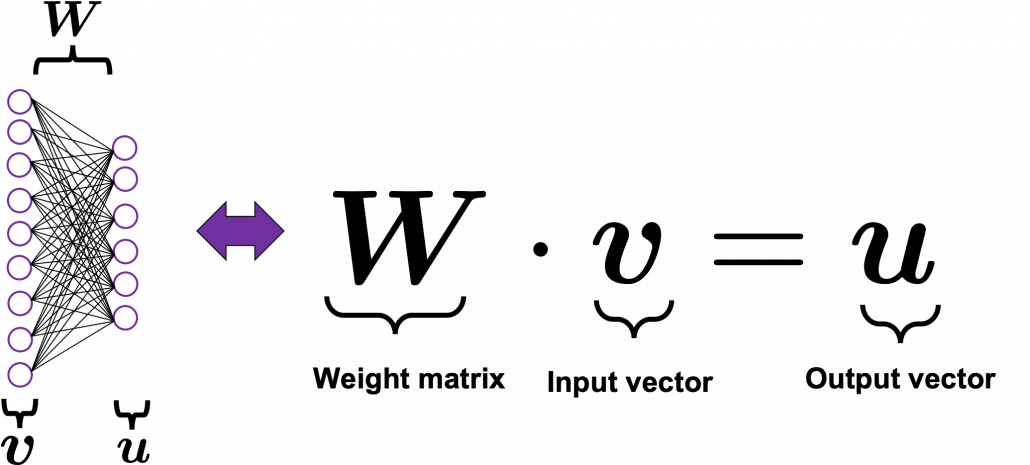
If you have some understanding on DCL, I think it was not so hard to understand how simple RNNs work because simple RNNs  are mainly composed of linear connections of neurons and weights, whose structures are the same almost everywhere. And basically they had only straightforward linear connections as you can see below.

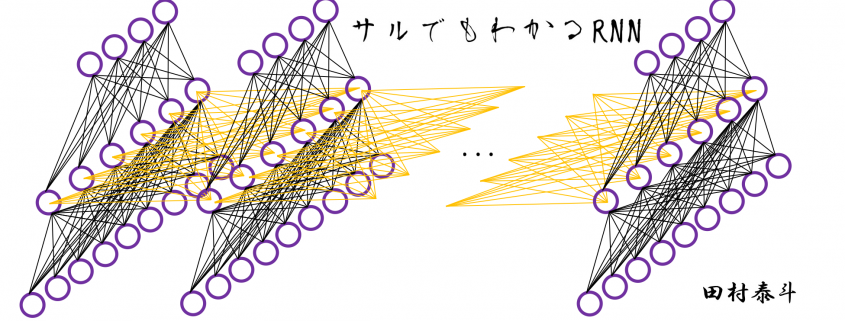
But from now on, I would like you to give up the ideas that LSTM is composed of connections of neurons like the head image of this article series. If you do that, I think that would be chaotic and I do not want to make a figure of it on Power Point. In short, sooner or later you have to understand equations of LSTM.

4. Forward propagation of LSTM in “electronic circuit type”

*For further understanding of mathematics of LSTM forward/back propagation, I recommend you to download my slides.

The behaviors of an LSTM block is quite similar to that of a simple RNN block: an RNN block gets an input every time step and gets information from the RNN block of the last time step, via recurrent connections. And the block succeeds information to the next block.

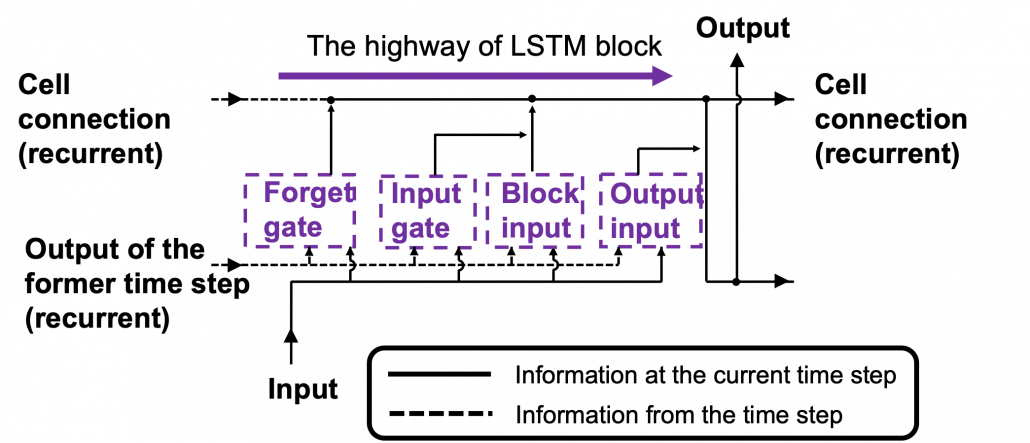
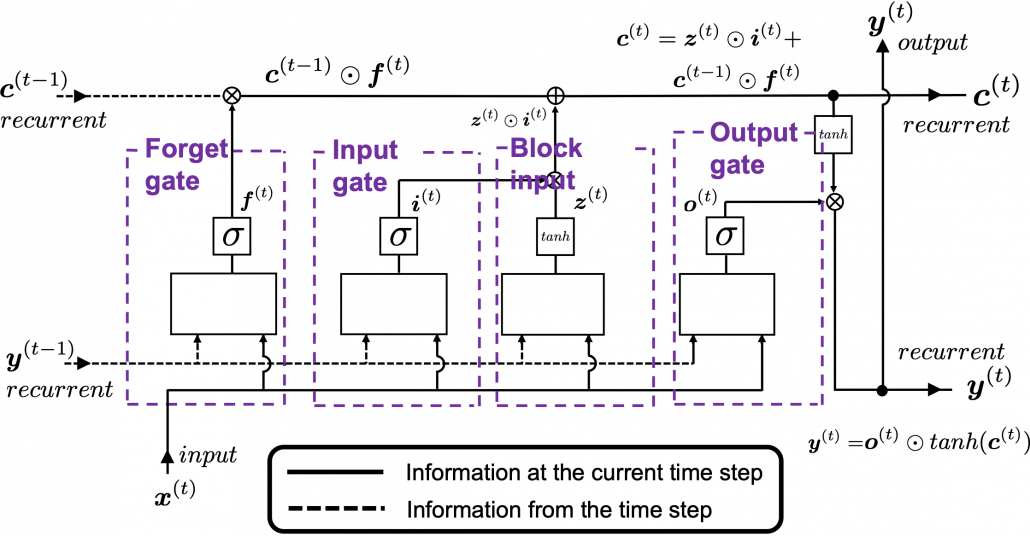
Let’s look at the simplified architecture of  an LSTM block. First of all, you should keep it in mind that LSTM have two streams of information: the one going through all the gates, and the one going through cell connections, the “highway” of LSTM block. For simplicity, we will see the architecture of an LSTM block without peephole connections, the lines in blue. The flow of information through cell connections is relatively uninterrupted. This helps LSTMs to retain information for a long time.

In a LSTM block, the input and the output of the former time step separately go through sections named “gates”: input gate, forget gate, output gate, and block input. The outputs of the forget gate, the input gate, and the block input join the highway of cell connections to renew the value of the cell.

*The small two dots on the cell connections are the “on-ramp” of cell conection highway.

*You would see the terms “input gate,” “forget gate,” “output gate” almost everywhere, but how to call the “block gate” depends on textbooks.

Let’s look at the structure of an LSTM block a bit more concretely. An LSTM block at the time step (t) gets \boldsymbol{y}^{(t-1)}, the output at the last time step,  and \boldsymbol{c}^{(t-1)}, the information of the cell at the time step (t-1), via recurrent connections. The block at time step (t) gets the input \boldsymbol{x}^{(t)}, and it separately goes through each gate, together with \boldsymbol{y}^{(t-1)}. After some calculations and activation, each gate gives out an output. The outputs of the forget gate, the input gate, the block input, and the output gate are respectively \boldsymbol{f}^{(t)}, \boldsymbol{i}^{(t)}, \boldsymbol{z}^{(t)}, \boldsymbol{o}^{(t)}. The outputs of the gates are mixed with \boldsymbol{c}^{(t-1)} and the LSTM block gives out an output \boldsymbol{y}^{(t)}, and gives \boldsymbol{y}^{(t)} and \boldsymbol{c}^{(t)} to the next LSTM block via recurrent connections.

You calculate \boldsymbol{f}^{(t)}, \boldsymbol{i}^{(t)}, \boldsymbol{z}^{(t)}, \boldsymbol{o}^{(t)} as below.

  • \boldsymbol{f}^{(t)}= \sigma(\boldsymbol{W}_{for} \boldsymbol{x}^{(t)} + \boldsymbol{R}_{for} \boldsymbol{y}^{(t-1)} +  \boldsymbol{b}_{for})
  • \boldsymbol{i}^{(t)}=\sigma(\boldsymbol{W}_{in} \boldsymbol{x}^{(t)} + \boldsymbol{R}_{in} \boldsymbol{y}^{(t-1)} + \boldsymbol{b}_{in})
  • \boldsymbol{z}^{(t)}=tanh(\boldsymbol{W}_z \boldsymbol{x}^{(t)} + \boldsymbol{R}_z \boldsymbol{y}^{(t-1)} + \boldsymbol{b}_z)
  • \boldsymbol{o}^{(t)}=\sigma(\boldsymbol{W}_{out} \boldsymbol{x}^{(t)} + \boldsymbol{R}_{out} \boldsymbol{y}^{(t-1)} + \boldsymbol{b}_{out})

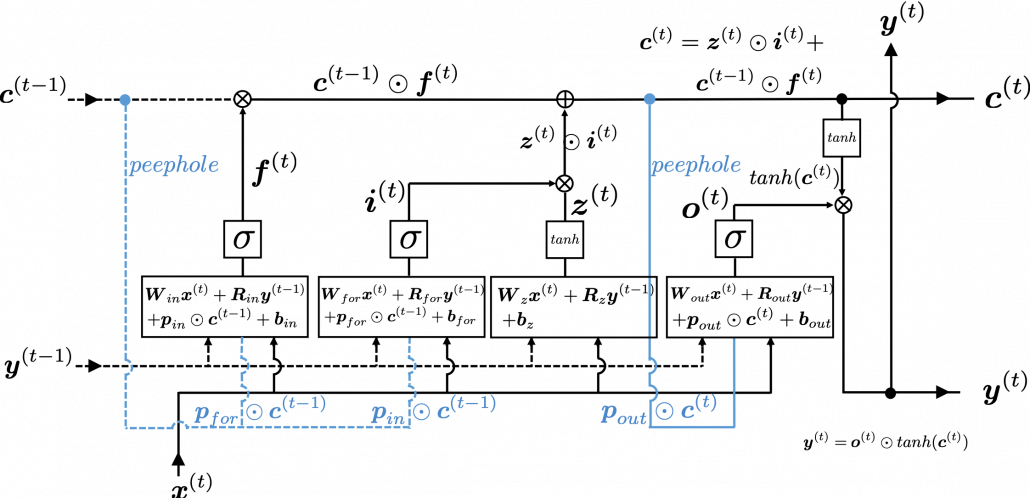
*You have to keep it in mind that the equations above do not include peephole connections, which I am going to show with blue lines in the end.

The equations above are quite straightforward if you understand forward propagation of simple neural networks. You add linear products of \boldsymbol{y}^{(t)} and \boldsymbol{c}^{(t)} with different weights in each gate. What makes LSTMs different from simple RNNs is how to mix the outputs of the gates with the cell connections. In order to explain that, I need to introduce a mathematical operator called Hadamard product, which you denote as \odot. This is a very simple operator. This operator produces an elementwise product of two vectors or matrices with identical shape.

With this Hadamar product operator, the renewed cell and the output are calculated as below.

  • \boldsymbol{c}^{(t)} = \boldsymbol{z}^{(t)}\odot \boldsymbol{i}^{(t)} + \boldsymbol{c}^{(t-1)} \odot \boldsymbol{f}^{(t)}
  • \boldsymbol{y}^{(t)} = \boldsymbol{o}^{(t)} \odot tanh(\boldsymbol{c}^{(t)})

The values of \boldsymbol{f}^{(t)}, \boldsymbol{i}^{(t)}, \boldsymbol{z}^{(t)}, \boldsymbol{o}^{(t)} are compressed into the range of [0, 1] or [-1, 1] with activation functions. You can see that the input gate and the block input give new information to the cell. The part \boldsymbol{c}^{(t-1)} \odot \boldsymbol{f}^{(t)} means that the output of the forget gate “forgets” the cell of the last time step by multiplying the values from 0 to 1 elementwise. And the cell \boldsymbol{c}^{(t)} is activated with tanh() and the output of the output gate “suppress” the activated value of \boldsymbol{c}^{(t)}. In other words, the output gatedecides how much information to give out as an output of the LSTM block. The output of every gate depends on the input \boldsymbol{x}^{(t)}, and the recurrent connection \boldsymbol{y}^{(t-1)}. That means an LSTM block learns to forget the cell of the last time step, to renew the cell, and to suppress the output. To describe in an extreme manner, if all the outputs of every gate are always (1, 1, …1)^T, LSTMs forget nothing, retain information of inputs at every time step, and gives out everything. And  if all the outputs of every gate are always (0, 0, …0)^T, LSTMs forget everything, receive no inputs, and give out nothing.

This model has one problem: the outputs of each gate do not directly depend on the information in the cell. To solve this problem, some LSTM models introduce some flows of information from the cell to each gate, which are shown as lines in blue in the figure below.

LSTM inner architecture

LSTM models, for example the one with or without peephole connection, depend on the library you use, and the model I have showed is one of standard LSTM structure. However no matter how complicated structure of an LSTM block looks, you usually cover it with a black box as below and show its behavior in a very simplified way.

5. Space Odyssey type

I personally think there is no advantages of understanding how LSTMs work with this Space Odyssey type chart, but in several cases you would have to use this type of chart. So I will briefly explain how to look at that type of chart, based on understandings of LSTMs you have gained through this article.

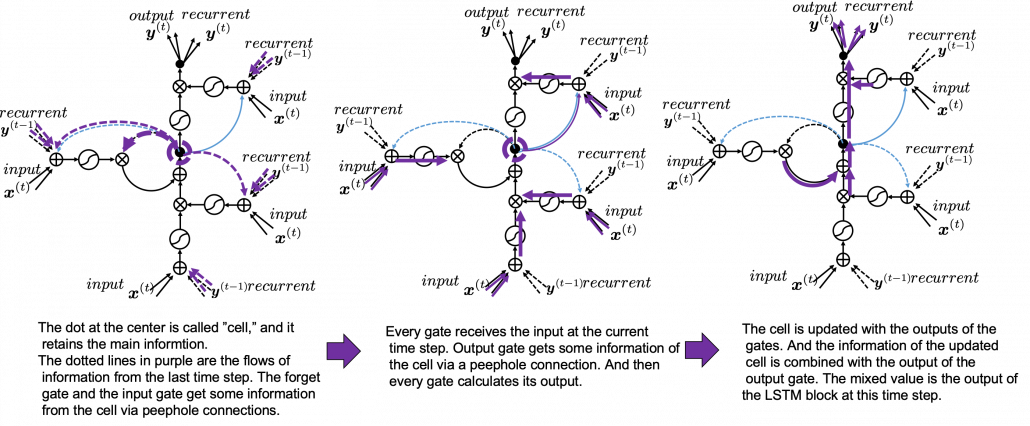
In Space Odyssey type of LSTM chart, at the center is a cell. Electronic circuit type of chart, which shows the flow of information of the cell as an uninterrupted “highway” in an LSTM block. On the other hand, in a Spacey Odyssey type of chart, the information of the cell rotate at the center. And each gate gets the information of the cell through peephole connections,  \boldsymbol{x}^{(t)}, the input at the time step (t) , sand \boldsymbol{y}^{(t-1)}, the output at the last time step (t-1), which came through recurrent connections. In Space Odyssey type of chart, you can more clearly see that the information of the cell go to each gate through the peephole connections in blue. Each gate calculates its output.

Just as the charts you have seen, the dotted line denote the information from the past. First, the information of the cell at the time step (t-1) goes to the forget gate and get mixed with the output of the forget cell In this process the cell is partly “forgotten.” Next, the input gate and the block input are mixed to generate part of new value of the the cell at time step  (t). And the partly “forgotten” \boldsymbol{c}^{(t-1)} goes back to the center of the block and it is mixed with the output of the input gate and the block input. That is how \boldsymbol{c}^{(t)} is renewed. And the value of new cell flow to the top of the chart, being mixed with the output of the output gate. Or you can also say the information of new cell is “suppressed” with the output gate.

I have finished the first four articles of this article series, and finally I am gong to write about back propagation of LSTM in the next article. I have to say what I have written so far is all for the next article, and my long long Power Point slides.


[References]

[1] Klaus Greff, Rupesh Kumar Srivastava, Jan Koutník, Bas R. Steunebrink, Jürgen Schmidhuber, “LSTM: A Search Space Odyssey,” (2017)

[2] Francois Chollet, Deep Learning with Python,(2018), Manning , pp. 202-204

[3] “Sepp Hochreiter receives IEEE CIS Neural Networks Pioneer Award 2021”, Institute of advanced research in artificial intelligence, (2020)
URL: https://www.iarai.ac.at/news/sepp-hochreiter-receives-ieee-cis-neural-networks-pioneer-award-2021/?fbclid=IwAR27cwT5MfCw4Tqzs3MX_W9eahYDcIFuoGymATDR1A-gbtVmDpb8ExfQ87A

[4] Oketani Takayuki, “Machine Learning Professional Series: Deep Learning,” (2015), pp. 120-125
岡谷貴之 著, 「機械学習プロフェッショナルシリーズ 深層学習」, (2015), pp. 120-125

[5] Harada Tatsuya, “Machine Learning Professional Series: Image Recognition,” (2017), pp. 252-257
原田達也 著, 「機械学習プロフェッショナルシリーズ 画像認識」, (2017), pp. 252-257

[6] “Understandable LSTM ~ With the Current Trends,” Qiita, (2015)
「わかるLSTM ~ 最近の動向と共に」, Qiita, (2015)
URL: https://qiita.com/t_Signull/items/21b82be280b46f467d1b

 How Text to Speech Voices Are Used In Data Science

To speak on voices, text to speech platforms are bringing versatility to a new scale by implementing voices that sound more personal and less like a robot. As these services gain traction, vocal quality, and implementation improve to give sounds that feel like they’re speaking to you from a human mouth.

The intention of most text to speech platforms have always been to provide experiences that users feel comfortable using. Voices are a huge part of that, so great strides have been taken to ensure that they sound right.

How Voices are Utilized

Voices in the text to speech are generated by a computer itself. As the computer-generated voices transcribe the text into oral responses, they make up what we hear as dialogue read to us. These voice clips initially had the problem of sounding robotic and unpersonable as they were pulled digitally together. Lately, though, the technology has improved to bring faster response time in transcribing words, as well as seamlessly stringing together. This has brought the advantage of making a computer-generated voice sound much more natural and human. As people seek to connect more with the works they read, having a human-sounding voice is a huge step in letting listeners relate to their works.

To give an example of where this works, you might have a GPS in your car. The GPS has a function where it will transcribe the car’s route and tell you each instruction. Some GPS companies have made full use of this feature and added fun voices to help entertain drivers. These include Darth Vader and Yoda from Star Wars or having Morgan Freeman and Homer Simpson narrate your route. Different voice types are utilized in services depending on the situation. Professional uses like customer service centers will keep automated voices sounding professional and courteous when assisting customers. Educational systems will keep softer and kinder sounding voices to help sound more friendly with students.

When compared to older solutions, the rise of vocal variety in Text to Speech services has taken huge leaps as more people see the value of having a voice that they can connect to. Expressive voices and emotional variance are being applied to voices to help further convey this, with happy or sad sounding voices being implemented wherever appropriate. As time goes on, these services will get better at the reading context within sentences to apply emotion and tone at the correct times, and improve overall vocal quality as well. These reinvent past methods by advancing the once static and robotic sounds that used to be commonplace among text to voice services.

More infrastructures adopt these services to expand their reach to consumers who might not have the capabilities to utilize their offerings.  Having clear and relatable voices matter because customers and users will be drawn to them considerably more than if they chose not to offer them at all. In the near future text to speech voices will develop even further, enhancing the way people of all kinds connect to the words they read.

As Businesses Struggle With ML, Automation Offers a Solution

In recent years, machine learning technology and the business solutions it enables has developed into a big business in and of itself. According to the industry analysts at IDC, spending on ML and AI technology is set to grow to almost $98 billion per year by 2023. In practical terms, that figure represents a business environment where ML technology has become a key priority for companies of every kind.

That doesn’t mean that the path to adopting ML technology is easy for businesses. Far from it. In fact, survey data seems to indicate that businesses are still struggling to get their machine learning efforts up and running. According to one such survey, it currently takes the average business as many as 90 days to deploy a single machine learning model. For 20% of businesses, that number is even higher.

From the data, it seems clear that something is missing in the methodologies that most companies rely on to make meaningful use of machine learning in their business workflows. A closer look at the situation reveals that the vast majority of data workers (analysts, data scientists, etc.) spend an inordinate amount of time on infrastructure work – and not on creating and refining machine learning models.

Streamlining the ML Adoption Process

To fix that problem, businesses need to turn to another growing area of technology: automation. By leveraging the latest in automation technology, it’s now possible to build an automated machine learning pipeline (AutoML pipeline) that cuts down on the repetitive tasks that slow down ML deployments and lets data workers get back to the work they were hired to do. With the right customized solution in place, a business’s ML team can:

  • Reduce the time spent on data collection, cleaning, and ingestion
  • Minimize human errors in the development of ML models
  • Decentralize the ML development process to create an ML-as-a-service model with increased accessibility for all business stakeholders

In short, an AutoML pipeline turns the high-effort functions of the ML development process into quick, self-adjusting steps handled exclusively by machines. In some use cases, an AutoML pipeline can even allow non-technical stakeholders to self-create ML solutions tailored to specific business use cases with no expert help required. In that way, it can cut ML costs, shorten deployment time, and allow data scientists to focus on tackling more complex modelling work to develop custom ML solutions that are still outside the scope of available automation techniques.

The Parts of an AutoML Pipeline

Although the frameworks and tools used to create an AutoML pipeline can vary, they all contain elements that conform to the following areas:

  • Data Preprocessing – Taking available business data from a variety of sources, cleaning it, standardizing it, and conducting missing value imputation
  • Feature Engineering – Identifying features in the raw data set to create hypotheses for the model to base predictions on
  • Model Selection – Choosing the right ML approach or hyperparameters to produce the desired predictions
  • Tuning Hyperparameters – Determining which hyperparameters help the model achieve optimal performance

As anyone familiar with ML development can tell you, the steps in the above process tend to represent the majority of the labour and time-intensive work that goes into creating a model that’s ready for real-world business use. It is also in those steps where the lion’s share of business ML budgets get consumed, and where most of the typical delays occur.

The Limitations and Considerations for Using AutoML

Given the scope of the work that can now become part of an AutoML pipeline, it’s tempting to imagine it as a panacea – something that will allow a business to reduce its reliance on data scientists going forward. Right now, though, the technology can’t do that. At this stage, AutoML technology is still best used as a tool to augment the productivity of business data teams, not to supplant them altogether.

To that end, there are some considerations that businesses using AutoML will need to keep in mind to make sure they get reliable, repeatable, and value-generating results, including:

  • Transparency – Businesses must establish proper vetting procedures to make sure they understand the models created by their AutoML pipeline, so they can explain why it’s making the choices or predictions it’s making. In some industries, such as in medicine or finance, this could even fall under relevant regulatory requirements.
  • Extensibility – Making sure the AutoML framework may be expanded and modified to suit changing business needs or to tackle new challenges as they arise.
  • Monitoring and Maintenance – Since today’s AutoML technology isn’t a set-it-and-forget-it proposition, it’s important to establish processes for the monitoring and maintenance of the deployment so it can continue to produce useful and reliable ML models.

The Bottom Line

As it stands today, the convergence of automation and machine learning holds the promise of delivering ML models at scale for businesses, which would greatly speed up the adoption of the technology and lower barriers to entry for those who have yet to embrace it. On the whole, that’s great news both for the businesses that will benefit from increased access to ML technology, as well as for the legions of data professionals tasked with making it all work.

It’s important to note, of course, that complete end-to-end ML automation with no human intervention is still a long way off. While businesses should absolutely explore building an automated machine learning pipeline to speed up development time in their data operations, they shouldn’t lose sight of the fact that they still need plenty of high-skilled data scientists and analysts on their teams. It’s those specialists that can make appropriate and productive use of the technology. Without them, an AutoML pipeline would accomplish little more than telling the business what it wants to hear.

The good news is that the AutoML tools that exist right now are sufficient to alleviate many of the real-world problems businesses face in their road to ML adoption. As they become more commonplace, there’s little doubt that the lead time to deploy machine learning models is going to shrink correspondingly – and that businesses will enjoy higher ROI and enhanced outcomes as a result.

Best machine learning algorithms you should know

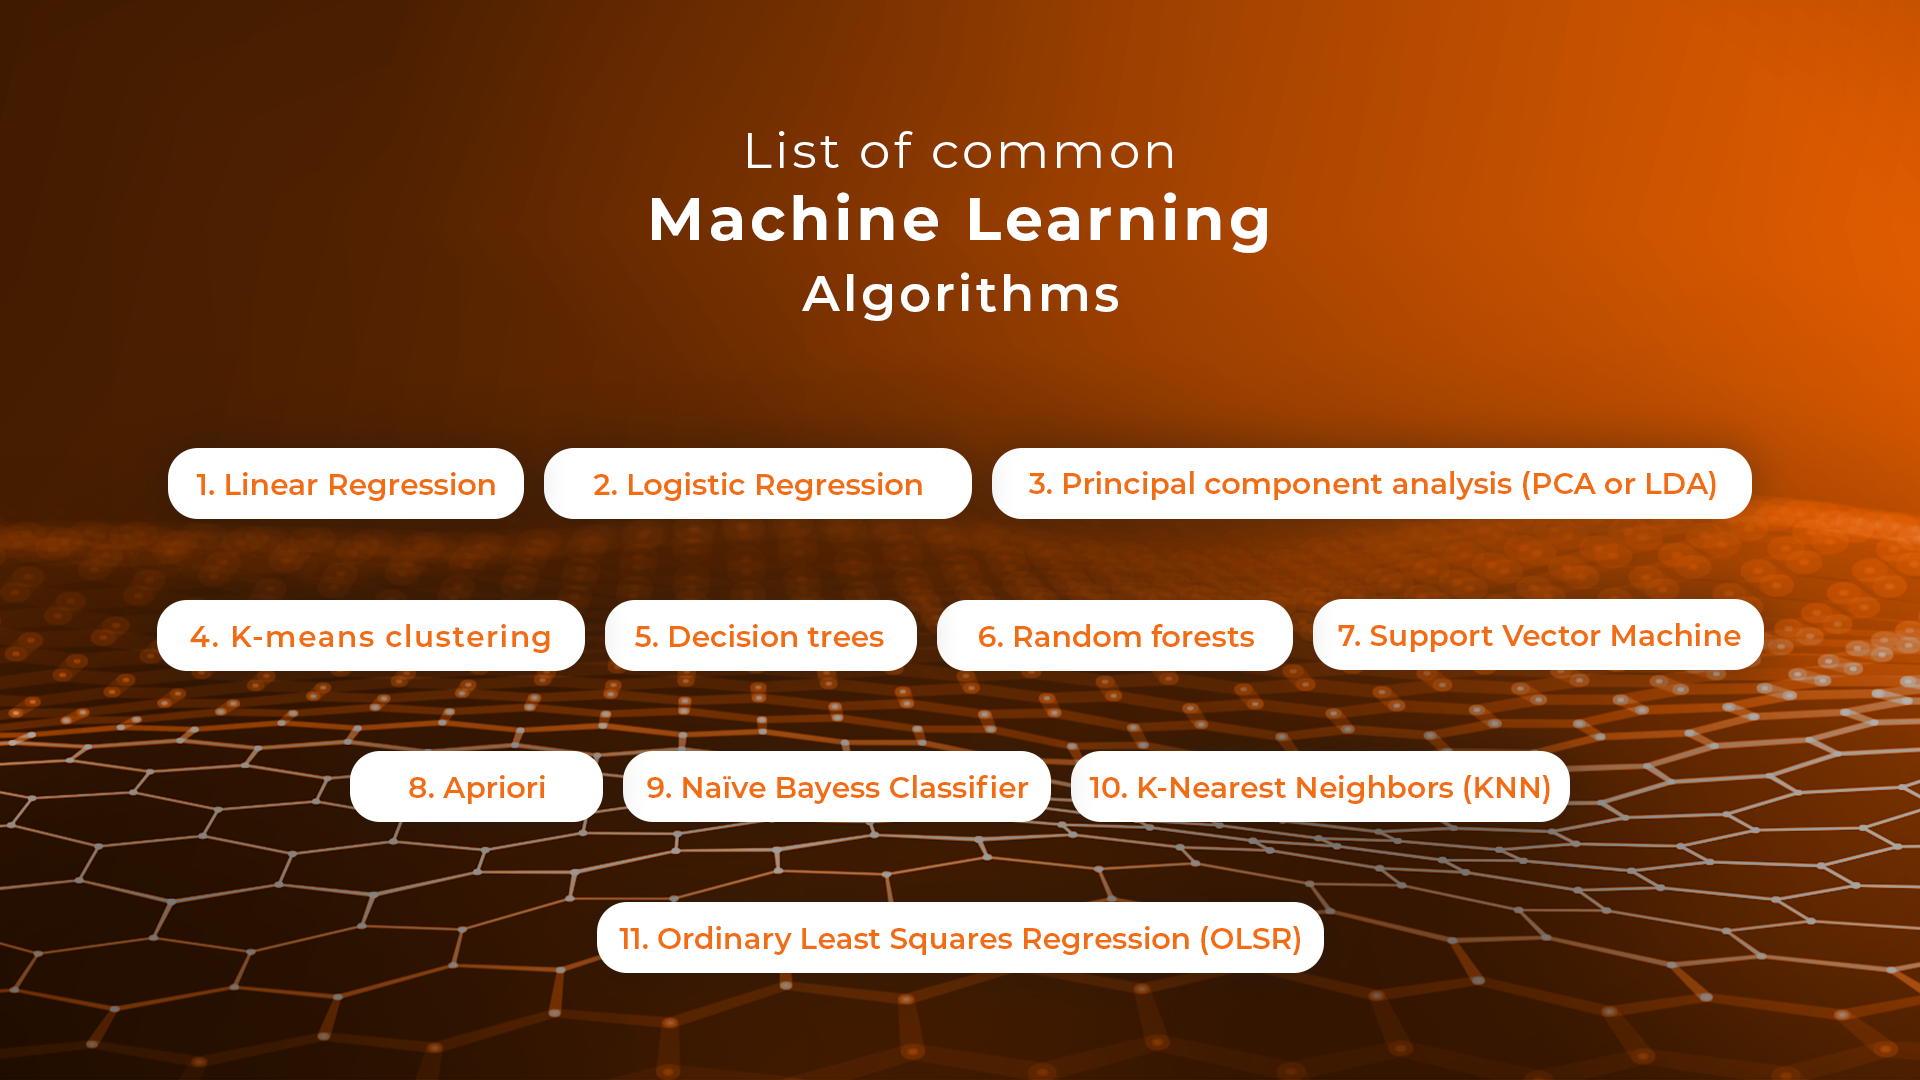
Machine learning is a key technology tool businesses use to build tools that enhance their operations. To do that, they take advantage of machine learning algorithms that come in different shapes and sizes, servicing different purposes and working on different data sets. Choosing the right algorithm for the job is what makes machine learning and deep learning projects successful. That’s why being aware of all the different types of machine learning algorithms is so important – that’s how you get better results and build more advanced solutions.

Here’s an overview of the best machine learning algorithms you should know before starting your project.

What is meant by machine learning algorithms?

First things first, what is machine learning and how do algorithms fit into the picture? A machine learning (ML) algorithm is a process or set of procedures that allow a model to adapt to the data with a specific objective set as the goal.

An ML algorithm specifies how the data is transformed from the input to output, helping the model to learn the appropriate mapping from input to output. That model specifies the mapping functions and holds the parameters in place, while the machine learning algorithm updates the parameters to help the model match its goal.

What are the algorithms used in machine learning?

Algorithms can model problems in many different ways. The easiest way to differentiate between different ML algorithms is by comparing them by learning styles that they can adapt. Generally, machine learning algorithms can adapt to several learning styles that help to solve different problems.

Here are four learning styles in machine learning you need to know:

1 Supervised learning

In supervised learning, the input data serves as training data and comes with a known label or result – for example, the price at a time or spam/not-spam.

In this variant, the training process is critical for preparing a model that makes predictions and then is corrected when the predictions are wrong. The training process continues until the model achieves the appropriate level of accuracy. Classification and regression are examples of problems for this learning type.


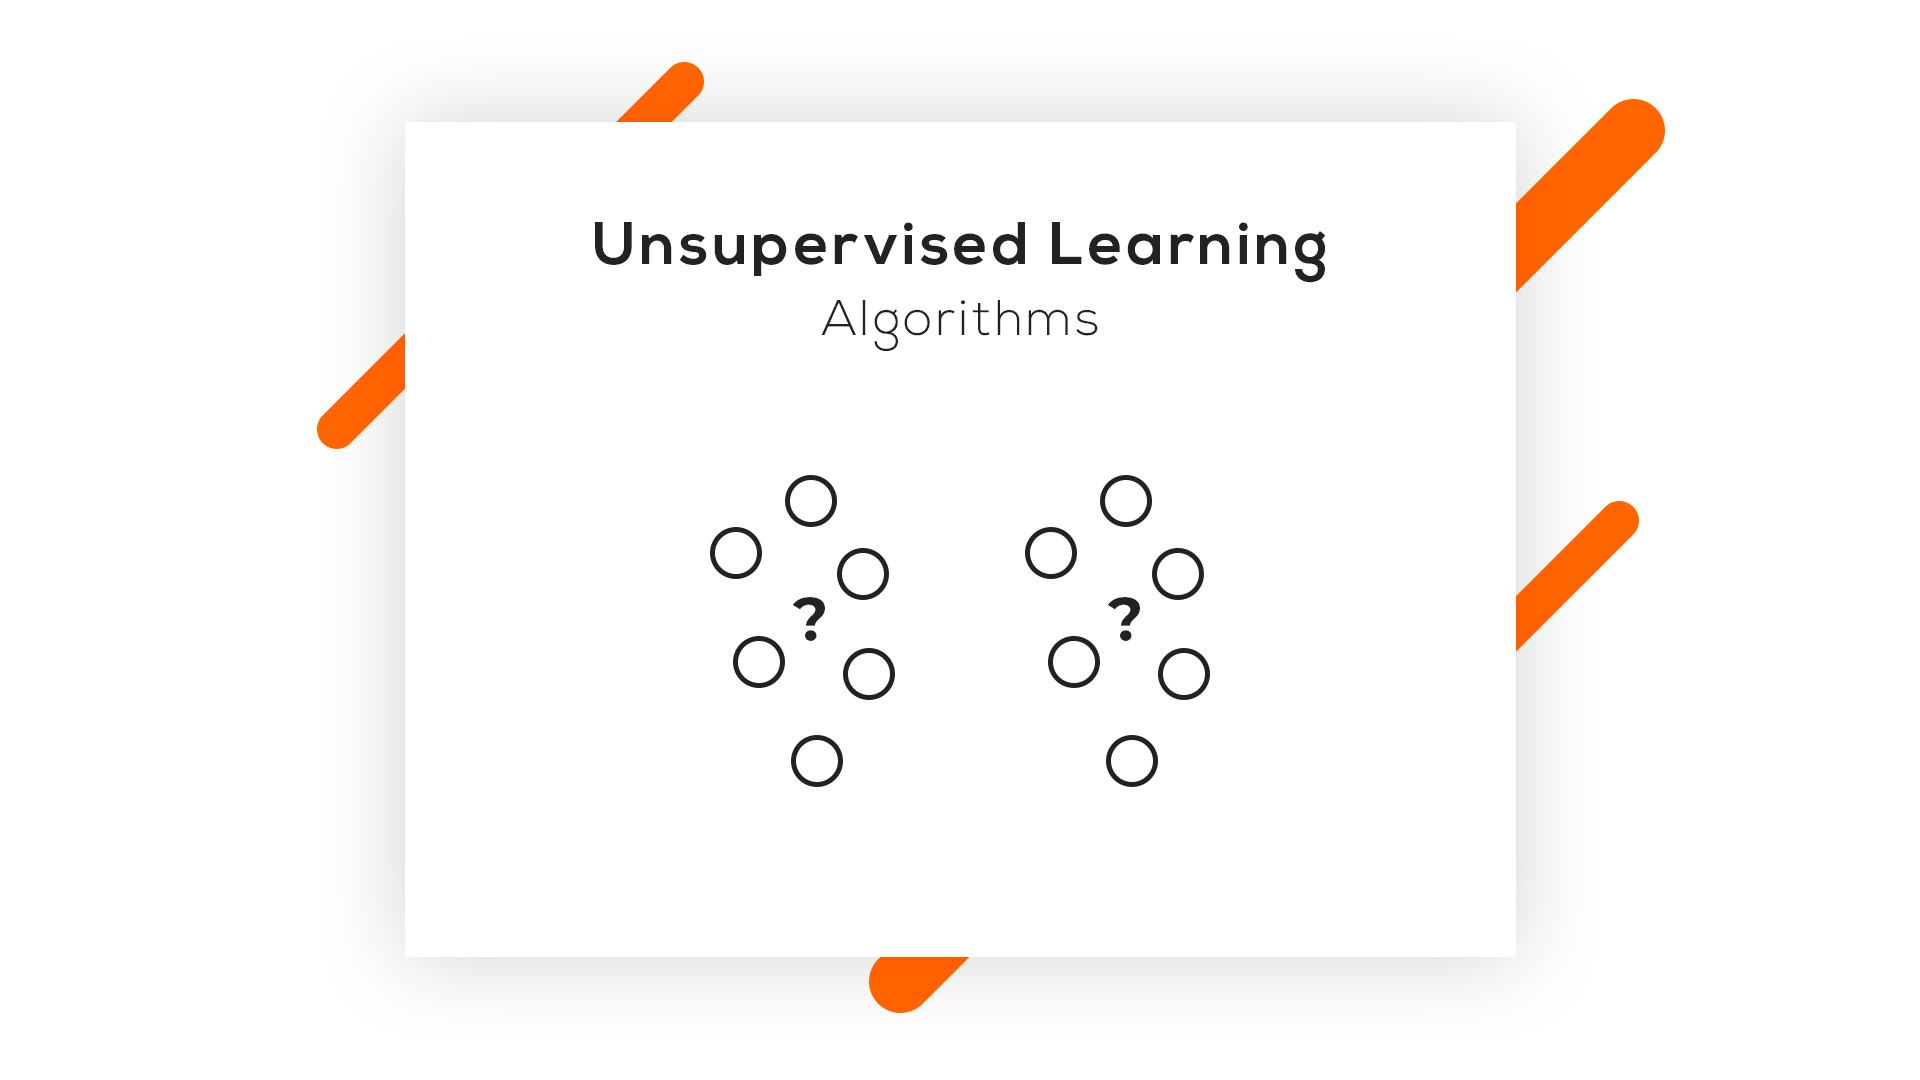
2 Unsupervised learning

In unsupervised learning, input data isn’t labeled and doesn’t come with a known result. Data scientists prepare models by deducing the structures in the input data to extract general rules or reduce redundancy through mathematical processes. Unsupervised learning addresses problems such as association rule learning, dimensionality reduction, and clustering.

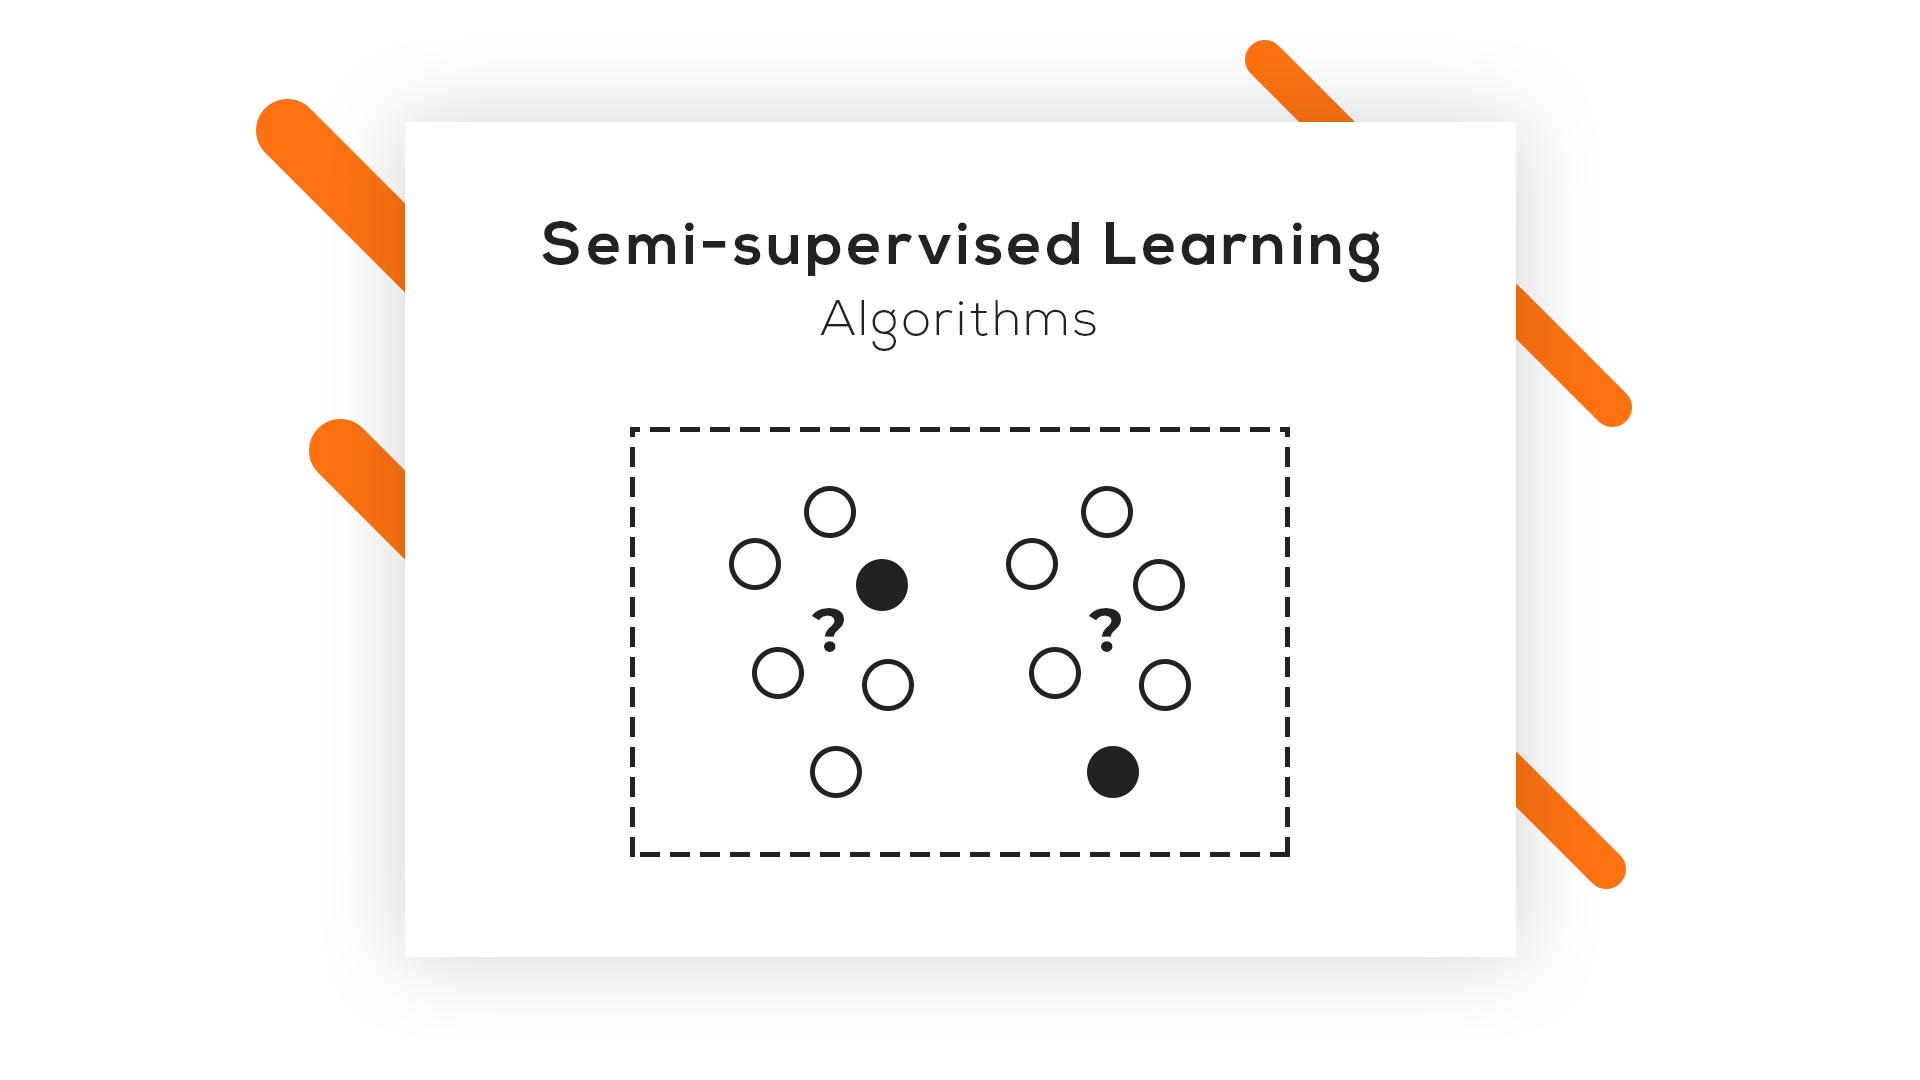
3 Semi-supervised learning

In this learning style, the input data is a mixture of labeled and unlabeled examples. The prediction problem is known, but the model needs to learn the structures for organizing data and making predictions on its own. This learning style is used to address problems such as regression and classification.

4 Reinforcement learning

One of three basic machine learning paradigms together with supervised learning and unsupervised learning, reinforcement learning (RL) is an area of machine learning that focuses on the ways in which software agents should take actions to maximize a specified notion of cumulative reward in a given environment.

The best machine learning algorithms you should know

1 Linear Regression

Linear regression is an algorithm that correlates between two variables in the data set, examining the input and output sets to show a relationship between them. For example, the algorithm can show how changing one of the input variables affects the other variable. The relationship is represented by plotting a line on the graph.

Linear regression is one of the most popular algorithms in machine learning because it’s transparent and requires no tuning to work. Practical applications of this algorithm are risk assessment or sales forecasting solutions.

2 Logistic regression

Logistic regression is a type of constrained Linear Regression with a non-linearity application after you apply weights. Note that this algorithm is used for classification, not regression. The algorithm restricts the outputs close to +/- classes (and 1 and 0 in the case of sigmoid) and can be trained with Gradient Descent or L-BFGS.

Logistic regression is used in Natural Language Processing (NLP) applications, where it often appears under the name of Maximum Entropy Classifier.

3 Principal component analysis (PCA or LDA)

Principal component analysis is an unsupervised method that helps data scientists to understand better the global properties of a data set that consists of vectors. It analyzes the covariance matrix of data points to learn which dimensions/data points have high variance among themselves and low covariance with others. The algorithm helps data scientists to get data points with reduced dimensions.

4 K-means clustering

K- means clustering is a type of unsupervised clustering algorithm that sorts data sets through defined clusters. It offers results in the form of groups based on internal patterns.

For example, you can use a K-means algorithm for sorting web results for the word “cat,” and it will show all the results in the form of groups. The main advantage of this algorithm is its accuracy as it provides data groupings faster than other algorithms.


5 Decision trees

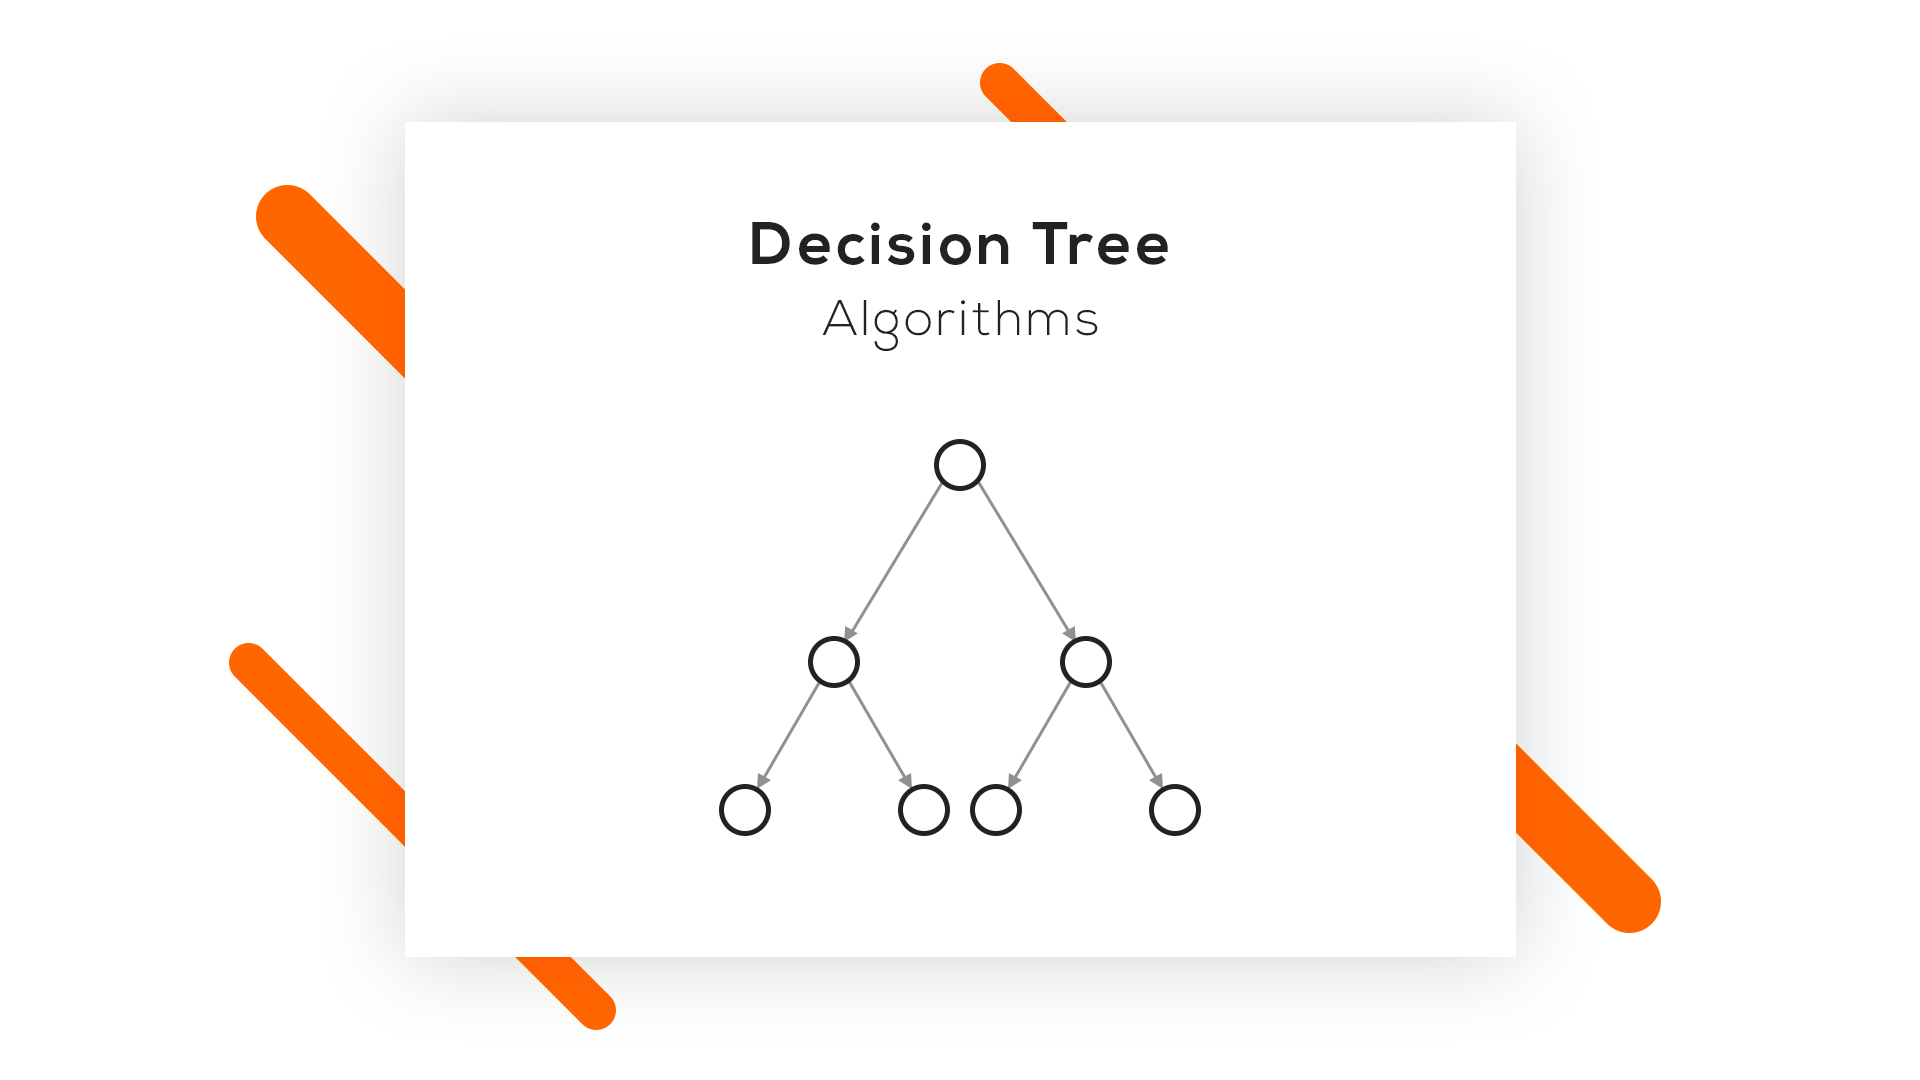
A decision tree is made of various branches that represent the outcome of many decisions. This algorithm collects and graphs data in multiple branches to predict response variables on the basis of past decisions. It comes in handy for mapping our decisions and presents results visually to communicate findings easily.

Decision trees work best for smaller data sets and relatively low-stake decisions – otherwise, the long-tail visuals can be hard to decipher. The key advantage of this algorithm is that it allows showing multiple outcomes and tests without having to involve data scientists – it’s easy to use.

6 Random forests

A random forest consists of a great number of individual decision trees where they all operate as an ensemble. An individual tree in the random forest generates a class prediction – the class which receives the highest number of votes becomes the model’s prediction. Having many relatively uncorrelated models (trees) operating as a committee easily outperforms individual constituent models.

The low correlation between these models is the strength of this approach because it allows producing ensemble predictions that are far more accurate than individual predictions. Note that decisions trees protect each other from individual errors. While some trees may generate false predictions, others will generate the right ones – as a group; they will be able to move in the right direction.

7 Support Vector Machine

Support Vector Machines (SVMs) are linear models similar to linear or logistic regression we’ve discussed earlier. However, there’s one difference – they have a different margin-based loss function, which can be optimized by using methods such as L-BFGS or SGD. SVMs internally analyze data sets into classes, which is helpful for future classifications.

The main idea behind SVM is separating data into classes and maximizing the margins of entering future data into classes. This type of algorithm works best for training data. However, it can also serve as a tool for processing nonlinear data. The financial sector makes use of Support Vector Machines thanks to its accuracy in classifying both current and future data sets.

8 Apriori

The Apriori algorithm is used a lot in market analysis. It’s based on the principle of Apriori and checks for positive and negative correlations between products after analyzing values in data sets.

For example, if two values often correlate in a data set, the algorithm will conclude that A will often lead to B, referring to the information in data sets. For example, if customers often buy product A and product B together, this relation will hold a high percentage and help companies like Google or Amazon to predict product searches and purchases.

9 Naive Bayes Classifier

This handy classification technique is based on Bayes’ Theorem, which assumes independence among predictors. The algorithm will assume that the presence of a specific feature in a class is not related to the presence of any other feature in the same class.

For example, a fruit may be considered a banana if it’s yellow, curved, and about 15 cm long. These features depend on each other, and on the existence of hooter features, they all independently contribute to the probability that this fruit is a banana. That’s why the algorithm bears the name “Naive.”

The algorithm offers a model that is easy to build and helpful in handling very large data sets. It can outperform the most sophisticated classification methods.

10 K-Nearest Neighbors (KNN)

This is one of the simplest algorithm types used in machine learning for classification and regression. KNN algorithms classify new data points on the basis of similarity measures, such as the distance function. They perform classification by using a majority vote of the data points’ neighbors. They then assign data to the class, which has the nearest neighbors. Together with increasing the number of nearest neighbors (the value of k), the accuracy may increase as well.

11 Ordinary Least Squares Regression (OLSR)

Ordinary Least Squares Regression (OLSR) is a generalized linear modeling technique data scientists use for estimating unknown parameters that are part of a linear regression model. OLSR describes the relationship between a dependent variable and one or more of its independent variables.

The algorithm is applied in diverse fields such as economics, finance, medicine, and social sciences. Companies use it in machine learning and predictive analytics to dynamically predict specific outcomes on the basis of variables that change dynamically.

We hope that this machine learning algorithms list helps you pick the right tools of the trade for your next machine learning project. If you’d like to learn more about Machine Learning, Data Science and Web Development, visit the Sunscrapers company blog.

A Bird’s Eye View: How Machine Learning Can Help You Charge Your E-Scooters

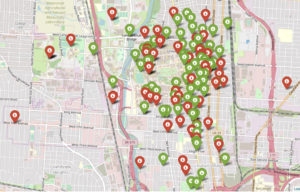
Bird scooters in Columbus, Ohio

Bird scooters in Columbus, Ohio

Ever since I started using bike-sharing to get around in Seattle, I have become fascinated with geolocation data and the transportation sharing economy. When I saw this project leveraging the mobility data RESTful API from the Los Angeles Department of Transportation, I was eager to dive in and get my hands dirty building a data product utilizing a company’s mobility data API.

Unfortunately, the major bike and scooter providers (Bird, JUMP, Lime) don’t have publicly accessible APIs. However, some folks have seemingly been able to reverse-engineer the Bird API used to populate the maps in their Android and iOS applications.

One interesting feature of this data is the nest_id, which indicates if the Bird scooter is in a “nest” — a centralized drop-off spot for charged Birds to be released back into circulation.

I set out to ask the following questions:

  1. Can real-time predictions be made to determine if a scooter is currently in a nest?
  2. For non-nest scooters, can new nest location recommendations be generated from geospatial clustering?

To answer these questions, I built a full-stack machine learning web application, NestGenerator, which provides an automated recommendation engine for new nest locations. This application can help power Bird’s internal nest location generation that runs within their Android and iOS applications. NestGenerator also provides real-time strategic insight for Bird chargers who are enticed to optimize their scooter collection and drop-off route based on proximity to scooters and nest locations in their area.

Bird

The electric scooter market has seen substantial growth with Bird’s recent billion dollar valuation  and their $300 million Series C round in the summer of 2018. Bird offers electric scooters that top out at 15 mph, cost $1 to unlock and 15 cents per minute of use. Bird scooters are in over 100 cities globally and they announced in late 2018 that they eclipsed 10 million scooter rides since their launch in 2017.

Bird scooters in Tel Aviv, Israel

Bird scooters in Tel Aviv, Israel

With all of these scooters populating cities, there’s much-needed demand for people to charge them. Since they are electric, someone needs to charge them! A charger can earn additional income for charging the scooters at their home and releasing them back into circulation at nest locations. The base price for charging each Bird is $5.00. It goes up from there when the Birds are harder to capture.

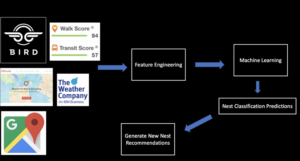
Data Collection and Machine Learning Pipeline

The full data pipeline for building “NestGenerator”

Data

From the details here, I was able to write a Python script that returned a list of Bird scooters within a specified area, their geolocation, unique ID, battery level and a nest ID.

I collected scooter data from four cities (Atlanta, Austin, Santa Monica, and Washington D.C.) across varying times of day over the course of four weeks. Collecting data from different cities was critical to the goal of training a machine learning model that would generalize well across cities.

Once equipped with the scooter’s latitude and longitude coordinates, I was able to leverage additional APIs and municipal data sources to get granular geolocation data to create an original scooter attribute and city feature dataset.

Data Sources:

  • Walk Score API: returns a walk score, transit score and bike score for any location.
  • Google Elevation API: returns elevation data for all locations on the surface of the earth.
  • Google Places API: returns information about places. Places are defined within this API as establishments, geographic locations, or prominent points of interest.
  • Google Reverse Geocoding API: reverse geocoding is the process of converting geographic coordinates into a human-readable address.
  • Weather Company Data: returns the current weather conditions for a geolocation.
  • LocationIQ: Nearby Points of Interest (PoI) API returns specified PoIs or places around a given coordinate.
  • OSMnx: Python package that lets you download spatial geometries and model, project, visualize, and analyze street networks from OpenStreetMap’s APIs.

Feature Engineering

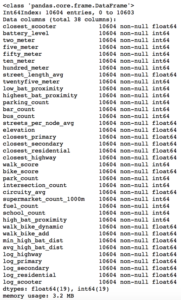
After extensive API wrangling, which included a four-week prolonged data collection phase, I was finally able to put together a diverse feature set to train machine learning models. I engineered 38 features to classify if a scooter is currently in a nest.

Full Feature Set

Full Feature Set

The features boiled down into four categories:

  • Amenity-based: parks within a given radius, gas stations within a given radius, walk score, bike score
  • City Network Structure: intersection count, average circuity, street length average, average streets per node, elevation level
  • Distance-based: proximity to closest highway, primary road, secondary road, residential road
  • Scooter-specific attributes: battery level, proximity to closest scooter, high battery level (> 90%) scooters within a given radius, total scooters within a given radius


Log-Scale Transformation

For each feature, I plotted the distribution to explore the data for feature engineering opportunities. For features with a right-skewed distribution, where the mean is typically greater than the median, I applied these log transformations to normalize the distribution and reduce the variability of outlier observations. This approach was used to generate a log feature for proximity to closest scooter, closest highway, primary road, secondary road, and residential road.

An example of a log transformation

Statistical Analysis: A Systematic Approach

Next, I wanted to ensure that the features I included in my model displayed significant differences when broken up by nest classification. My thinking was that any features that did not significantly differ when stratified by nest classification would not have a meaningful predictive impact on whether a scooter was in a nest or not.

Distributions of a feature stratified by their nest classification can be tested for statistically significant differences. I used an unpaired samples t-test with a 0.01% significance level to compute a p-value and confidence interval to determine if there was a statistically significant difference in means for a feature stratified by nest classification. I rejected the null hypothesis if a p-value was smaller than the 0.01% threshold and if the 99.9% confidence interval did not straddle zero. By rejecting the null-hypothesis in favor of the alternative hypothesis, it’s deemed there is a significant difference in means of a feature by nest classification.

Battery Level Distribution Stratified by Nest Classification to run a t-test

Battery Level Distribution Stratified by Nest Classification to run a t-test

Log of Closest Scooter Distribution Stratified by Nest Classification to run a t-test

Throwing Away Features

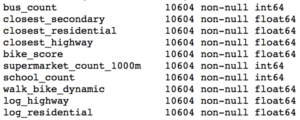
Using the approach above, I removed ten features that did not display statistically significant results.

Statistically Insignificant Features Removed Before Model Development

Model Development

I trained two models, a random forest classifier and an extreme gradient boosting classifier since tree-based models can handle skewed data, capture important feature interactions, and provide a feature importance calculation. I trained the models on 70% of the data collected for all four cities and reserved the remaining 30% for testing.

After hyper-parameter tuning the models for performance on cross-validation data it was time to run the models on the 30% of test data set aside from the initial data collection.

I also collected additional test data from other cities (Columbus, Fort Lauderdale, San Diego) not involved in training the models. I took this step to ensure the selection of a machine learning model that would generalize well across cities. The performance of each model on the additional test data determined which model would be integrated into the application development.

Performance on Additional Cities Test Data

The Random Forest Classifier displayed superior performance across the board

The Random Forest Classifier displayed superior performance across the board

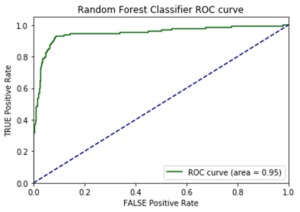
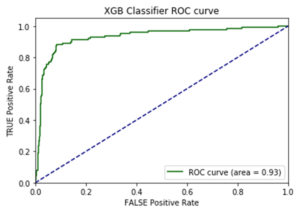
I opted to move forward with the random forest model because of its superior performance on AUC score and accuracy metrics on the additional cities test data. AUC is the Area under the ROC Curve, and it provides an aggregate measure of model performance across all possible classification thresholds.

AUC Score on Test Data for each Model

AUC Score on Test Data for each Model

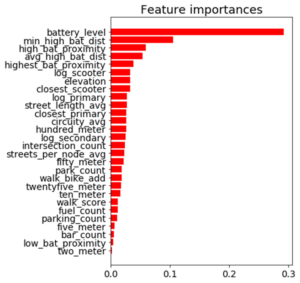
Feature Importance

Battery level dominated as the most important feature. Additional important model features were proximity to high level battery scooters, proximity to closest scooter, and average distance to high level battery scooters.

Feature Importance for the Random Forest Classifier

Feature Importance for the Random Forest Classifier

The Trade-off Space

Once I had a working machine learning model for nest classification, I started to build out the application using the Flask web framework written in Python. After spending a few days of writing code for the application and incorporating the trained random forest model, I had enough to test out the basic functionality. I could finally run the application locally to call the Bird API and classify scooter’s into nests in real-time! There was one huge problem, though. It took more than seven minutes to generate the predictions and populate in the application. That just wasn’t going to cut it.

The question remained: will this model deliver in a production grade environment with the goal of making real-time classifications? This is a key trade-off in production grade machine learning applications where on one end of the spectrum we’re optimizing for model performance and on the other end we’re optimizing for low latency application performance.

As I continued to test out the application’s performance, I still faced the challenge of relying on so many APIs for real-time feature generation. Due to rate-limiting constraints and daily request limits across so many external APIs, the current machine learning classifier was not feasible to incorporate into the final application.

Run-Time Compliant Application Model

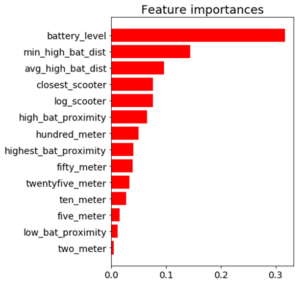
After going back to the drawing board, I trained a random forest model that relied primarily on scooter-specific features which were generated directly from the Bird API.

Through a process called vectorization, I was able to transform the geolocation distance calculations utilizing NumPy arrays which enabled batch operations on the data without writing any “for” loops. The distance calculations were applied simultaneously on the entire array of geolocations instead of looping through each individual element. The vectorization implementation optimized real-time feature engineering for distance related calculations which improved the application response time by a factor of ten.

Feature Importance for the Run-time Compliant Random Forest Classifier

Feature Importance for the Run-time Compliant Random Forest Classifier

This random forest model generalized well on test-data with an AUC score of 0.95 and an accuracy rate of 91%. The model retained its prediction accuracy compared to the former feature-rich model, but it gained 60x in application performance. This was a necessary trade-off for building a functional application with real-time prediction capabilities.

Geospatial Clustering

Now that I finally had a working machine learning model for classifying nests in a production grade environment, I could generate new nest locations for the non-nest scooters. The goal was to generate geospatial clusters based on the number of non-nest scooters in a given location.

The k-means algorithm is likely the most common clustering algorithm. However, k-means is not an optimal solution for widespread geolocation data because it minimizes variance, not geodetic distance. This can create suboptimal clustering from distortion in distance calculations at latitudes far from the equator. With this in mind, I initially set out to use the DBSCAN algorithm which clusters spatial data based on two parameters: a minimum cluster size and a physical distance from each point. There were a few issues that prevented me from moving forward with the DBSCAN algorithm.

  1. The DBSCAN algorithm does not allow for specifying the number of clusters, which was problematic as the goal was to generate a number of clusters as a function of non-nest scooters.
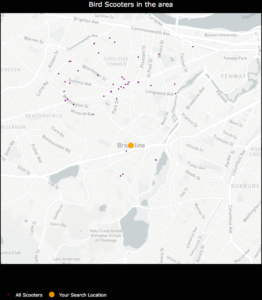
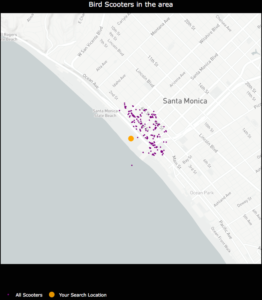
  2. I was unable to hone in on an optimal physical distance parameter that would dynamically change based on the Bird API data. This led to suboptimal nest locations due to a distortion in how the physical distance point was used in clustering. For example, Santa Monica, where there are ~15,000 scooters, has a higher concentration of scooters in a given area whereas Brookline, MA has a sparser set of scooter locations.

An example of how sparse scooter locations vs. highly concentrated scooter locations for a given Bird API call can create cluster distortion based on a static physical distance parameter in the DBSCAN algorithm. Left:Bird scooters in Brookline, MA. Right:Bird scooters in Santa Monica, CA.

An example of how sparse scooter locations vs. highly concentrated scooter locations for a given Bird API call can create cluster distortion based on a static physical distance parameter in the DBSCAN algorithm. Left:Bird scooters in Brookline, MA. Right:Bird scooters in Santa Monica, CA.

Given the granularity of geolocation scooter data I was working with, geospatial distortion was not an issue and the k-means algorithm would work well for generating clusters. Additionally, the k-means algorithm parameters allowed for dynamically customizing the number of clusters based on the number of non-nest scooters in a given location.

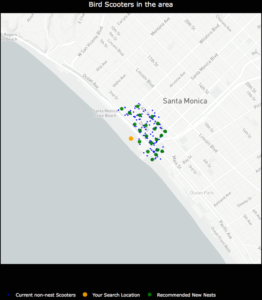
Once clusters were formed with the k-means algorithm, I derived a centroid from all of the observations within a given cluster. In this case, the centroids are the mean latitude and mean longitude for the scooters within a given cluster. The centroids coordinates are then projected as the new nest recommendations.

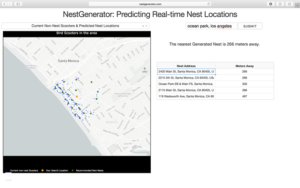
NestGenerator showcasing non-nest scooters and new nest recommendations utilizing the K-Means algorithm

NestGenerator showcasing non-nest scooters and new nest recommendations utilizing the K-Means algorithm.

NestGenerator Application

After wrapping up the machine learning components, I shifted to building out the remaining functionality of the application. The final iteration of the application is deployed to Heroku’s cloud platform.

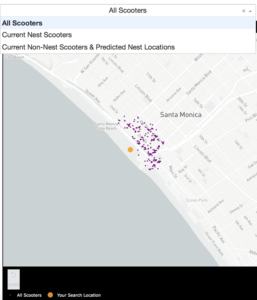
In the NestGenerator app, a user specifies a location of their choosing. This will then call the Bird API for scooters within that given location and generate all of the model features for predicting nest classification using the trained random forest model. This forms the foundation for map filtering based on nest classification. In the app, a user has the ability to filter the map based on nest classification.

Drop-Down Map View filtering based on Nest Classification

Drop-Down Map View filtering based on Nest Classification

Nearest Generated Nest

To see the generated nest recommendations, a user selects the “Current Non-Nest Scooters & Predicted Nest Locations” filter which will then populate the application with these nest locations. Based on the user’s specified search location, a table is provided with the proximity of the five closest nests and an address of the Nest location to help inform a Bird charger in their decision-making.

NestGenerator web-layout with nest addresses and proximity to nearest generated nests

NestGenerator web-layout with nest addresses and proximity to nearest generated nests

Conclusion

By accurately predicting nest classification and clustering non-nest scooters, NestGenerator provides an automated recommendation engine for new nest locations. For Bird, this application can help power their nest location generation that runs within their Android and iOS applications. NestGenerator also provides real-time strategic insight for Bird chargers who are enticed to optimize their scooter collection and drop-off route based on scooters and nest locations in their area.

Code

The code for this project can be found on my GitHub

Comments or Questions? Please email me an E-Mail!


Closing the AI-skills gap with Upskilling

Closing the AI-skills gap with Upskilling

Artificial Intelligent or as it is fancily referred as AI, has garnered huge popularity worldwide.  And given the career prospects it has, it definitely should. Almost everyone interested in technology sector has them rushing towards it, especially young and motivated fresh computer science graduates. Compared to other IT-related jobs AI pays way higher salary and have opportunities. According to a Glassdoor report, Data Scientist, one of the many related jobs, is the number one job with good salary, job openings and more. AI-related jobs include Data Scientists, Analysts, Machine Learning Engineer, NLP experts etc.

AI has found applications in almost every industry and thus it has picked up demand. Home assistants – Siri, Ok Google, Amazon Echo — chatbots, and more some of the popular applications of AI.

Increasing adoption of AI across Industry

The advantages of AI like increased productivity has increased its adoption among companies. According to Gartner, 37 percent of enterprise currently use AI in one way or the other. In fact, in the last four year adoption of AI technologies among companies has increased by 270 percent. In telecommunications, for instance, 52 percent of companies have chatbots deployed for better and smoother customer experience. Now, about 49 percent of businesses are now on their way to alter business models to integrate and adopt AI-driven processes. Further, industry leaders have gone beyond and voiced their concerns about companies that are lagging in AI adoption.

Unfortunately, it has been extremely difficult for employers to find right skilled or qualified candidates for AI-related positions. A reports suggests that there are total 300,000 AI professionals are available worldwide, while there’s demand for millions. In a recent survey conducted by Ernst & Young, 51 percent AI professionals told that lack of talent was the biggest impediment in AI adoption.

Further, O’Reilly, in 2018 conducted a survey, which found the lack of AI skills, among other things, was the major reason that was holding companies back from implementing AI.
The major reason for this is the lack of skills among people who aspire to get into AI-related jobs. According to a report, there demand for millions for jobs in AI. However, only a handful of qualified people are available.

Bridging the skill gap in AI-related jobs

Top companies and government around the world have taken up initiatives to close this gap. Google and Amazon, for instance, have dedicated facilities which trains in AI skills.  Google’s Brain Toronto is a dedicated facility to expand their talent in AI.  Similarly, Amazon has facility near University of Cambridge which is dedicated to AI. Most companies either already have a facility or are in the process of setting up one.

In addition to this, governments around the world are also taking initiatives to address the skill gap. For instance, government across the world are pushing towards AI advancement and are develop collaborative plans which aims at delivering more AI skilled professionals. Recently, the white house launched ai.gov which is further helping to promote AI in the US. The website will offer updates related to AI projects across different sectors.

Other than these, companies have taken this upon themselves to reskills their employees and prepare them for future roles. According to a report from Towards Data Science, about 63 percent of companies have in-house training programs to train employees in AI-related skills.

Overall, though there is demand for AI professionals, lack of skilled talent is a major problem.

Roles in Artificial Intelligence
Artificial Intelligence is the most dominant role for which companies hire across artificial Intelligence. Other than that, following are some of the popular roles:

  1. Machine learning Engineer: These are the people who make machines learn with complex algorithms. On advance level, Machine learning engineers are required to have good knowledge of computer vision. According to Indeed, in the last year, demand for Machine Learning Engineer has grown by 344 percent.
  2. NLP Experts: These experts are equipped with the understanding of making machines computer understand human language. Their expertise includes knowledge of how machines understand human language. Text-to-speech technologies are the common areas which require NLP experts. Demand for engineers who can program computers to understand human speech is growing continuously. It was the fast growing skills in Upwork’s list of in-demand freelancing skills. In Q4, 2016, it had grown 200 percent and since then has been on continuously growing.
  3. Big Data Engineers: This is majorly an analytics role. These gather huge amount of data available from sources and analyze it to derive insights and understand patter, which may be further used for machine learning, prediction modelling, natural language processing. In Mckinsey annual report 2018, it had reported that there was shortage of 190,000 big data professionals in the US alone.

Other roles like Data Scientists, Analysts, and more also in great demand. Then, again due to insufficient talent in the market, companies are struggling to hire for these roles.

Self-learning and upskilling
Artificial Intelligence is a continuously growing field and it has been advancing at a very fast pace, and it makes extremely difficult to keep up with in-demand skills. Hence, it is imperative to keep yourself up with demand of the industry, or it is just a matter of time before one becomes redundant.

On an individual level, learning new skills is necessary. One has to be agile and keep learning, and be ready to adapt new technologies. For this, AI training programs and certifications are ideal.  There are numerous AI programs which individuals can take to further learn new skills. AI certifications can immensely boost career opportunities. Certification programs offer a structured approach to learning which benefits in learning mostly practical and executional skills while keeping fluff away. It is more hands-on. Plus, certifications programs qualify only when one has passed practical test which is very advantageous in tech. AI certifications like AIE (Artificial Intelligence Engineer) are quite popular.

Online learning platforms also offer good a resource to learn artificial intelligence. Most schools haven’t yet adapted their curriculum to skill for AI, while most universities and grad schools are in their way to do so. In the meantime, online learning platforms offer a good way to learn AI skills, where one can start from basic and reach to advance skills.

Introduction to ROC Curve

The abbreviation ROC stands for Receiver Operating Characteristic. Its main purpose is to illustrate the diagnostic ability of classifier as the discrimination threshold is varied. It was developed during World War II when Radar operators had to decide if the blip on the screen is an enemy target, a friendly ship or just a noise.  For these purposes they measured the ability of a radar receiver operator to make these important distinctions, which was called the Receiver Operating Characteristic.

Later it was found useful in interpreting medical test results and then in Machine learning classification problems. In order to get an introduction to binary classification and terms like ‘precision’ and ‘recall’ one can look into my earlier blog  here.

True positive rate and false positive rate

Let’s imagine a situation where a fire alarm is installed in a kitchen. The alarm is supposed to emit a sound in case fire smoke is detected in the room. Unfortunately, there is a lot of cooking done in the kitchen and the alarm may trigger the sound too often. Thus, instead of serving a purpose the alarm becomes a nuisance due to a large number of false alarms. In statistical terms these types of errors are called type 1 errors, or false positives.

One way to deal with this problem is to simply decrease sensitivity of the device. We do this by increasing the trigger threshold at the alarm setting. But then, not every alarm should have the same threshold setting. Consider the same type of device but kept in a bedroom. With high threshold, the device might miss smoke from a real short-circuit in the wires which poses a real danger of fire. This kind of failure is called Type 2 error or a false negative. Although the two devices are the same, different types of threshold settings are optimal for different circumstances.

To specify this more formally, let us describe the performance of a binary classifier at a particular threshold by the following parameters:


These parameters take different values at different thresholds. Hence, they define the performance of the classifier at particular threshold. But we want to examine in overall how good a classifier is. Fortunately, there is a way to do that. We plot the True Positive Rate (TPR) and False Positive rate (FPR) at different thresholds and this plot is called ROC curve.

Let’s try to understand this with an example.

A case with a distinct population distribution

Let’s suppose there is a disease which can be identified with deficiency of some parameter (maybe a certain vitamin). The distribution of population with this disease has a mean vitamin concentration sharply distinct from the mean of a healthy population, as shown below.
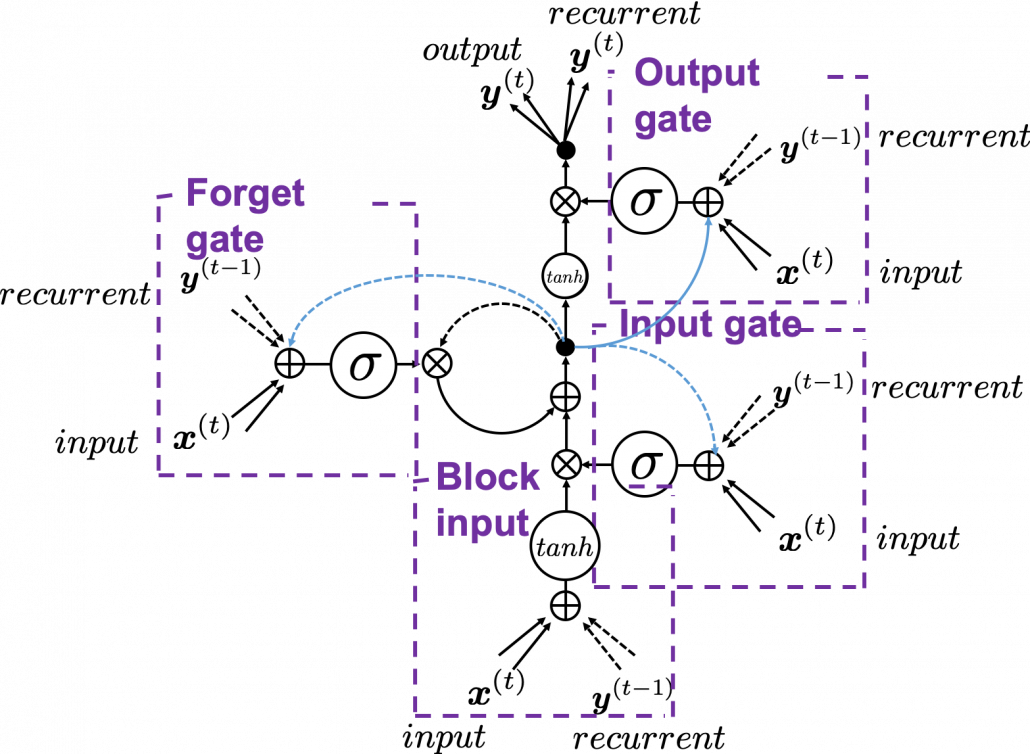
This is result of dummy data simulating population of 2000 people,the link to the code is given  in the end of this blog.  As the two populations are distinctly separated (there is no  overlap between the two distributions), we can expect that a classifier would have an easy job distinquishing healthy from sick people. We can run a logistic regression classifier with a threshold of .5 and be 100% succesful in detecting the decease.

The confusion matrix may look something like this.

In this ideal case with a threshold  of  .5 we do not make a single wrong classification. The True positive rate and False positive rate are 1 and 0, respectively. But we can shift the threshold. In that case, we will  get different confusion matrices. First we plot threshold vs. TPR.

We see for most values of threshold the TPR is close to 1 which again proves data is easy to classify and the classifier is returning high probabilities  for the most of positives .

Similarly Let’s plot threshold vs. FPR.

For most of the data points FPR is close to zero. This is also good. Now its time to plot the ROC curve using these results (TPR vs FPR).

Let’s try to interpret  the results,  all the points lie on line x=0 and y=1, it means for all the points FPR is zero or TPR is one, making  the curve a square. which means the classifier does perfectly well.

Case with overlapping  population distribution

The above example was about a perfect classifer. However, life is often not so easy. Now let us consider another more realistic situation in which the parameter distribution of the population is not as distinct as in the previous case. Rather, the mean of the parameter with healthy and not healthy datapoints are close and the distributions overlap, as shown in the next figure.
If we set the threshold to 0.5, the confusion matrix may look like this.

Now, any new choice of threshold location will affect both false positives and false negatives. In fact, there is a trade-off. If we shift the threshold with the goal to reduce false negatives, false positives will increase. If we move the threshold to the other direction and reduce false positive, false negatives will increase.

The plots (TPR vs Threshold) , (FPR vs Threshold) are shown below

If we plot the ROC curve from these results, it looks like this:

From the curve we see the classifier does not perform as well as the earlier one.

What else can be infered from this curve? We first need to understand what the diagonal in this plot represent. The diagonal represents ‘Line of no discrimination’, which we obtain if we randomly guess. This is the ROC curve for the worst possible classifier. Therefore, by comparing the obtained ROC curve with the diagonal, we see how much better our classifer is from random guessing.

The further away ROC curve from the diagonal is (the closest it is to the top left corner) , better the classifier is.

Area Under the curve

The overall performance of the classifier is given by the area under the ROC curve and is usually denoted as AUC. Since TPR and FPR lie within the range of 0 to 1, the AUC also assumes values between 0 and 1. The higher the value of AUC, the better is the overall performance of the classifier.

Let’s see this for the two different distributions which we saw earlier.

As we know the classifier had worked perfectly in the first case with points at (0,1) the area under the curve is 1 which is perfect. In the latter case the classifier was not able to perform as good, the ROC curve is between the diagonal and left hand corner. The AUC as we can see is less than 1.

Some other general characteristics

There are still few points that needs to be discussed on a General ROC curve

  • The ROC curve does not provide information about the actual values of thresholds used for the classifier.
  • Performance of different classifiers can be compared using the AUC of different Classifier. The larger the AUC, the better the classifier.
  • The vertical distance of the ROC curve from the no discrimination line gives a measure of ‘INFORMEDNESS’. This is known as Youden’s J satistic. This statistics can take values between 0 and 1.

Youden’s  J statistic is defined for every point on the ROC curve . The point at which Youden’s  J satistics reaches its maximum for a given ROC curve can be used to guide the selection of the threshold to be used for that classifier.
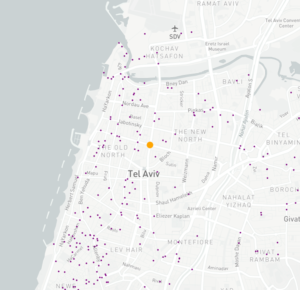
I hope this post does the job of providing an understanding of ROC curves  and AUC. The  Python program for simulating the example given earlier can be found here .

Please feel free to adjust the mean of the distributions and see the changes in the plot.