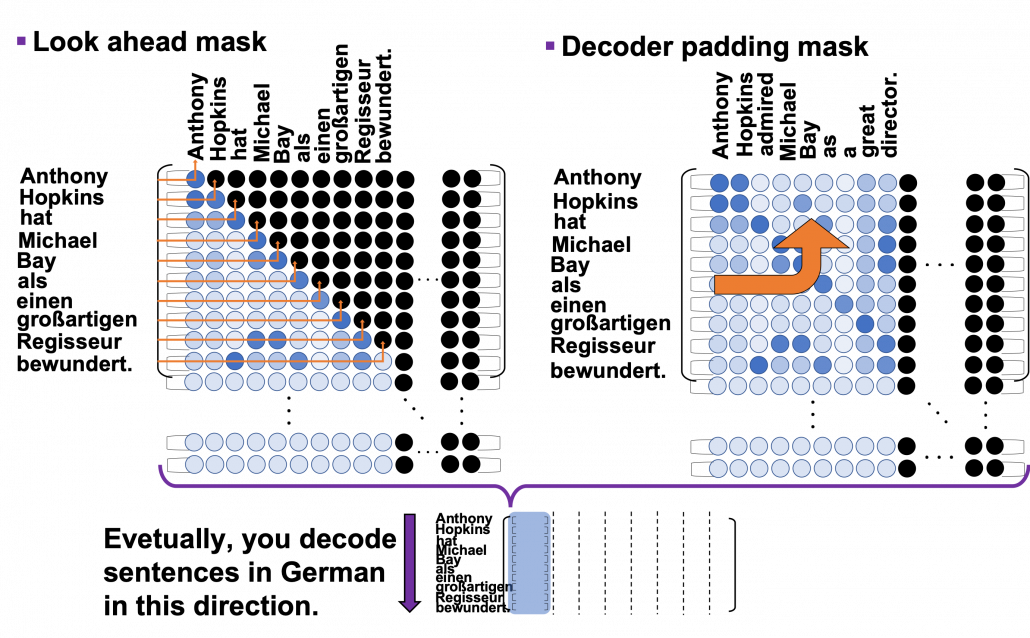
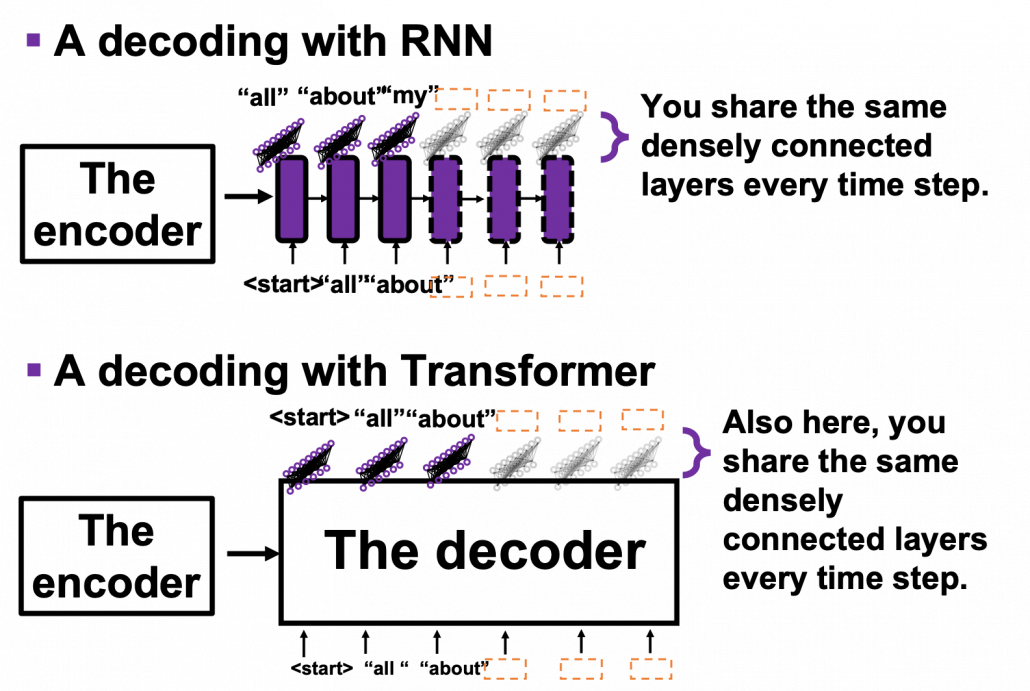
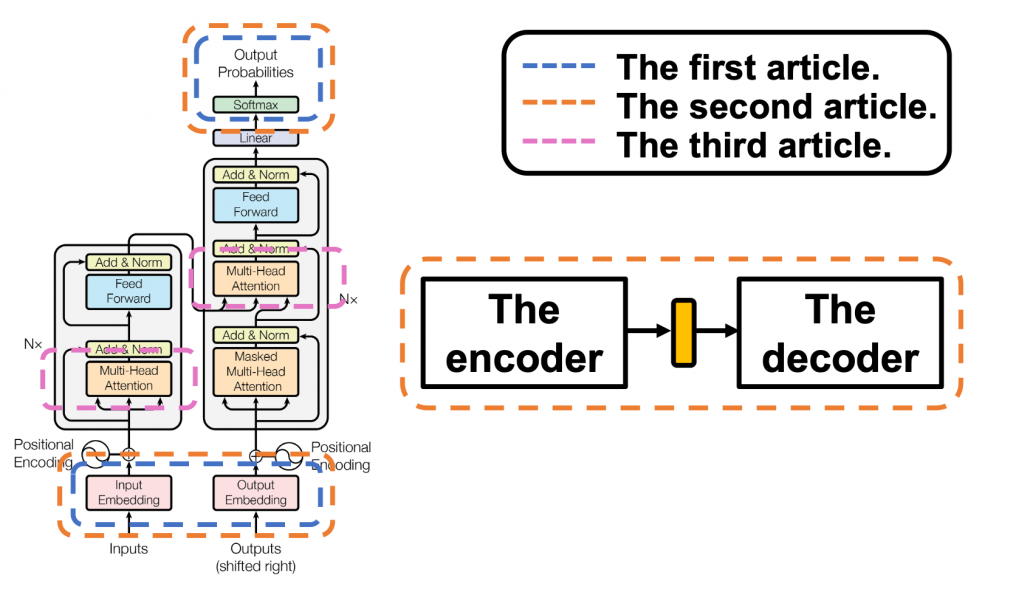
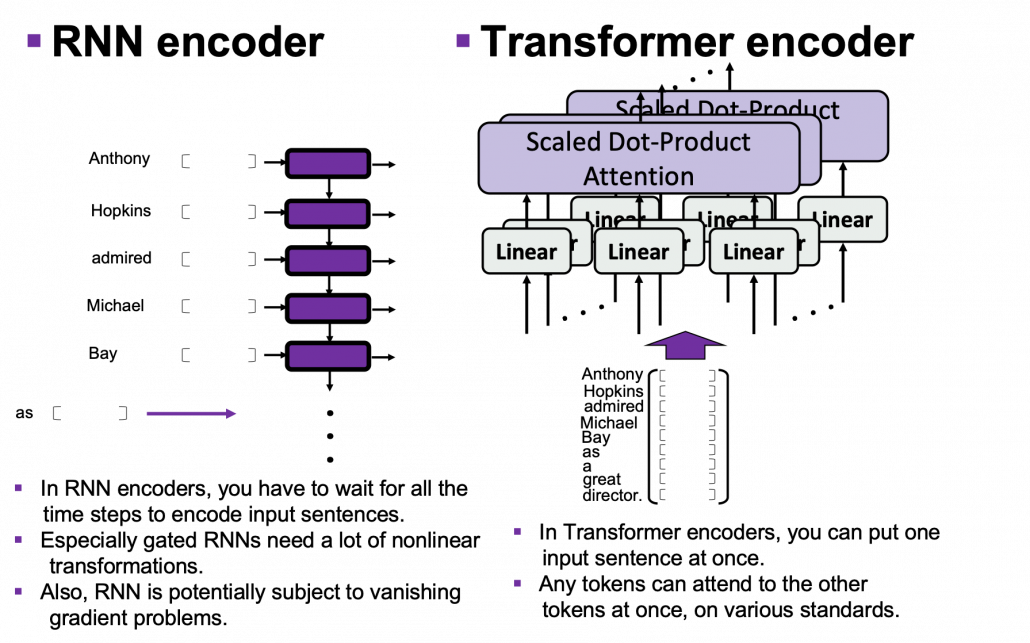
Tag Archive for: Machine Learning

Four essential ideas for making reinforcement learning and dynamic programming more effective

This is the third article of the series My elaborate study notes on reinforcement learning.

1, Some excuses for writing another article on the same topic

In the last article I explained policy iteration and value iteration of dynamic programming (DP) because DP is the foundation of reinforcement learning (RL). And in fact this article is a kind of a duplicate of the last one. Even though I also tried my best on the last article, I would say it was for superficial understanding of how those algorithms are implemented. I think that was not enough for the following two reasons. The first reason is that what I explained in the last article was virtually just about how to follow pseudocode of those algorithms like other study materials. I tried to explain them with a simple example and some diagrams. But in practice it is not realistic to think about such diagrams all the time. Also writing down Bellman equations every time is exhausting. Thus I would like to introduce Bellman operators, powerful tools for denoting Bellman equations briefly. Bellman operators would help you learn RL at an easier and more abstract level.

The second reason is that relations of values and policies are important points in many of RL algorithms. And simply, one article is not enough to realize this fact. In the last article I explained that policy iteration of DP separately and interactively updates a value and a policy. These procedures can be seen in many RL algorithms. Especially a family of algorithms named actor critic methods use this structure more explicitly. In the algorithms “actor” is in charge of a policy and a “critic” is in charge of a value. Just as the “critic” gives some feedback to the “actor” and the “actor” update his acting style, the value gives some signals to the policy for updating itself. Some people say RL algorithms are generally about how to design those “actors” and “critics.” In some cases actors can be very influential, but in other cases the other side is more powerful. In order to be more conscious about these interactive relations of policies and values, I have to dig the ideas behind policy iteration and value iteration, but with simpler notations.

Even though this article shares a lot with the last one, without pinning down the points I am going to explain, your study of RL could be just a repetition of following pseudocode of each algorithm. But instead I would rather prefer to make more organic links between the algorithms while studying RL. This article might be tiresome to read since it is mainly theoretical sides of DP or RL. But I would like you to patiently read through this to more effectively learn upcoming RL algorithms, and I did my best to explain them again in graphical ways.

2, RL and plannings as tree structures

Some tree structures have appeared so far in my article, but some readers might be still confused how to look at this. I must admit I lacked enough explanations on them. Thus I am going to review Bellman equation and give overall instructions on how to see my graphs. I am trying to discover effective and intuitive ways of showing DP or RL ideas. If there is something unclear of if you have any suggestions, please feel free to leave a comment or send me an email.

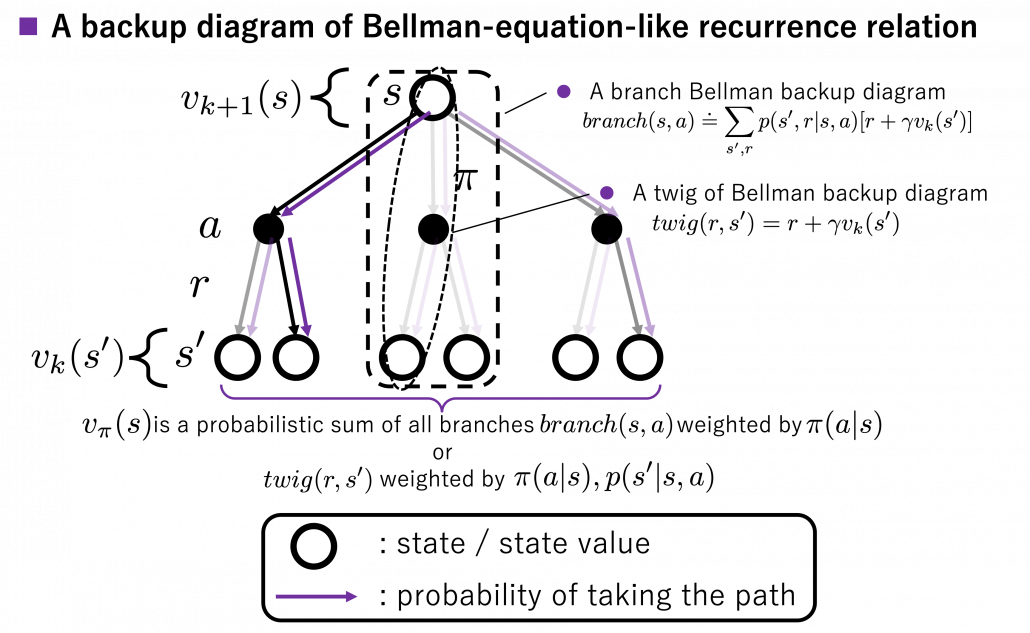
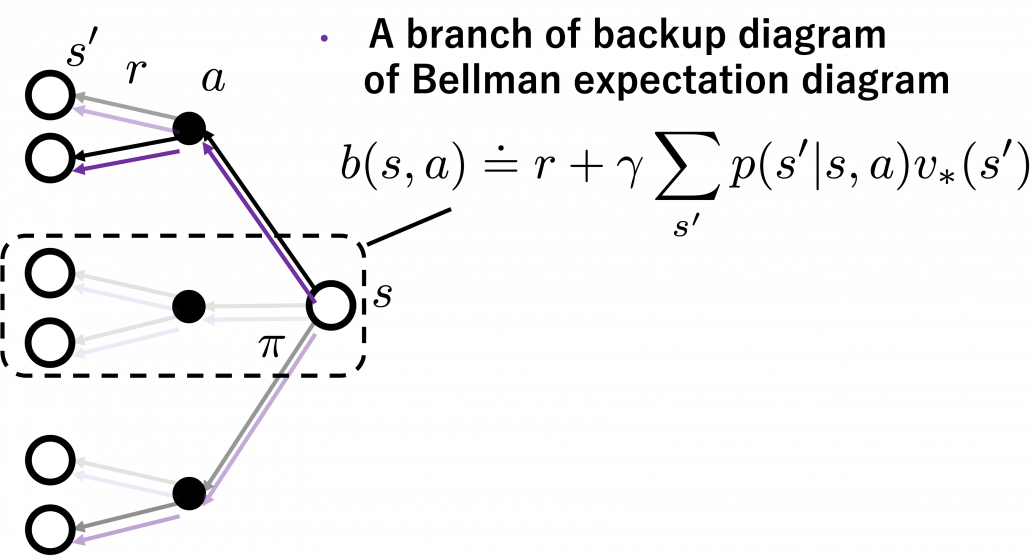
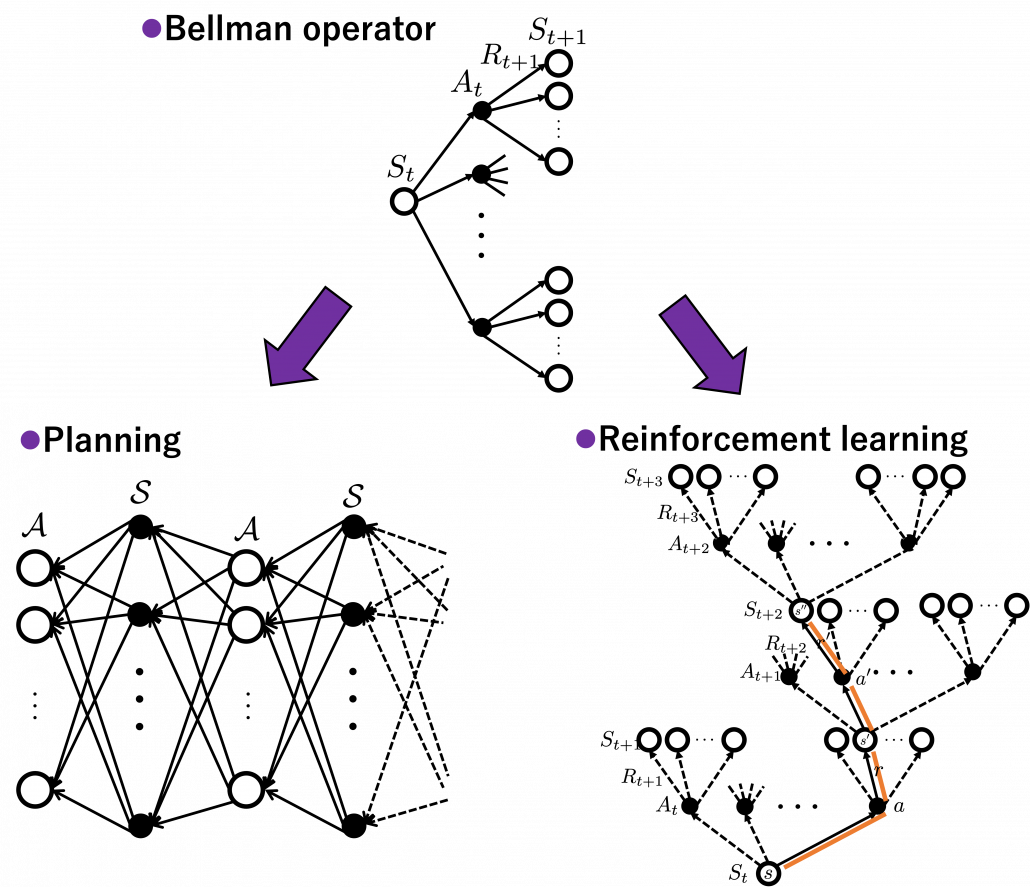
I got inspiration from Backup diagrams of Bellman equations introduced in the book by Barto and Sutton when I started making the graphs in this article series. The back up diagrams are basic units of tree structures in RL, and they are composed of white nodes showing states s and black nodes showing actions a. And when an agent goes from a node a to the next state s', it gets a corresponding reward r. As I explained in the second article, a value of a state s is calculated by considering all possible actions and corresponding next states s', and resulting rewards r, starting from s. And the backup diagram shows the essence of how a value of s is calculated.

*Please let me call this figure a backup diagram of “Bellman-equation-like recurrence relation,” instead of Bellman equation. Bellman equation holds only when v_{\pi}(s) is known, and v_{\pi}(s) is usually calculated from the recurrence relation. We are going to see this fact in the rest part of this article, making uses of Bellman operators.

Let’s again take a look at the definition of v_{\pi}(s), a value of a state s for a policy \pi. v_{\pi}(s) is defined as an expectation of a sum of upcoming rewards R_t, given that the state at the time step t is s. (Capital letters are random variables and small letters are their realized values.)

v_{\pi} (s)\doteq \mathbb{E}_{\pi} [ G_t | S_t =s ] =\mathbb{E}_{\pi} [ R_{t+1} + \gamma R_{t+2} + \gamma ^2 R_{t+3} + \cdots + \gamma ^{T-t -1} R_{T} |S_t =s]

*To be exact, we need to take the limit of T like T \to \infty. But the number T is limited in practical discussions, so please don’t care so much about very exact definitions of value functions in my article series.

But considering all the combinations of actions and corresponding rewards are not realistic, thus Bellman equation is defined recursively as follows.

v_{\pi} (s)= \mathbb{E}_{\pi} [ R_{t+1} + \gamma v_{\pi}(S_{t+1}) | S_t =s ]

But when you want to calculate v_{\pi} (s) at the left side, v_{\pi} (s) at the right side is supposed to be unknown, so we use the following recurrence relation.

v_{k+1} (s)\doteq \mathbb{E}_{\pi} [ R_{t+1} + \gamma v_{k}(S_{t+1}) | S_t =s ]

And the operation of calculating an expectation with \mathbb{E}_{\pi}, namely a probabilistic sum of future rewards is defined as follows.

v_{k+1} (s) = \mathbb{E}_{\pi} [R_{t+1} + \gamma v_k (S_{t+1}) | S_t = s] \doteq \sum_a {\pi(a|s)} \sum_{s', r} {p(s', r|s, a)[r + \gamma v_k(s')]}

\pi(a|s) are policies, and p(s', r|s, a) are probabilities of transitions. Policies are probabilities of taking an action a given an agent being in a state s. But agents cannot necessarily move do that based on their policies. Some randomness or uncertainty of movements are taken into consideration, and they are modeled as probabilities of transitions. In my article, I would like you to see the equation above as a sum of branch(s, a) weighted by \pi(a|s) or a sum of twig(r, s') weighted by \pi(a|s), p(s' | s, a). “Branches” and “twigs” are terms which I coined.

*Even though especially values of branch(s, a) are important when you actually implement DP, they are not explicitly defined with certain functions in most study materials on DP.

I think what makes the backup diagram confusing at the first glance is that nodes of states in white have two layers, a layer s and the one of s'. But the node s is included in the nodes of s'. Let’s take an example of calculating the Bellman-equation-like recurrence relations with a grid map environment. The transitions on the backup diagram should be first seen as below to avoid confusion. Even though the original backup diagrams have only one root node and have three layers, in actual models of environments transitions of agents are modeled as arows going back and forth between white and black nodes.
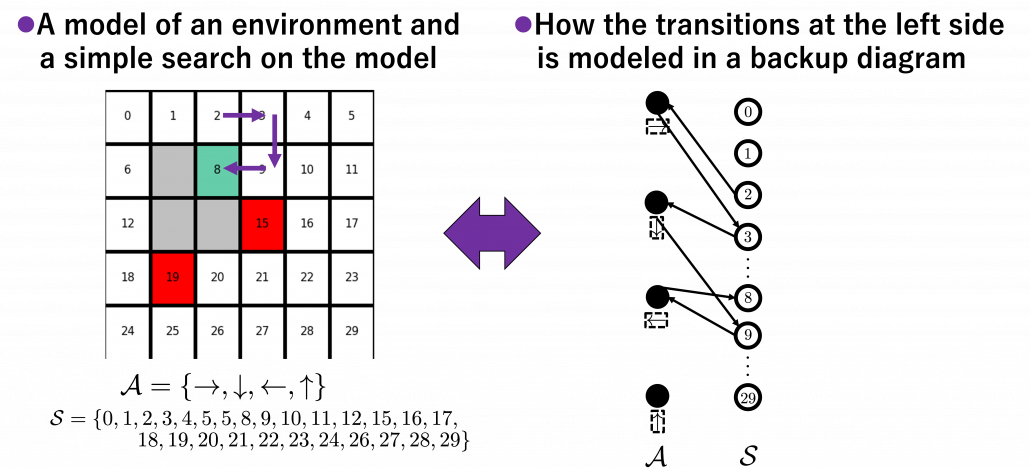
But in DP values of states, namely white nodes have to be updated with older values. That is why the original backup diagrams have three layers. For exmple, the value of a value v_{k+1}(9) is calculated like in the figure below, using values of v_{k}(s'). As I explained earlier, the value of the state 9 is a sum of branch(s, a), weighted by \pi(\rightarrow | 9), \pi(\downarrow | 9), \pi(\leftarrow | 9), \pi(\uparrow | 9). And I showed the weight as strength of purple color of the arrows. r_a, r_b, r_c, r_d are corresponding rewards of each transition. And importantly, the Bellman-equation-like operation, whish is a part of DP, is conducted inside the agent. The agent does not have to actually move, and that is what planning is all about.
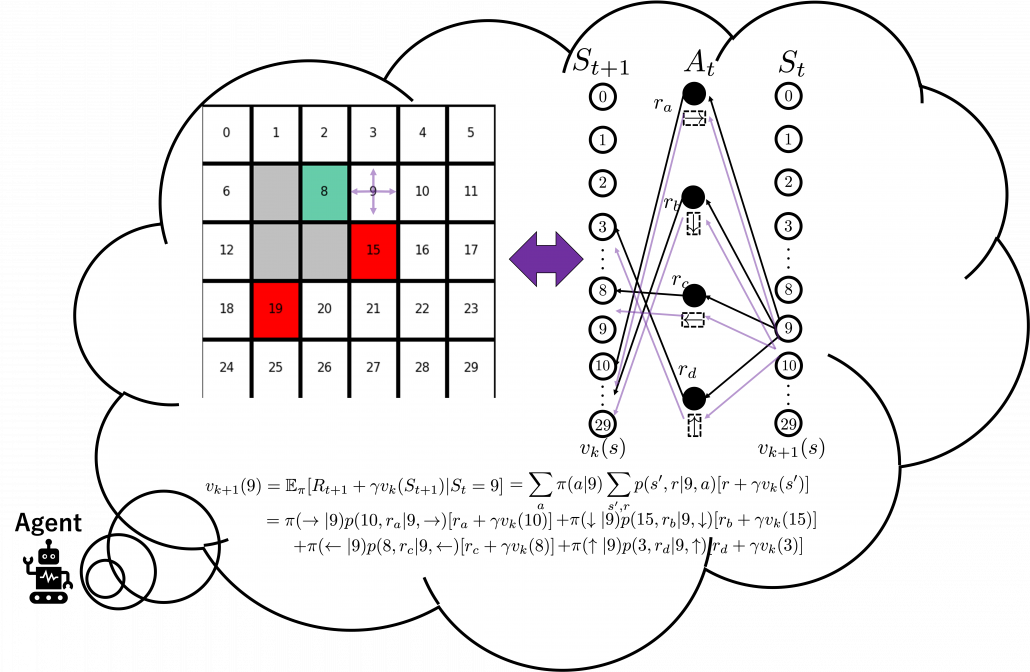
And DP, or more exactly policy evaluation, calculating the expectation over all the states, repeatedly. An important fact is, arrows in the backup diagram are pointing backward compared to the direction of value functions being updated, from v_{k}(s) to v_{k+1}(s). I tried to show the idea that values v_{k}(s) are backed up to calculate v_{k+1}(s). In my article series, with the right side of the figure below, I make it a rule to show the ideas that a model of an environment is known and it is updated recursively.

3, Types of policies

As I said in the first article, the ultimate purpose of DP or RL is finding the optimal policies. With optimal policies agents are the most likely to maximize rewards they get in environments. And policies \pi determine the values of states as value functions v_{\pi}(s). Or policies can be obtained from value functions. This structure of interactively updating values and policies is called general policy iteration (GPI) in the book by Barto and Sutton.
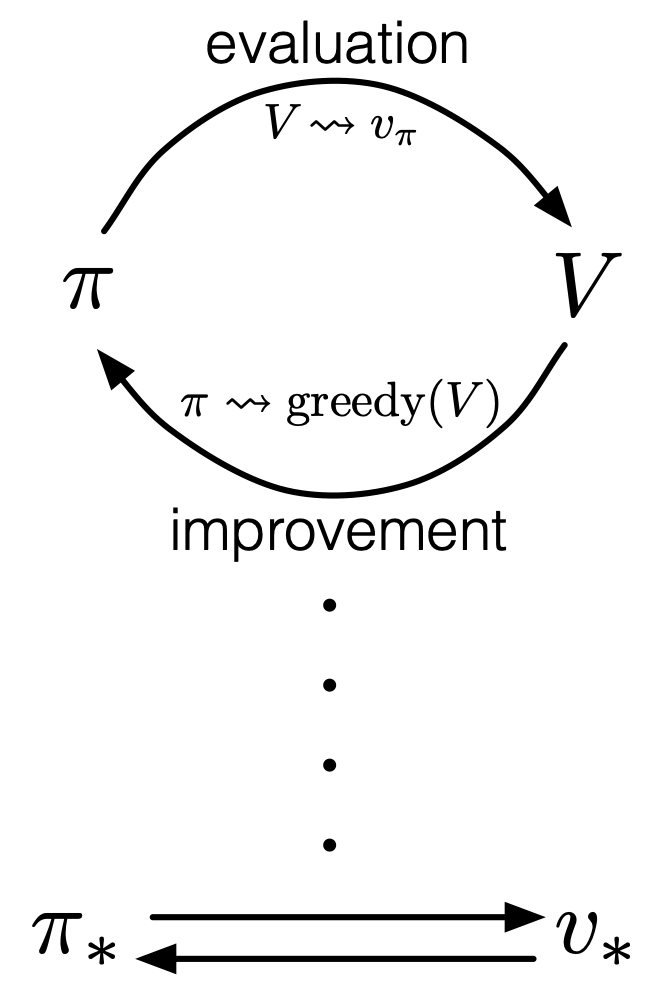
Source: Richard S. Sutton, Andrew G. Barto, “Reinforcement Learning: An Introduction,” MIT Press, (2018)

However I have been using the term “a policy” without exactly defining it. There are several types of policies, and distinguishing them is more or less important in the next sections. But I would not like you to think too much about that. In conclusion, only very limited types of policies are mainly discussed in RL. Only \Pi ^{\text{S}}, \Pi ^{\text{SD}} in the figure below are of interest when you learn RL as a beginner. I am going to explain what each set of policies means one by one.
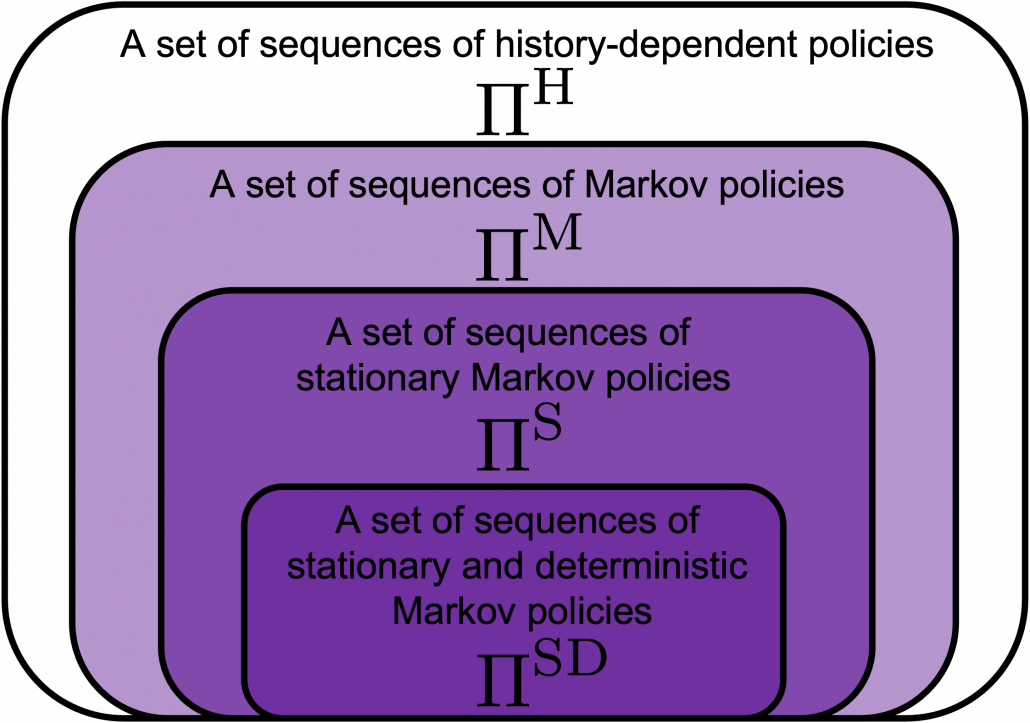
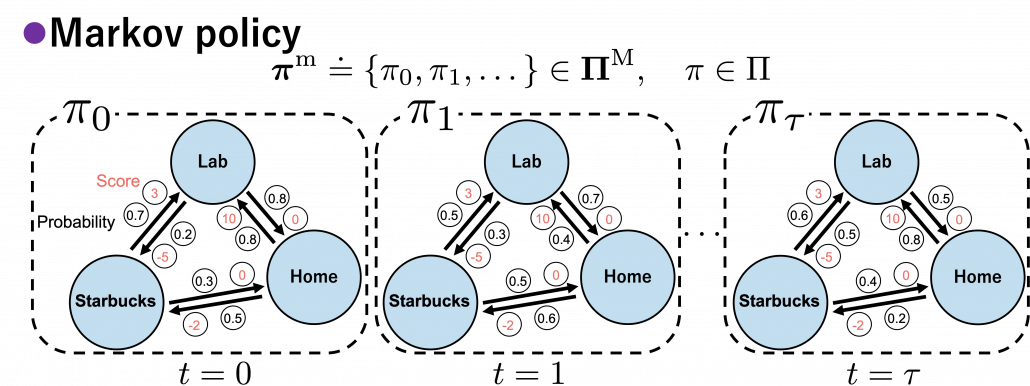
In fact we have been discussing a set of policies \Pi ^{\text{S}}, which mean probabilistic Markov policies. Remember that in the first article I explained Markov decision processes can be described like diagrams of daily routines. For example, the diagrams below are my daily routines. The indexes t denote days. In either of states “Home,” “Lab,” and “Starbucks,” I take an action to another state. The numbers in black are probabilities of taking the actions, and those in orange are rewards of taking the actions. I also explained that the ultimate purpose of planning with DP is to find the optimal policy in this state transition diagram.
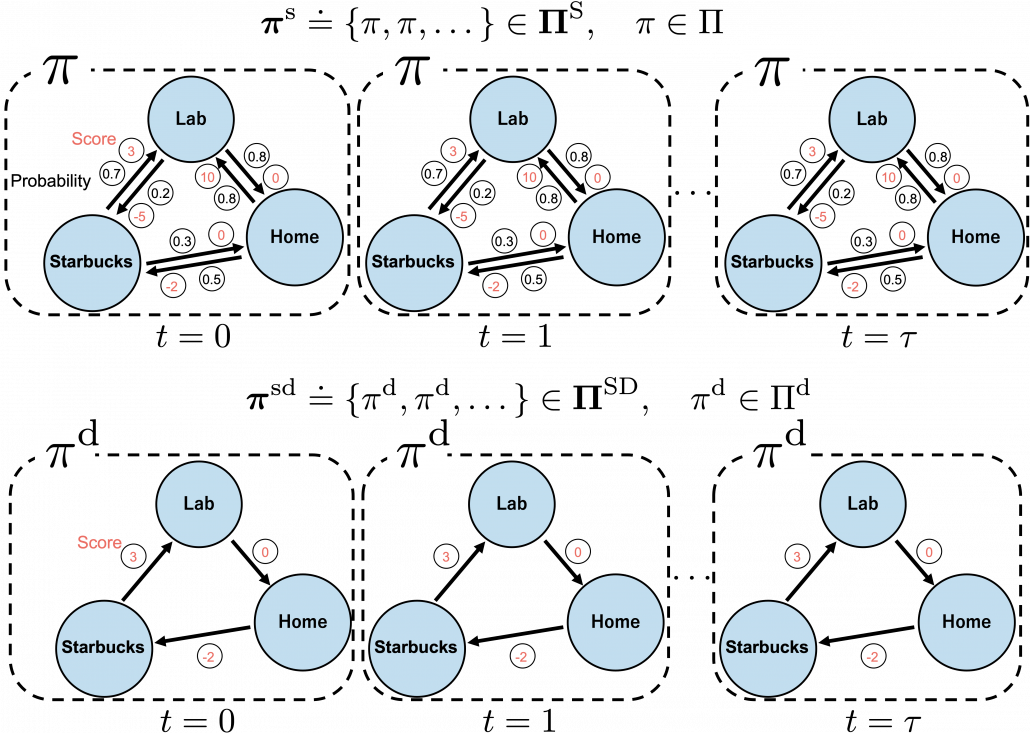
Before explaining each type of sequences of policies, let me formulate probabilistic Markov policies at first. A set of probabilistic Markov policies is defined as follows.
\Pi \doteq \biggl\{ \pi : \mathcal{A}\times\mathcal{S} \rightarrow [0, 1]: \sum_{a \in \mathcal{A}}{\pi (a|s) =1, \forall s \in \mathcal{S} } \biggr\}
This means \pi (a|s) maps any combinations of an action a\in\mathcal{A} and a state s \in\mathcal{S} to a probability. The diagram above means you choose a policy \pi from the set \Pi, and you use the policy every time step t, I mean every day. A repetitive sequence of the same probabilistic Markov policy \pi is defined as \boldsymbol{\pi}^{\text{s}} \doteq \{\pi, \pi, \dots \} \in \boldsymbol{\Pi} ^{\text{S}}. And a set of such stationary Markov policy sequences is denoted as \boldsymbol{\Pi} ^{\text{S}}.

*As I formulated in the last articles, policies are different from probabilities of transitions. Even if you take take an action probabilistically, the action cannot necessarily be finished. Thus probabilities of transitions depend on combinations of policies and the agents or the environments.

But when I just want to focus on works like a robot, I give up living my life. I abandon efforts of giving even the slightest variations to my life, and I just deterministically take next actions every day. In this case, we can say the policies are stationary and deterministic. The set of such policies is defined as below. \pi ^{\text{d}} are called deterministic policies.\Pi ^\text{d} \doteq \bigl\{ \pi ^\text{d} : \mathcal{A}\rightarrow \mathcal{S} \bigr\}

I think it is normal policies change from day to day, even if people also have only options of “Home,” “Lab,” or “Starbucks.” These cases are normal Markov policies, and you choose a policy \pi from \Pi every time step.

And the resulting sequences of policies and the set of the sequences are defined as \boldsymbol{\pi}^{\text{m}} \doteq \{\pi_0, \pi_1, \dots \} \in \boldsymbol{\Pi} ^{\text{M}}, \quad \pi_t \in \Pi.

In real world, an assumption of Markov decision process is quite unrealistic because your strategies constantly change depending on what you have done or gained so far. Possibilities of going to a Starbucks depend on what you have done in the week so far. You might order a cup of frappucino as a little something for your exhausting working days. There might be some communications on what you order then with clerks. And such experiences would affect your behaviors of going to Starbucks again. Such general and realistic policies are called history-dependent policies.

*Going to Starbucks everyday like a Markov decision process and deterministically ordering a cupt of hot black coffee is supposed to be unrealistic. Even if clerks start heating a mug as soon as I enter the shop.
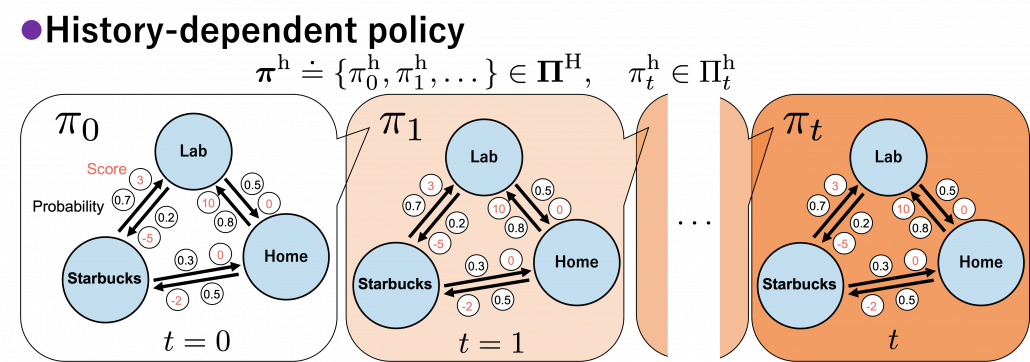
In history-dependent cases, your policies depend on your states, actions, and rewards so far. In this case you take actions based on history-dependent policies \pi _{t}^{\text{h}}. However as I said, only \Pi ^{\text{S}}, \Pi ^{\text{SD}} are important in my articles. And history-dependent policies are discussed only in partially observable Markov decision process (POMDP), which this article series is not going to cover. Thus you have only to take a brief look at how history-dependent ones are defined.

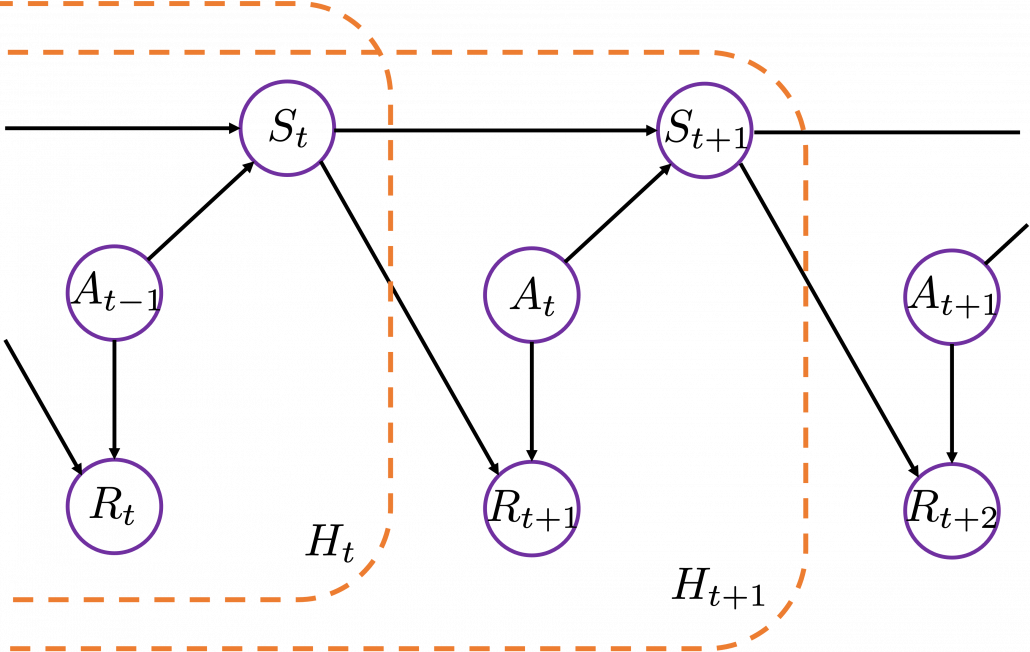
History-dependent policies are the types of the most general policies. In order to formulate history-dependent policies, we first have to formulate histories. Histories h_t \in \mathcal{H}_t in the context of DP or RL are defined as follows.

h_t \doteq \{s_0, a_0, r_0, \dots , s_{t-1}, a_{t-1}, r_{t}, s_t\}

Given the histories which I have defined, a history dependent policy is defined as follows.

\pi_{t}^{\text{h}}(a|h_t) \doteq \text{Pr}(A=a | H_t = h_t)

This means a probability of taking an action a given a history h_t. It might be more understandable with the graphical model below, which I showed also in the first article. In the graphical model, H_t is a random variable, and h_t is its realized value.


A set of history-dependent policies is defined as follows.

\Pi _{t}^{\text{h}} \doteq \biggl\{ \pi _{t}^{h} : \mathcal{A}\times\mathcal{H}_t \rightarrow [0, 1]: \sum_{a \in \mathcal{A}}{\pi_{t}^{\text{h}} (a|h_{t}) =1 } \biggr\}

And a set of sequences of history-dependent policies is \boldsymbol{\pi}^{\text{h}} \doteq \{\pi^{\text{h}}_0, \pi^{\text{h}}_1, \dots \} \in \boldsymbol{\Pi} ^{\text{H}}, \quad \pi_{t}^{\text{h}} \in \Pi_{t}^{\text{h}}.

In fact I have not defined the optimal value function v_{\ast}(s) or \pi_{\ast} in my article series yet. I must admit it was not good to discuss DP without even defining the important ideas. But now that we have learnt types of policies, it should be less confusing to introduce their more precise definitions now. The optimal value function v_{\ast}: \mathcal{S} \mapsto \mathbb{R} is defined as the maximum value functions for all states s, with respect to any types of sequences of policies \boldsymbol{\pi}.

v_{\ast} \doteq \max_{\boldsymbol{\pi}\in \boldsymbol{\Pi}^{\text{H}}}{v_{\boldsymbol{\pi}(s)}}, \quad \forall s \mathbb{R}

And the optimal policy is defined as the policy which satisfies the equation below.

v_{\ast}(s) = v_{\pi ^{\ast}}(s), \quad \forall s \in \mathcal{S}

The optimal value function is optimal with respect to all the types of sequences of policies, as you can see from the definition. However in fact, it is known that the optimal policy is a deterministic Markov policy \pi ^\text{d} \in \Pi ^\text{d}. That means, in the example graphical models I displayed, you just have to deterministically go back and forth between the lab and the home in order to maximize value function, never stopping by at a Starbucks. Also you do not have to change your plans depending on days.

And when all the values of the states are maximized, you can easily calculate the optimal deterministic policy of your everyday routine. Thus in DP, you first need to maximize the values of the states. I am going to explain this fact of DP more precisely in the next section. Combined with some other important mathematical features of DP, you will have clearer vision on what DP is doing.

*I might have to precisely explain how v_{\boldsymbol{\pi}}(s) is defined. But to make things easier for now, let me skip ore precise formulations. Value functions are defined as expectations of rewards with respect to a single policy or a sequence of policies. You have only to keep it in mind that v_{\boldsymbol{\pi}}(s) is a value function resulting from taking actions based on \boldsymbol{\pi}. And v_{\pi}(s), which we have been mainly discussing, is a value function based on only a single policy \pi.

*Please keep it in mind that these diagrams are not anything like exaggeratedly simplified models for explaining RL. That is my life.

3, Key components of DP

*Even though notations on this article series are based on the book by Barto and Sutton, the discussions in this section are, based on a Japanese book named “Machine Learning Professional Series: Reinforcement Learning” by Tetsurou Morimura, which I call “the whale book.” There is a slight difference in how they calculate Bellman equations. In the book by Barto and Sutton, expectations are calculated also with respect to rewards r, but not in the whale book. I think discussions in the whale book can be extended to the cases in the book by Barto and Sutton, but just in case please bear that in mind.

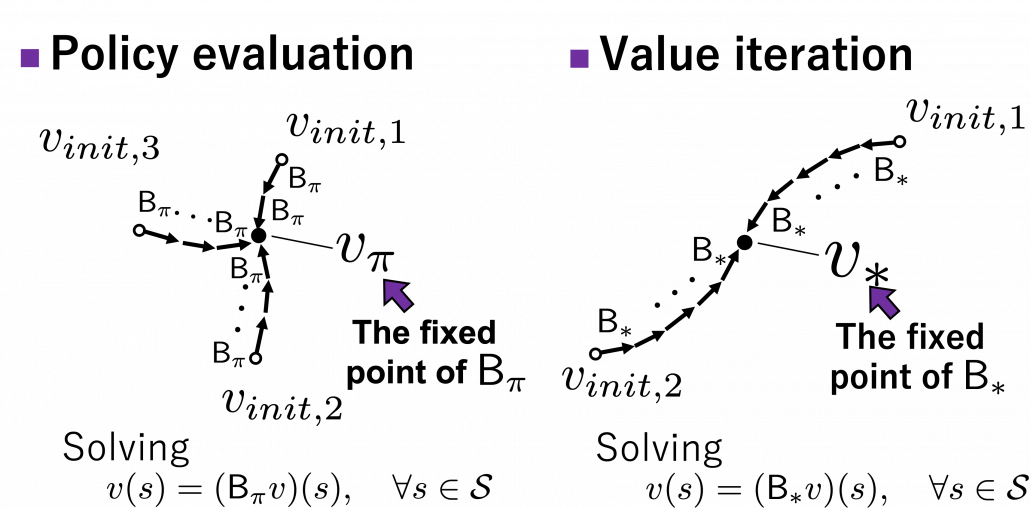
In order to make organic links between the RL algorithms you are going to encounter, I think you should realize DP algorithms you have learned in the last article are composed of some essential ideas about DP. As I stressed in the first article, RL is equal to solving planning problems, including DP, by sampling data through trial-and-error-like behaviors of agents. Thus in other words, you approximate DP-like calculations with batch data or online data. In order to see how to approximate such DP-like calculations, you have to know more about features of those calculations. Those features are derived from some mathematical propositions about DP. But effortlessly introducing them one by one would be just confusing, so I tired extracting some essences. And the figures below demonstrate the ideas.

The figures above express the following facts about DP:

  1. DP is a repetition of Bellman-equation-like operations, and they can be simply denoted with Bellman operators \mathsf{B}_{\pi} or \mathsf{B}_{\ast}.
  2. The value function for a policy \pi is calculated by solving a Bellman equation, but in practice you approximately solve it by repeatedly using Bellman operators.
  3. There exists an optimal policy \pi ^{\ast} \in \Pi ^{\text{d}}, which is deterministic. And it is an optimal policy if and only if it satisfies the Bellman expectation equation v^{\ast}(s) = (\mathsf{B}_{\pi ^{\ast}} v^{\ast})(s), \quad \forall s \in \mathcal{S}, with the optimal value function v^{\ast}(s).
  4. With a better deterministic policy, you get a better value function. And eventually both the value function and the policy become optimal.

Let’s take a close look at what each of them means.

(1) Bellman operator

In the last article, I explained the Bellman equation and recurrence relations derived from it. And they are the basic ideas leading to various RL algorithms. The Bellman equation itself is not so complicated, and I showed its derivation in the last article. You just have to be careful about variables in calculation of expectations. However writing the equations or recurrence relations every time would be tiresome and confusing. And in practice we need to apply the recurrence relation many times. In order to avoid writing down the Bellman equation every time, let me introduce a powerful notation for simplifying the calculations: I am going to discuss RL making uses of Bellman operators from now on.

First of all, a Bellman expectation operator \mathsf{B}_{\pi}: \mathbb{R}^{\mathcal{S}} \rightarrow \mathbb{R}^{\mathcal{S}}, or rather an application of a Bellman expectation operator on any state functions v: \mathcal{S}\rightarrow \mathbb{R} is defined as below.

(\mathsf{B}_{\pi} (v))(s) \doteq \sum_{a}{\pi (a|s)} \sum_{s'}{p(s'| s, a) \biggl[r + \gamma v (s') \biggr]}, \quad \forall s \in \mathcal{S}

For simplicity, I am going to denote the left side of the equation as (\mathsf{B}_{\pi} (v)) (s)=\mathsf{B}_{\pi} (v) \doteq \mathsf{B}_{\pi} v. In the last article I explained that when v_{0}(s) is an arbitrarily initialized value function, a sequence of value functions (v_{0}(s), v_{1}(s), \dots, v_{k}(s), \dots) converge to v_{\pi}(s) for a fixed probabilistic policy \pi, by repeatedly applying the recurrence relation below.

v_{k+1} = \sum_{a}{\pi (a|s)} \sum_{s'}{p(s'| s, a) \biggl[r + \gamma v_{k} (s') \biggr]}

With the Bellman expectation operator, the recurrence relation above is written as follows.

v_{k+1} = \mathsf{B}_{\pi} v_{k}

Thus v_{k} is obtained by applying \mathsf{B}_{\pi} to v_{0} k times in total. Such operation is denoted as follows.

v_{k} = (\mathsf{B}_{\pi}\dots (\mathsf{B}_{\pi} v_{0})\dots) \doteq \mathsf{B}_{\pi} \dots \mathsf{B}_{\pi} v_{0} \doteq \mathsf{B}^k_{\pi} v_{0}

As I have just mentioned, \mathsf{B}^k_{\pi} v_{0} converges to v_{\pi}(s), thus the following equation holds.

\lim_{k \rightarrow \infty} \mathsf{B}^k_{\pi} v_{0} = v_{\pi}(s)

I have to admit I am merely talking about how to change notations of the discussions in the last article, but introducing Bellman operators makes it much easier to learn or explain DP or RL as the figure below shows.
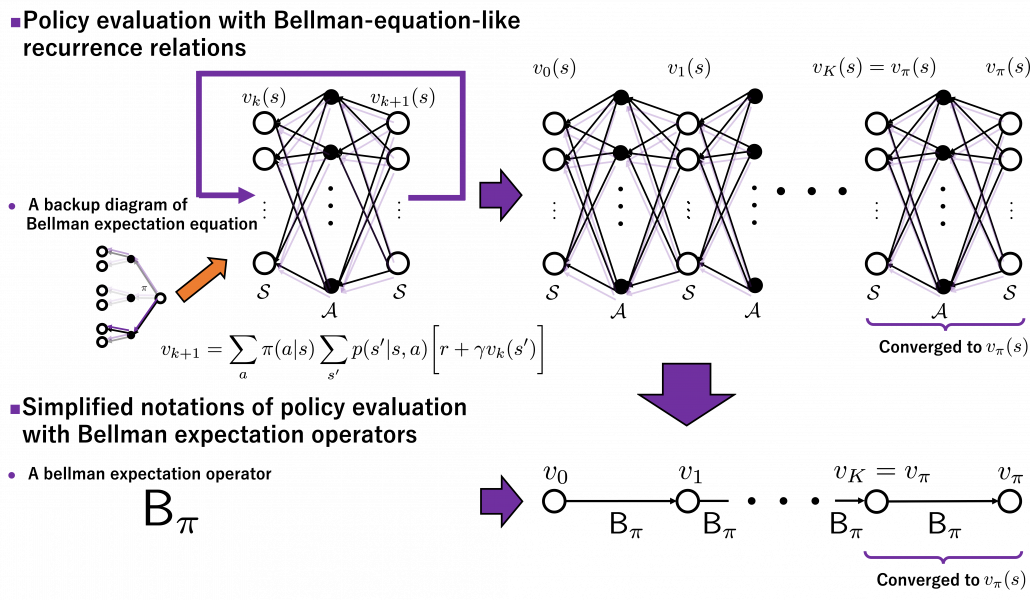
Just as well, a Bellman optimality operator \mathsf{B}_{\ast}: \mathbb{R}^{\mathcal{S}} \rightarrow \mathbb{R}^{\mathcal{S}} is defined as follows.

(\mathsf{B}_{\ast} v)(s) \doteq \max_{a} \sum_{s'}{p(s' | s, a) \biggl[r + \gamma v(s') \biggr]}, \quad \forall s \in \mathcal{S}

Also the notation with a Bellman optimality operators can be simplified as (\mathsf{B}_{\ast} v)(s) \doteq \mathsf{B}_{\ast} v. With a Bellman optimality operator, you can get a recurrence relation v_{k+1} = \mathsf{B}_{\ast} v_{k}. Multiple applications of Bellman optimality operators can be written down as below.

v_{k} = (\mathsf{B}_{\ast}\dots (\mathsf{B}_{\ast} v_{0})\dots) \doteq \mathsf{B}_{\ast} \dots \mathsf{B}_{\ast} v_{0} \doteq \mathsf{B}^k_{\ast} v_{0}

Please keep it in mind that this operator does not depend on policies \pi. And an important fact is that any initial value function v_0 converges to the optimal value function v_{\ast}.

\lim_{k \rightarrow \infty} \mathsf{B}^k_{\ast} v_{0} = v_{\ast}(s)

Thus any initial value functions converge to the the optimal value function by repeatedly applying Bellman optimality operators. This is almost equal to value iteration algorithm, which I explained in the last article. And notations of value iteration can be also simplified by introducing the Bellman optimality operator like in the figure below.
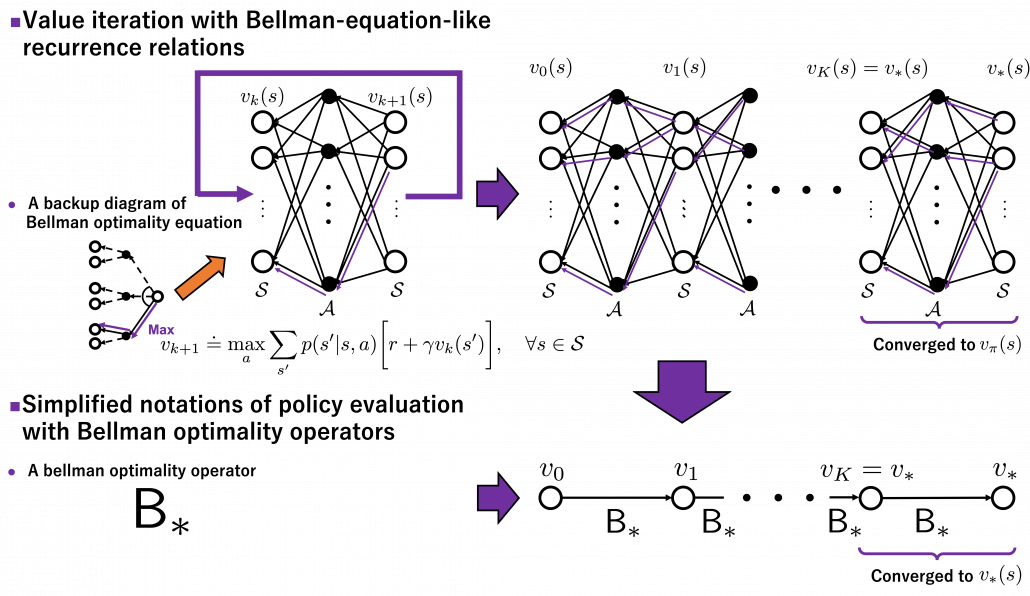
Again, I would like you to pay attention to how value iteration works. The optimal value function v_{\ast}(s) is supposed to be maximum with respect to any sequences of policies \boldsymbol{\pi}, from its definition. However the optimal value function v_{\ast}(s) can be obtained with a single bellman optimality operator \mathsf{B}_{\ast} , never caring about policies. Obtaining the optimal value function is crucial in DP problems as I explain in the next topic. And at least one way to do that is guaranteed with uses of a \mathsf{B}_{\ast}.

*We have seen a case of applying the same Bellman expectation operator on a fixed policy \pi, but you can use different Bellman operators on different policies varying from time steps to time steps. To be more concrete, assume that you have a sequence of Markov policies \boldsymbol{\pi} = \{ \pi_{0},\pi_{1}, \dots, \pi_{k-1} \}\in \boldsymbol{\Pi} ^{\text{M}}. If you apply Bellman operators of the policies one by one in an order of \pi_{k-1}, \pi_{k-2}, \dots, \pi_{k-1} on a state function v, the resulting state function is calculated as below.

\mathsf{B}_{\pi_0}(\mathsf{B}_{\pi_1}\dots (\mathsf{B}_{\pi_{k-1}} v)\dots) \doteq \mathsf{B}_{\pi_0}\mathsf{B}_{\pi_1} \dots \mathsf{B}_{\pi_{k-1}} v \doteq \mathsf{B}^k_{\boldsymbol{\pi}}

When \boldsymbol{\pi} = \{ \pi_{0},\pi_{1}, \dots, \pi_{k-1} \}, we can also discuss convergence of v_{\boldsymbol{\pi}}, but that is just confusing. Please let me know if you are interested.

(2) Policy evaluation

Policy evaluation is in short calculating v_{\pi}, the value function for a policy \pi. And in theory it can be calculated by solving a Bellman expectation equation, which I have already introduced.

v(s) = \sum_{a}{\pi (a|s)} \sum_{s'}{p(s'| s, a) \biggl[r + \gamma v (s') \biggr]}

Using a Bellman operator, which I have introduced in the last topic, the equation above can be written v(s) = \mathsf{B}_{\pi} v(s). But whichever the notation is, the equation holds when the value function v(s) is v_{\pi}(s). You have already seen the major way of how to calculate v_{\pi} in (1), or also in the last article. You have only to multiply the same Belman expectation operator \mathsf{B}_{\pi} to any initial value funtions v_{initial}(s).

This process can be seen in this way: any initial value functions v_{initial}(s) little by little converge to v_{\pi}(s) as the same Bellman expectation operator \mathsf{B}_{\pi} is applied. And when a v_{initial}(s) converges to v_{\pi}(s), the value function does not change anymore because the value function already satisfies a Bellman expectation equation v(s) = \mathsf{B}_{\pi} v(s). In other words v_{\pi}(s) = \mathsf{B}^k_{\pi} v_{\pi}(s), and the v_{\pi}(s) is called the fixed point of \mathsf{B}_{\pi}. The figure below is the image of how any initial value functions converge to the fixed point unique to a certain policy \pi. Also Bellman optimality operators \mathsf{B}_{\ast} also have their fixed points because any initial value functions converge to v_{\ast}(s) by repeatedly applying \mathsf{B}_{\ast}.

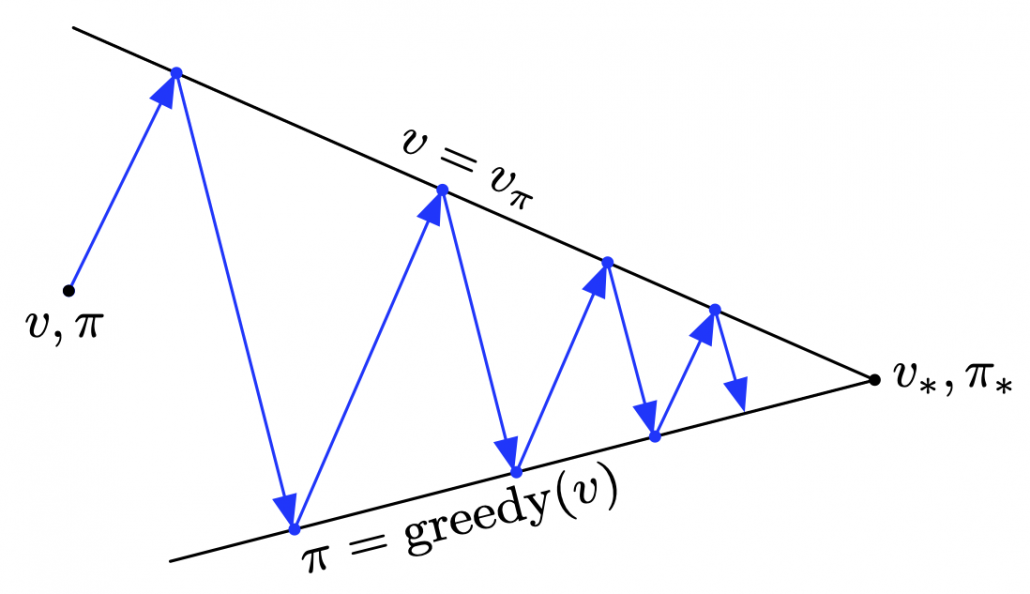
I am actually just saying the same facts as in the topic (1) in another way. But I would like you to keep it in mind that the fixed point of \mathsf{B}_{\pi} is more of a “local” fixed point. On the other hand the fixed point of \mathsf{B}_{\ast} is more like “global.” Ultimately the global one is ultimately important, and the fixed point v_{\ast} can be directly reached only with the Bellman optimality operator \mathsf{B}_{\ast}. But you can also start with finding local fixed points, and it is known that the local fixed points also converge to the global one. In fact, the former case of corresponds to policy iteration, and the latter case to value iteration. At any rate, the goal for now is to find the optimal value function v_{\ast}. Once the value function is optimal, the optimal policy can be automatically obtained, and I am going to explain why in the next two topics.

(3) Existence of the optimal policy

In the first place, does the optimal policy really exist? The answer is yes, and moreover it is a stationary and deterministic policy \pi ^{\text{d}} \in \Pi^{\text{SD}}. And also, you can judge whether a policy is optimal by a Bellman expectation equation below.

    \[v_{\ast}(s) = (\mathsf{B}_{\pi^{\ast} } v_{\ast})(s), \quad \forall s \in \mathcal{S} \]


In other words, the optimal value function v_{\ast}(s) has to be already obtained to judge if a policy is optimal. And the resulting optimal policy is calculated as follows.

    \[\pi^{\text{d}}_{\ast}(s) = \argmax_{a\in \matchal{A}} \sum_{s'}{p(s' | s, a) \biggl[r + \gamma v_{\ast}(s') \biggr]}, \quad \forall s \in \mathcal{S}\]


Let’s take an example of the state transition diagram in the last section. I added some transitions from nodes to themselves and corresponding scores. And all values of the states are initialized as v_{init.}. After some calculations, v_{init.} is optimized to v_{\ast}. And finally the optimal policy can be obtained from the equation I have just mentioned. And the conclusion is “Go to the lab wherever you are to maximize score.”
\begin{figure}[h]
\centering
\includegraphics[width=0.8\textwidth]{./fig/optimal_policy_existence.png}
\end{figure}
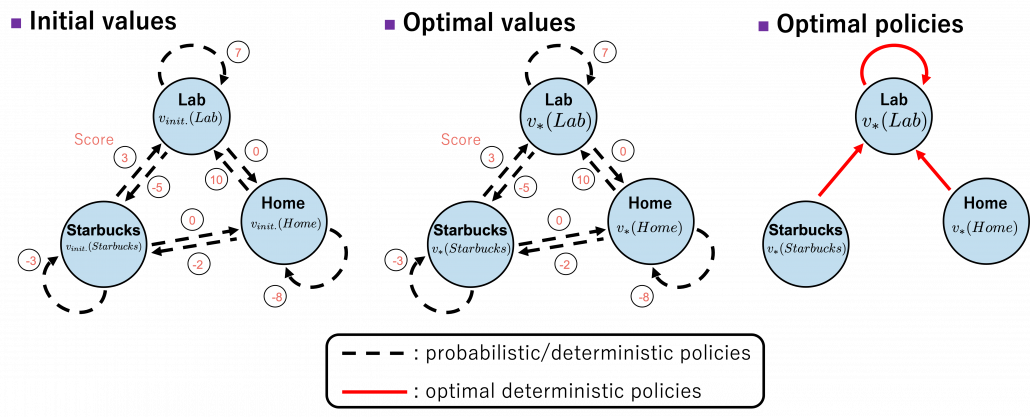

The calculation above is finding an action a which maximizes b(s, a)\doteq\sum_{s'}{p(s' | s, a) \biggl[r + \gamma v_{\ast}(s') \biggr]} = r + \gamma \sum_{s'}{p(s' | s, a) v_{\ast}(s') }. Let me call the part b(s, a) ” a value of a branch,” and finding the optimal deterministic policy is equal to choosing the maximum branch for all s. A branch corresponds to a pair of a state s, a and all the all the states s'.


*We can comprehend applications of Bellman expectation operators as probabilistically reweighting branches with policies \pi(a|s).

*The states s and s' are basically the same. They are just different in uses of indexes for referring them. That might be a confusing point of understanding Bellman equations.

Let’s see how values actually converge to the optimal values and how branches b(s, a). I implemented value iteration of the Starbucks-lab-home transition diagram and visuzlied them with Graphviz. I initialized all the states as 0, and after some iterations they converged to the optimal values. The numbers in each node are values of the sates. And the numbers next to each edge are corresponding values of branches b(a, b). After you get the optimal value, if you choose the direction with the maximum branch at each state, you get the optimal deterministic policy. And that means “Just go to the lab, not Starbucks.”
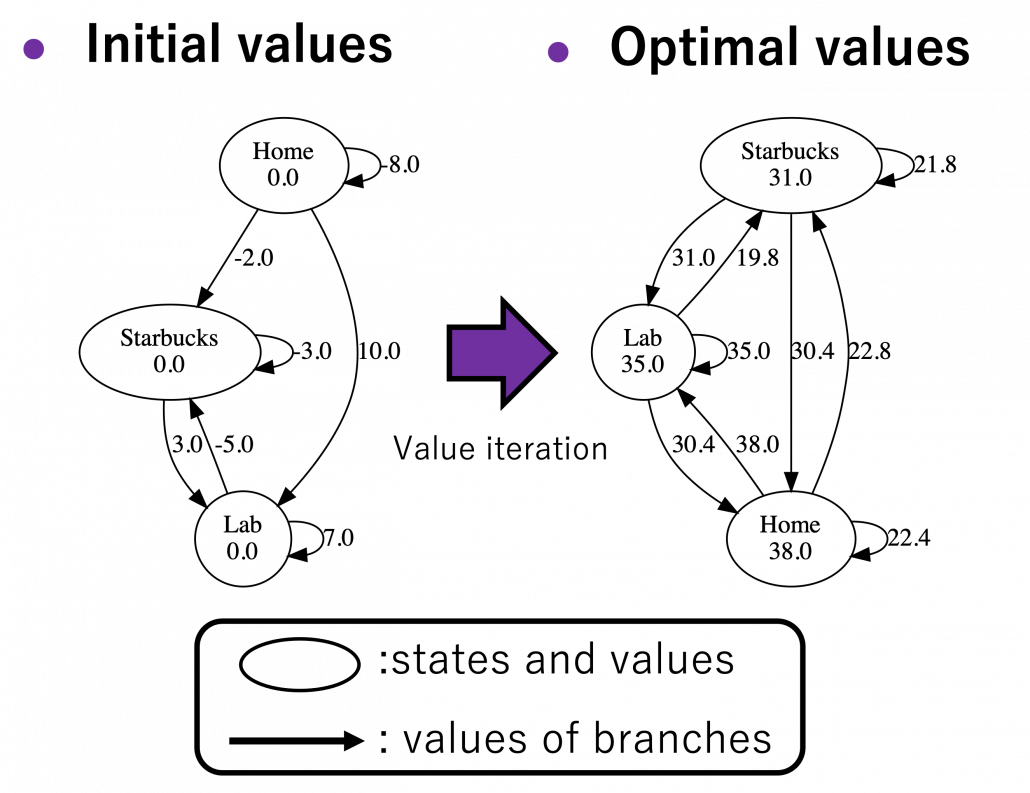
*Discussing and visualizing “branches” of Bellman equations are not normal in other study materials. But I just thought it would be better to see how they change.

(4) Policy improvement

Policy improvement means a very simple fact: in policy iteration algorithm, with a better policy, you get a better value function. That is all. In policy iteration, a policy is regarded as optimal as long as it does not updated anymore. But as far as I could see so far, there is one confusing fact. Even after a policy converges, value functions still can be updated. But from the definition, an optimal value function is determined with the optimal value function. Such facts can be seen in some of DP implementation, including grid map implementation I introduced in the last article.
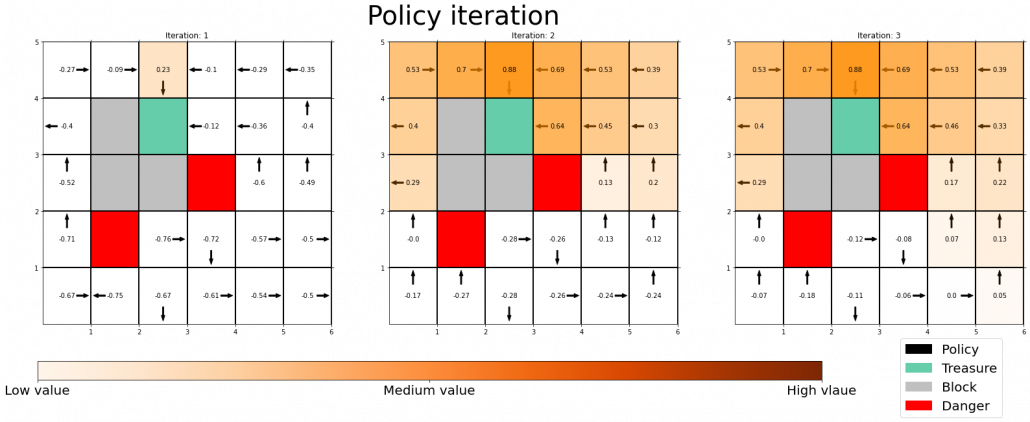

Thus I am not sure if it is legitimate to say whether the policy is optimal even before getting the optimal value function. At any rate, this is my “elaborate study note,” so I conversely ask for some help to more professional someones if they come across with my series. Please forgive me for shifting to the next article, without making things clear.

4, Viewing DP algorithms in a more simple and abstract way

We have covered the four important topics for a better understanding of DP algorithms. Making use of these ideas, pseudocode of DP algorithms which I introduced in the last article can be rewritten in a more simple and abstract way. Rather than following pseudocode of DP algorithms, I would like you to see them this way: policy iteration is a repetation of finding the fixed point of a Bellman operator \mathsf{B}_{\pi}, which is a local fixed point, and updating the policy. Even if the policy converge, values have not necessarily converged to the optimal values.
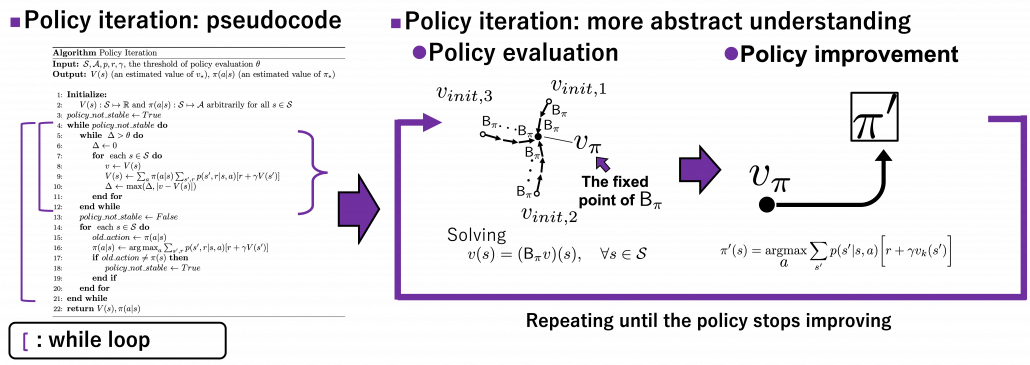

When it comes to value iteration: value iteration is finding the fixed point of \mathsf{B}_{\ast}, which is global, and getting the deterministic and optimal policy.

I have written about DP in as many as two articles. But I would say that was inevitable for laying more or less solid foundation of learning RL. The last article was too superficial and ordinary, but on the other hand this one is too abstract to introduce at first. Now that I have explained essential theoretical parts of DP, I can finally move to topics unique to RL. We have been thinking the case of plannings where the models of the environemnt is known, but they are what agents have to estimate with “trial and errors.” The term “trial and errors” might have been too abstract to you when you read about RL so far. But after reading my articles, you can instead say that is a matter of how to approximate Bellman operators with batch or online data taken by agents, rather than ambiguously saying “trial and erros.” In the next article, I am going to talk about “temporal differences,” which makes RL different from other fields and can be used as data samples to approximate Bellman operators.

* I make study materials on machine learning, sponsored by DATANOMIQ. I do my best to make my content as straightforward but as precise as possible. I include all of my reference sources. If you notice any mistakes in my materials, including grammatical errors, please let me know (email: yasuto.tamura@datanomiq.de). And if you have any advice for making my materials more understandable to learners, I would appreciate hearing it.

How Deep Learning drives businesses forward through automation – Infographic

In cooperation between DATANOMIQ, my consulting company for data science, business intelligence and process mining, and Pixolution, a specialist for computer vision with deep learning, we have created an infographic (PDF) about a very special use case for companies with deep learning: How to protect the corporate identity of any company by ensuring consistent branding with automated font recognition.

How to ensure consistent branding with automatic font recognition - Infographic

How to ensure consistent branding with automatic font recognition – Infographic

The infographic is available as PDF download:

Understanding the “simplicity” of reinforcement learning: comprehensive tips to take the trouble out of RL

*I adjusted mathematical notations in this article as close as possible to “Reinforcement Learning:An Introduction.”  This book by Sutton and Barto is said to be almost mandatory for those who studying reinforcement learning. Also I tried to avoid as much mathematical notations, introducing some intuitive examples. In case any descriptions are confusing or unclear, informing me of that via posts or email would be appreciated.

Preface

First of all, I have to emphasize that I am new to reinforcement learning (RL), and my current field is object detection, to be more concrete transfer learning in object detection. Thus this article series itself is also a kind of study note for me. Reinforcement learning (RL) is often briefly compared with human trial and errors, and actually RL is based on neuroscience or psychology as well as neural networks (I am not sure about these fields though). The word “reinforcement” roughly means associating rewards with certain actions. Some experiments of RL were conducted on animals, which are widely known as Skinner box or more classically Pavlov’s Dogs. In short, you can encourage animals to do something by giving foods to them as rewards, just as many people might have done to their dogs. Before animals find linkages between certain actions and foods as rewards to those actions, they would just keep trial and errors. We can think of RL as a family of algorithms which mimics this behavior of animals trying to obtain as much reward as possible.

*My cats will not all the way try to entertain me to get foods though.

RL showed its conspicuous success in the field of video games, such as Atari, and defeating the world champion of Go, one of the most complicated board games. Actually RL can be applied to not only video games or board games, but also various other fields, such as business intelligence, medicine, and finance, but still I am very much fascinated by its application on video games. I am now studying the field which could bridge between the world of video games and the real world. I would like to mention this in the one of upcoming articles.

So far I got an impression that learning RL ideas would be more challenging than learning classical machine learning or deep learning for the following reasons.

  1. RL is a field of how to train models, rather than how to design the models themselves. That means you have to consider a variety of problem settings, and you would often forget which situation you are discussing.
  2. You need prerequisites knowledge about the models of components of RL for example neural networks, which are usually main topics in machine/deep learning textbooks.
  3. It is confusing what can be learned through RL depending on the types of tasks.
  4. Even after looking over at formulations of RL, it is still hard to imagine how RL enables computers to do trial and errors.

*For now I would like you to keep it in mind that basically values and policies are calculated during in during RL.

And I personally believe you should always keep the following points in your mind in order not to be at a loss in the process of learning RL.

  1.  RL basically can be only applied to a very limited type of situation, which is called Markov decision process (MDP). In MDP settings your next state depends only on your current state and action, regardless of what you have done so far.
  2. You are ultimately interested in learning decision making rules in MDP, which are called policies.
  3. In the first stage of learning RL, you consider surprisingly simple situations. They might be simple like mazes in kids’ picture books.
  4. RL is in its early days of development.

Let me explain a bit more about what I meant by the third point above. I have been learning RL mainly with a very precise Japanese textbook named 「機械学習プロフェッショナルシリーズ 強化学習」(Machine Learning Professional Series: Reinforcement Learning). As I mentioned in an article of my series on RNN, I sometimes dislike Western textbooks because they tend to beat around the bush with simple examples to get to the point at a more abstract level. That is why I prefer reading books of this series in Japanese. And especially the RL one in the series was especially bulky and so abstract and overbearing to a spectacular degree. It had so many precise mathematical notations without leaving room for ambiguity, thus it took me a long time to notice that the book was merely discussing simple situations like mazes in kids’ picture books. I mean, the settings discussed were so simple that they can be expressed as tabular data, that is some Excel sheets.

*I could not notice that until the beginning of 6th chapter out of eight out of 8 chapters. The 6th chapter discusses uses of function approximators. With the approximations you can approximate tabular data. My articles will not dig this topic of approximation precisely, but the use of deep learning models, which I am going to explain someday, is a type of this approximation of RL models.

You might find that so many explanations on RL rely on examples of how to make computers navigate themselves in simple mazes or in playing video games, which are mostly impractical in the real world. However, as I will explain later, these are actually helpful examples to learn RL. As I show later, the relations of an agent and an environment are basically the same also in more complicated tasks. Reading some code or actually implementing RL would be very effective, especially in order to know simplicity of the situations in the beginning part of RL textbooks.

Given that you can do a lot of impressive and practical stuff with current deep learning libraries, you might get bored or disappointed by simple applications of RL in many textbooks. But as I mentioned above, RL is in its early days of development, at least at a public level. And in order to show its potential power, I am going to explain one of the most successful and complicated application of RL in the next article: I am planning to explain how AlphaGo or AplhaZero, RL-based AIs enabled computers to defeat the world champion of Go, one of the most complicated board games.

*RL was not used to the chess AI which defeated Kasparov in 1997. Combination of decision trees and super computers, without RL, was enough for the “simplicity” of chess. But uses of decision tree named Monte Carlo Tree Search enabled Alpha Go to read some steps ahead more effectively.  It is said deep learning enabled AlphaGo to have intuition about games. Mote Carlo Tree Search enabled it to have abilities to predict some steps ahead, and RL how to learn from experience.

1. What is RL?

In conclusion I would interpret RL as follows: RL is a sub-field of training AI models, and optimal rules for decision makings in an environment are learned through RL, weakly supervised by rewards in a certain period of time. When and how to evaluate decision makings are task-specific, and they are often realized by trial-and-error-like behaviors of agents. Rules for decision makings are called policies in contexts of RL. And optimization problems of policies are called sequential decision-making problems.

You are more or less going to see what I meant by my definition throughout my article series.

*An agent in RL means an entity which makes decisions, interacting with the environment with an action. And the actions are made based on policies.

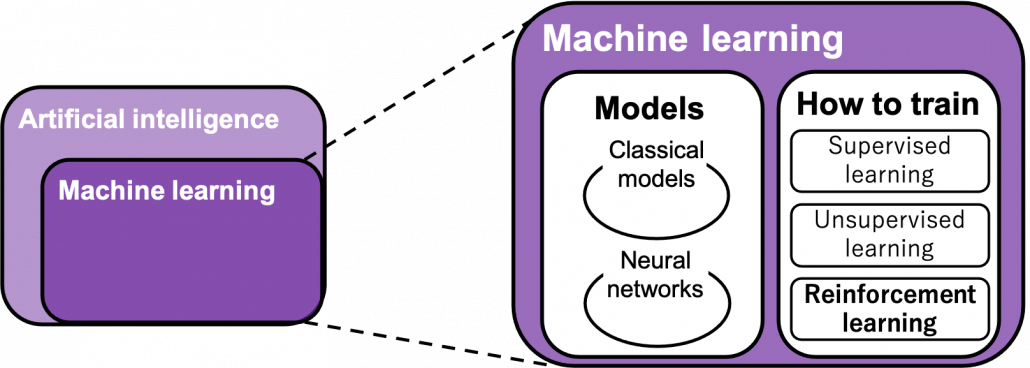
You can find various types of charts explaining relations of RL with AI, and I personally found the chart below the most plausible.

“Models” in the chart are often hyped as “AI” in media today. But AI is a more comprehensive field of trying to realize human-like intellectual behaviors with computers. And machine learning have been the most central sub-field of AI last decades. Around 2006 there was a breakthrough of deep learning. Due to the breakthrough machine learning gained much better performance with deep learning models. I would say people have been calling popular “models” in each time “AI.” And importantly, RL is one field of training models, besides supervised learning and unsupervised learning, rather than a field of designing “AI” models. Some people say supervised learning or unsupervised learning are more preferable than RL because currently these trainings are more likely to be more successful in wide range of fields than RL. And usually the more data you have the more likely supervised or unsupervised learning are.

*The word “models” are used in another meaning later. Please keep it in mind that the “models” above are something like general functions. And the “models” which show up frequently later are functions modeling environments in RL.

*In case you’re totally new to AI and don’t understand what “supervising” means in these contexts, I think you should imagine cases of instructing students in schools. If a teacher just tells students “We have a Latin conjugation test next week, so you must check this section in the textbook.” to students, that’s a “supervised learning.” Students who take exams are “models.” Apt students like machine learning models would show excellent performances, but they might fail to apply the knowledge somewhere else. I mean, they might fail to properly conjugate words in unseen sentences. Next, if the students share an idea “It’s comfortable to get together with people alike.” they might be clustered to several groups. That might lead to “cool guys” or “not cool guys” group division. This is done without any explicit answers, and this corresponds to “unsupervised learning.” In this case, I would say a certain functions of the students’ brain or atmosphere there, which put similar students together, were the “models.” And finally, if teachers tell the students “Be a good student,” that’s what I meant with “weakly supervising.” However most people would say “How?” RL could correspond to such ultimate goals of education, and as well as education, you have to consider how to give rewards and how to evaluate students/agents. And “models” can vary. But such rewards often shows unexpected results.

2. RL and Markov decision process

As I mentioned in a former section, you have to keep it in mind that RL basically can be applied to a limited situation of sequential decision-making problems, which are called Markov decision processes (MDP). A markov decision process is a type of process where the next state of an agent depends only on the current state and the action taken in the current state. I would only roughly explain MDP in this article with a little formulation.

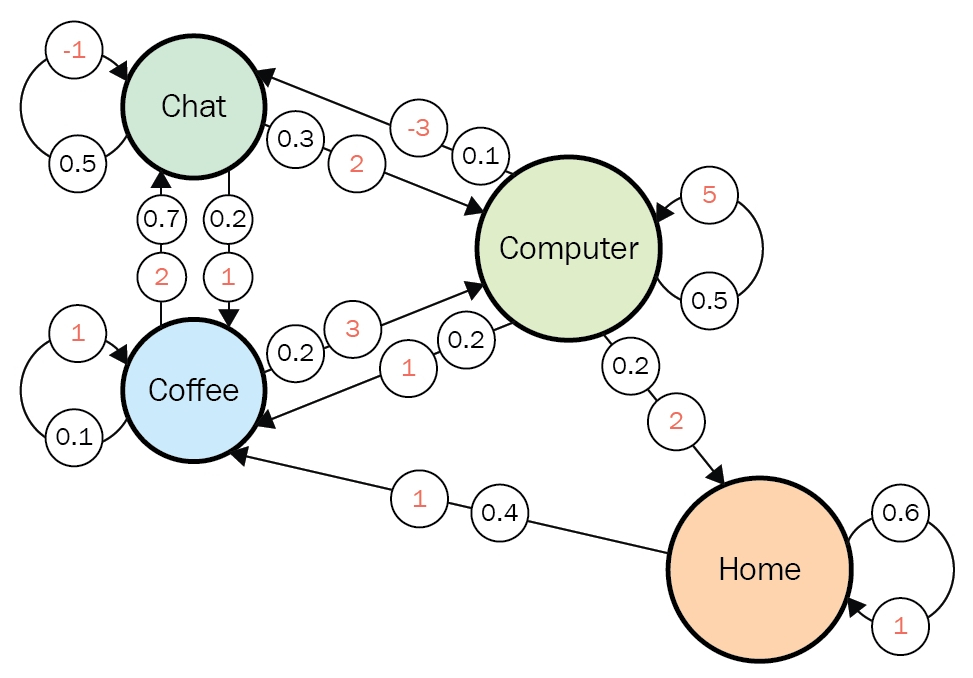
You might find MDPs very simple. But some people would find that their daily lives in fact can be described well with a MDP. The figure below is a state transition diagram of everyday routine at an office, and this is nothing but a MDP. I think many workers also basically have only four states “Chat” “Coffee” “Computer” and “Home” almost everyday.  Numbers in black are possibilities of transitions at the state, and each corresponding number in orange is the reward you get when the action is taken. The diagram below shows that when you just keep using a computer, you would likely to get high rewards. On the other hand chatting with your colleagues would just continue to another term of chatting with a probability of 50%, and that undermines productivity by giving out the reward of -1. And having some coffee is very likely to lead to a chat. In practice, you optimize which action to take in each situation. You adjust probabilities at each state, that is you adjust a policy, through planning or via trial and error.

Source: https://subscription.packtpub.com/book/data/9781788834247/1/ch01lvl1sec12/markov-decision-processes

*Even if you say “Be a good student,” school kids in puberty they would act far from Markov decision process. Even though I took an example of school earlier, I am sure education should be much more complicated process which requires constant patience.

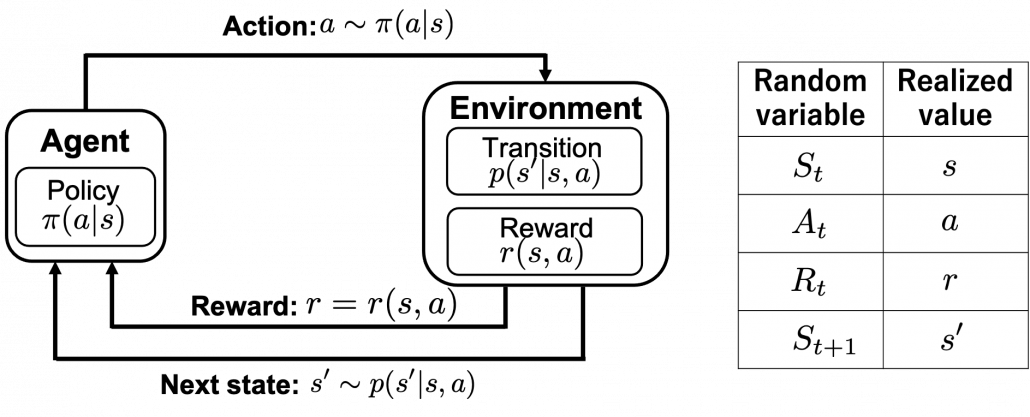
Of course you have to consider much more complicated MDPs in most RL problems, and in most cases you do not have known models like state transition diagrams. Or rather I have to say RL enables you to estimate such diagrams, which are usually called models in contexts of RL, by trial and errors. When you study RL, for the most part you will see a chart like below. I think it is important to understand what this kind of charts mean, whatever study materials on RL you consult. I said RL is basically a training method for finding optimal decision making rules called policies. And in RL settings, agents estimate such policies by taking actions in the environment. The environment determines a reward and the next state based on the current state and the current action of the agent.

Let’s take a close look at the chart above in a bit mathematical manner. I made it based on “Machine Learning Professional Series: Reinforcement Learning.” The agent exert an action a in the environment, and the agent receives a reward r and the next state s'. r and s' are consequences of taking the action a in the state s. The action a is taken based on a conditional probability given s, which is denoted as \pi(a|s). This probability function \pi(a|s) is the very function representing policies, which we want to optimize in RL.

*Please do not think too much about differences of \sim and = in the chart. Actions, rewards, or transitions of states can be both deterministic or probabilistic. In the chart above, with the notation a \sim \pi (a|s) I meant that the action a is taken with a probability of \pi (a|s). And whether they are probabilistic or deterministic is task-specific. Also you should keep it in mind that all the values in the chart are realized values of random variables as I show in the chart at the right side.

In the textbook “Reinforcement Learning:An Introduction” by Richard S. Sutton, which is almost mandatory for all the RL learners, RL process is displayed as the left side of the figure below. Each capital letter in the chart means a random variable. Relations of random variables can be also displayed as graphical models like the right side of the chart. The graphical model is a time series expansion of the chart of RL loops at the left side. The chart below shows almost the same idea as the one above. Whether they use random variables or realized values is the only difference between them. My point is that decision makings are simplified in RL as the models I have explained. Even if some situations are not strictly MDPs, in many cases the problems are approximated as MDPs in practice so that RL can be applied to.

*I personally think you do not have to care so much about differences of random variables and their realized values in RL unless you discuss RL mathmematically. But if you do not know there are two types of notations, which are strictly different ideas, you might get confused while reading textboks on RL. At least in my artile series, I will strictly distinguish them only when their differences matter.

*In case you are not sure about differences of random variables and their realizations, please roughly grasp the terms as follows: random variables X are probabilistic tools for example dices. On the other hand their realized values x are records of them, for example (4, 1, 6, 6, 2, 1, …).  And the probability that a random variable X takes on the value x is denoted as Pr\{X = x\}. And X \sim p means the random variable X is selected from distribution p(x) \doteq \text{Pr} \{X=x\}. In case X is a “dice,” for any x p(x) = \frac{1}{6}.

3. Planning and RL

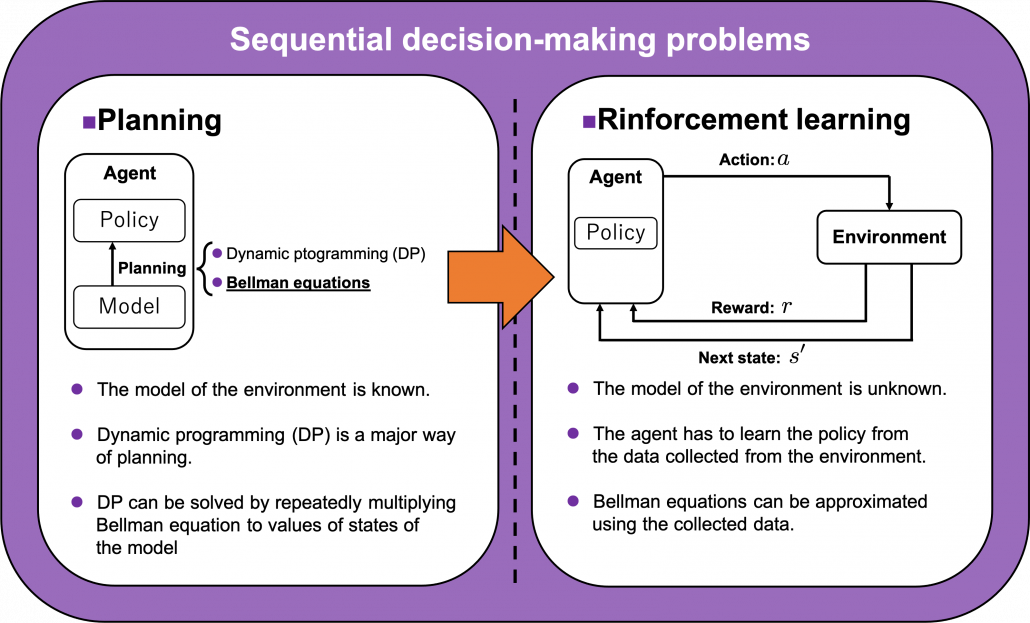
We have seen RL is a family of training algorithms which optimizes rules for choosing A_t = a in sequential decision-making problems, usually assuming them to be MDPs. However I have to emphasize that RL is not the only way to optimize such policies. In sequential decision making problems, when the model of the environment is known, policies can be optimized also through planning without collecting data from the environment. On the other hand, when the model of the environment is unknown policies have to be optimized based on data which an agents collects from the environment through trial and errors. This is the very case called RL. You might find planning problems very simple and unrealistic in practical cases. But RL is based on planning of sequential decision-making problems with MDP settings, so studying planning problems is inevitable.  As far as I could see so far, RL is a family of algorithms for approximating techniques in planning problems through trial and errors in environments. To be more concrete, in the next article I am going to explain dynamic programming (DP) in RL contexts as a major example of planning problems, and a formula called the Bellman equation plays a crucial role in planning. And after that we are going to see that RL algorithms are more or less approximations of Bellman equation by agents sampling data from environments.

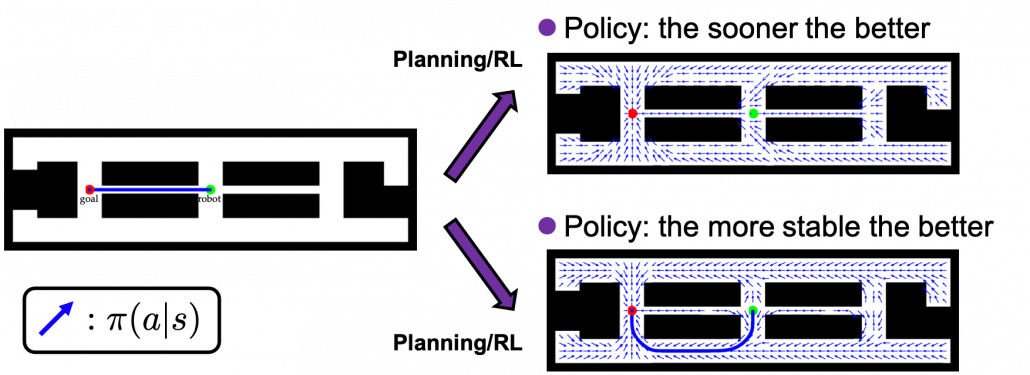
As an intuitive example, I would like to take a case of navigating a robot, which is explained in a famous textbook on robotics named “Probabilistic Robotics”. In this case, the state set \mathcal{S} is the whole space on the map where the robot can move around. And the action set is \mathcal{A} = \{\rightarrow, \searrow, \downarrow, \swarrow \leftarrow, \nwarrow, \uparrow, \nearrow \}. If the robot does not fail to take any actions or there are no unexpected obstacles, manipulating the robot on the map is a MDP. In this example, the robot has to be navigated from the start point as the green dot to the goal as the red dot. In this case, blue arrows can be obtained through planning or RL. Each blue arrow denotes the action taken in each place, following the estimated policy. In other words, the function \pi is the flow of the blue arrows. But policies can vary even in the same problem. If you just want the robot to reach the goal as soon as possible, you might get a blue arrows in the figure at the top after planning. But that means the robot has to pass a narrow street, and it is likely to bump into the walls. If you prefer to avoid such risks, you should adopt policies of choosing wider streets, like the blue arrows in the figure at the bottom.

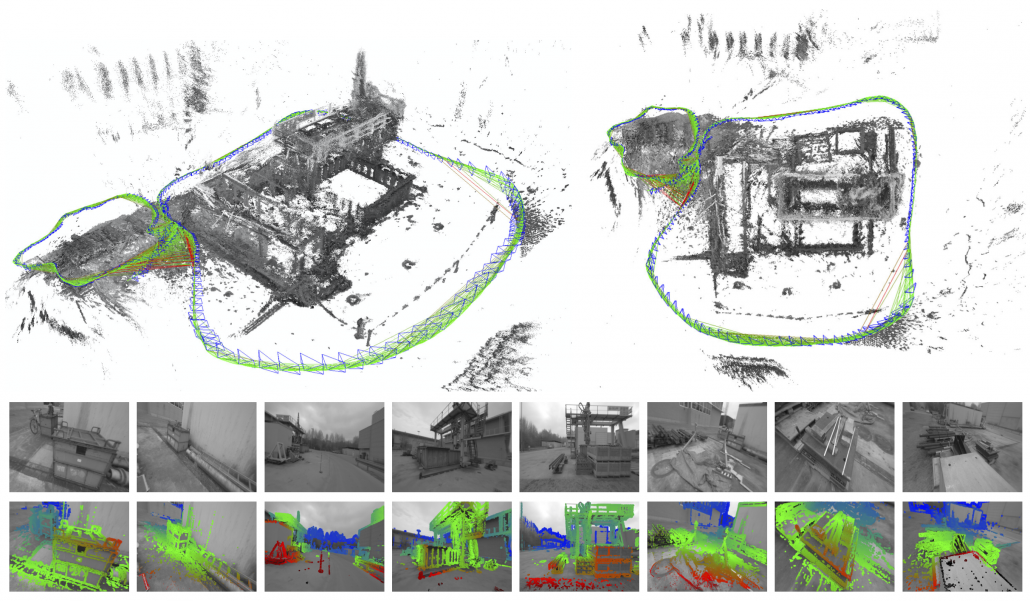
*In the textbook on probabilistic robotics, this case is classified to a planning problem rather than a RL problem because it assumes that the robot has a complete model of the environment, and RL is not introduced in the textbook. In case of robotics one major way of making a model, or rather a map is SLAM (Simultaneous Localization and Mapping). With SLAM, a map of the environment can be made only based on what have been seen with a moving camera like in the figure below. Half the first part of the textbook is about self localization of robots and gaining maps of environments. And the latter part is about planning in the gained map. RL is also based on planning problems as I explained. I would say RL is another branch of techniques to gain such models/maps and proper plans in the environment through trial and errors.

In the example of robotics above, we have not considered rewards R_t in the course of navigating the agent. That means the reward is given only when it reaches the goal. But agents can get lost if they get a reward only at the goal. Thus in many cases you optimize a policy \pi(a|s) such that it maximizes the sum of rewards R_1 + R_2 + \cdots + R_T, where T is the the length of the whole sequence of MDP in this case. More concretely, at every time step t, agents have to estimate G_t \doteq R_{t+1} + R_{t+2} + \cdots + R_T. The G_t is called a return. But you usually have to consider uncertainty of future rewards, so in practice you multiply a discount rate \gamma \quad (0\leq \gamma \leq 1) with rewards every time step. Thus in practice agents estimate a discounted return every time step as follows.

G_t \doteq R_{t+1} + \gamma R_{t+2} + \gamma ^2 R_{t+3} + \cdots + \gamma ^ {T-t-1} R_T = \sum_{k=0}^{T-t-1}{\gamma ^{k}R_{t+k+1}}

If agents blindly try to maximize immediate upcoming rewards R_t in a greedy way, that can lead to smaller amount of rewards in the long run. Policies in RL have to be optimized so that they maximize return, a sum of upcoming rewards G_t, every time step. But still, it is not realistic to take all the upcoming rewards R_{t+1}, R_{t+2}, \dots directly into consideration. These rewards have to be calculated recursively and probabilistically every time step. To be exact values of states are calculated this way. The value of a state in contexts of RL mean how likely agents get higher values if they start from the state. And how to calculate values is formulated as the Bellman equation.

*If you are not sure what “ecursively” and “probabilistically” mean, please do not think too much. I am going to explain that as precisely as possible in the next article.

I am going to explain Bellman equation, or Bellman operator to be exact in the next article. For now I would like you to keep it in mind that Bellman operator calculates the value of a state by considering future actions and their following states and rewards. Bellman equation is often displayed as a decision-tree-like chart as below. I would say planning and RL are matter of repeatedly applying Bellman equation to values of states. In planning problems, the model of the environment is known. That is, all the connections of nodes of the graph at the left side of the figure below are known. On the other hand in RL, those connections are not completely known, thus they need to be estimated in certain ways by agents collecting data from the environment.

*I guess almost no one explain RL ideas as the graphs above, and actually I am in search of effective and correct ways of visualizing RL. But so far, I think the graphs above describe how values updated in RL problem settings with discrete data. You are going to see what these graphs mean little by little in upcoming articles. I am also planning to introduce Bellman operators to formulate RL so that you do not have to think about decision-tree-like graphs all the time.

4. Examples of how RL problems are modeled

You might find that so many explanations on RL rely on examples of how to make computers navigate themselves in simple mazes or play video games, which are mostly impractical in real world. But I think uses of RL in letting computers play video games are good examples when you study RL. The video game industry is one of the most developed and sophisticated area which have produced environments of RL. OpenAI provides some “playgrounds” where agents can actually move around, and there are also some ports of Atari games. I guess once you understand how RL can be modeled in those simulations, that helps to understand how other more practical tasks are implemented.

*It is a pity that there is no E.T. the Extra-Terrestrial. It is a notorious video game which put an end of the reign of Atari. And after that came the era of Nintendo Entertainment System.

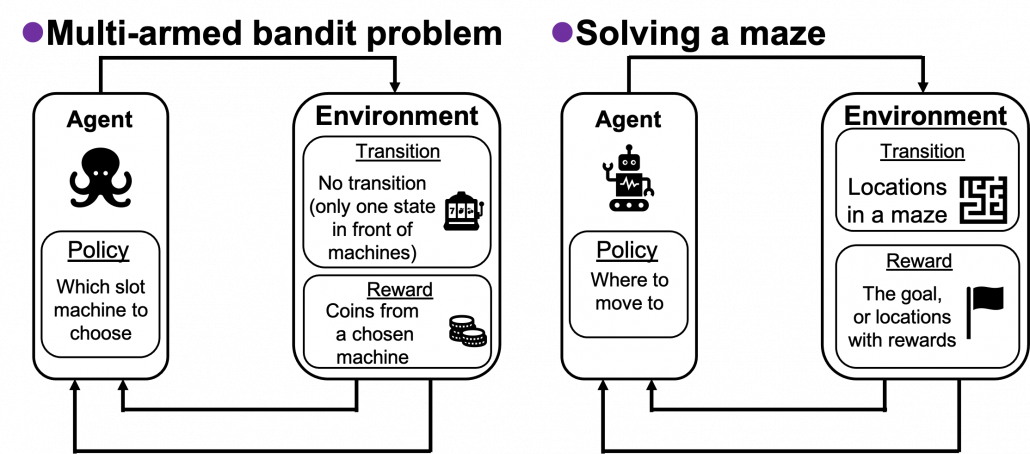
In the second section of this article, I showed the most typical diagram of the fundamental RL idea. The diagrams below show correspondences of each element of some simple RL examples to the diagram of general RL. Multi-armed bandit problems are a family of the most straightforward RL tasks, and I am going to explain it a bit more precisely later in this article. An agent solving a maze is also a very major example of RL tasks. In this case states s\in \mathcal{S} are locations where an agent can move. Rewards r \in \mathcal{R} are goals or bonuses the agents get in the course of the maze. And in this case \mathcal{A} = \{\rightarrow, \downarrow,\leftarrow, \uparrow \}.

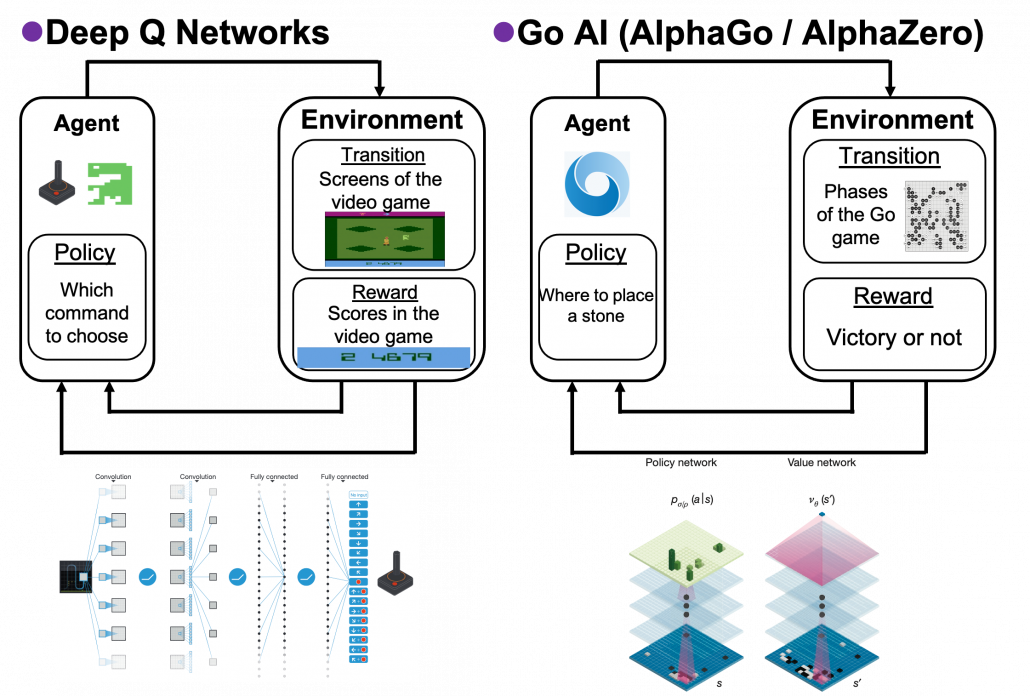
If the environments are more complicated, deep learning is needed to make more complicated functions to model each component of RL. Such RL is called deep reinforcement learning. The examples below are some successful cases of uses of deep RL. I think it is easy to imagine that the case of solving a maze is close to RL playing video games. In this case \mathcal{A} is all the possible commands with an Atari controller like in the figure below. Deep Q Networks use deep learning in RL algorithms named Q learning. The development of convolutional neural networks (CNN) enabled computers to comprehend what are displayed on video game screens. Thanks to that, video games do not need to be simplified like mazes. Even though playing video games, especially complicated ones today, might not be strict MDPs, deep Q Networks simplifies the process of playing Atari as MDP. That is why the process playing video games can be simplified as the chart below, and this simplified MPD model can surpass human performances. AlphaGo and AlphaZero are anotehr successful cases of deep RL. AlphaGo is ther first RL model which defeated the world Go champion. And some training schemes were simplified and extented to other board games like chess in AlphaZero. Even though they were sensations in media as if they were menaces to human intelligence, they are also based on MDPs. A policy network which calculates which tactics to take to enhance probability of winning board games. But they use much more sophisticated and complicated techniques. And it is almost impossible to try training them unless you own a tech company or something with some servers mounted with some TPUs. But I am going to roughly explain how they work in one of my upcoming articles.

5. Some keywords for organizing terms of RL

As I am also going to explain in next two articles, RL algorithms are totally different frameworks of training machine learning models compared to supervised/unsupervised learnig. I think pairs of keywords below are helpful in classifying RL algorithms you are going to encounter.

(1) “Model-based” or “model-free.”

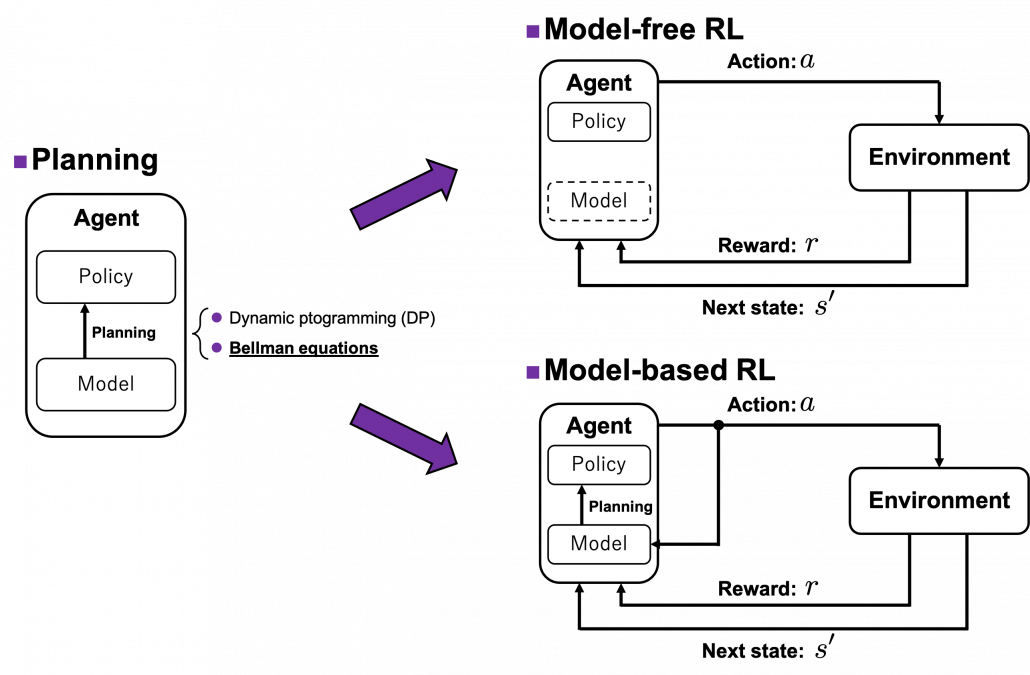
I said planning problems are basics of RL problems, and in many cases RL algorithms approximate Bellman equation or related ideas. I also said planning problems can be solved by repeatedly applying Bellman equations on states of a model of an environment. But in RL problems, models are usually unknown, and agents can only move in an environment which gives a reward or the next state to an agent. The agent can gains richer information of the environment time step by time step in RL, but this procedure can be roughly classified to two types: model-free type and model-based type. In model-free type, models of the environment are not explicitly made, and policies are updated based on data collected from the environment. On the her hand, in model-based types the models of the environment are estimated, and policies are calculated based on the model.

*AlphaGo and AlphaZero are examples of model-based RL. Phases of board games can be modeled with CNN. Plannings in this case correspond to reading some phases ahead of games, and they are enabled by Monte Carlo tree search. They are the only examples of model-based RL which I can come up with. And also I had an impression that many study materials on RL focus on model-free types of RL.

(2) “Values” or “policies.”

I mentioned that in RL, values and policies are optimized. Values are functions of a value of each state. The value here means how likely an agent gets high rewards in the future, starting from the state. Policies are functions fro calculating actions to take in each state, which I showed as each of blue arrows in the example of robotics above. But in RL, these two functions are renewed in return, and often they reach optimal functions when they converge. The figure below describes the idea well.

These are essential components of RL, and there too many variations of how to calculate them. For example timings of updating them, whether to update them probabilistically or deterministically.  And whatever RL algorithm I talk about, how values and policies are updated will be of the best interest. Only briefly mentioning them would be just more and more confusing, so let me only briefly take examples of dynamic programming (DP).

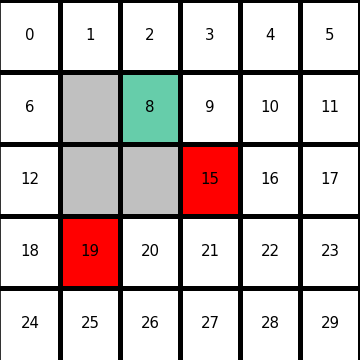
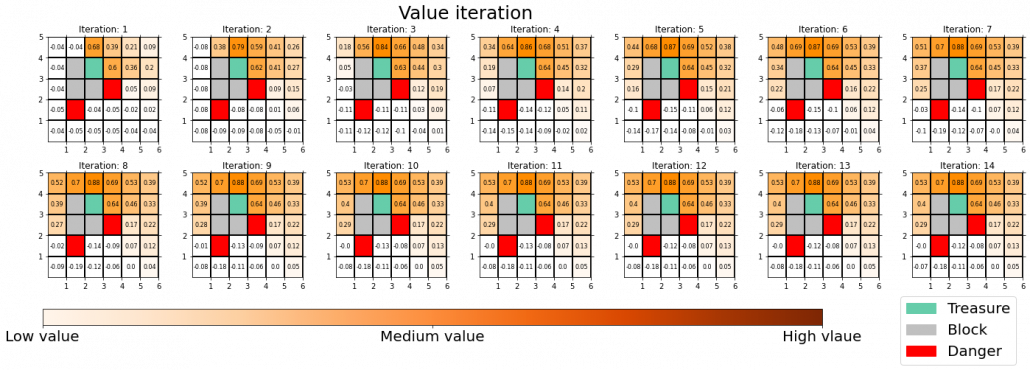
Let’s consider DP on a simple grid map which I showed in the preface. This is a planning problem, and agents have a perfect model of the map, so they do not have to actually move around there. Agents can move on any cells except for blocks, and they get a positive rewards at treasure cells, and negative rewards at danger cells. With policy iteration, the agents can interactively update policies and values of all the states of the map. The chart below shows how policies and values of cells are updated.

You do not necessarily have to calculate policies every iteration, and this case of DP is called value iteration. But as the chart below suggests, value iteration takes more time to converge.

I am going to much more precisely explain the differences of values and policies in DP tasks in the next article.

(3) “Exploration” or “exploitation”

RL agents are not explicitly supervised by the correct answers of each behavior. They just receive rough signals of “good” or “bad.” One of the most typical failed cases of RL is that agents can be myopic. I mean, once agents find some actions which constantly give good reward, they tend to miss other actions which produce better rewards more effectively. One good way of avoiding this is adding some exploration, that is taking some risks to discover other actions.

I mentioned multi-armed bandit problems are simple setting of RL problems. And they also help understand trade-off of exploration and exploitation. In a multi-armed bandit problem, an agent chooses which slot machine to run every time step. Each slot machine gives out coins, or rewards r with a probability of p. The number of trials is limited, so the agent has to find the machine which gives out coins the most efficiently within the limited number of trials. In this problem, the key is the balance of trying to find other effective slot machines and just trying to get as much coins as possible with the machine which for now seems to be the best. This is trade-off of “exploration” or “exploitation.” One simple way to implement exploration and exploitation trade-off is ɛ-greedy algorithm. This is quite simple: with a probability of \epsilon, agents just randomly choose actions which are not thought to be the best then.

*Casino owners are not so stupid. It is designed so that you would lose in the long run, and before your “exploration” is complete, you will be “exploited.”

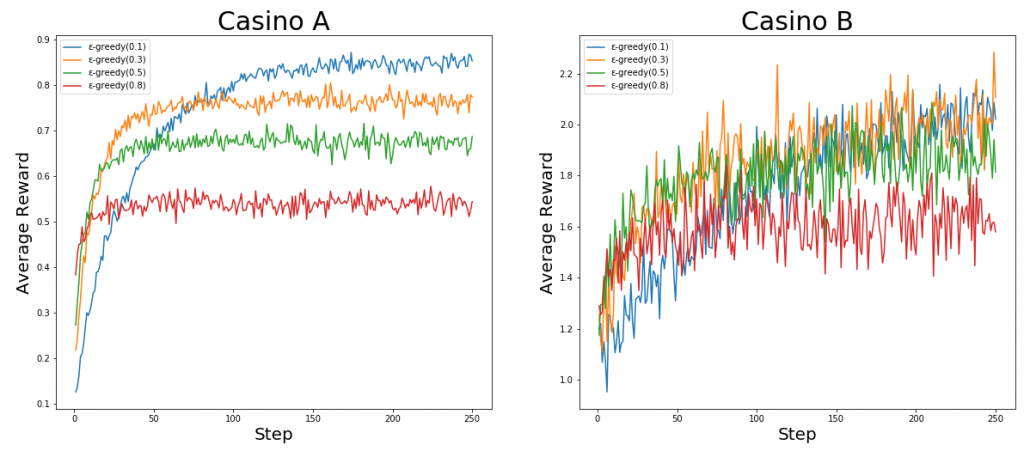
Let’s take a look at a simple simulation of a multi-armed bandit problem. There are two “casinos,” I mean sets of slot machines. In casino A, all the slot machines gives out the same reward 1, thus agents only need to find the machine which is the most likely to gives out more coins. But casino B is not simple like that. In this casino, slot machines with small odds give higher rewards.

I prepared four types of “multi-armed bandits,” I mean octopus agents. Each of them has each value of \epsilon, and the \epsilons reflect their “curiosity,” or maybe “how inconsistent they are.” The graphs below show the average reward over 1000 simulations. In each simulation each agent can try slot machines 250 times in total. In casino A, it seems the agent with the curiosity of \epsilon = 0.3 gets the best rewards in a short term. But in the long run, more stable agent whose \epsilon is 0.1, get more rewards. On the other hand in casino B, No on seems to make outstanding results.

*I wold not concretely explain how values of each slot machines are updated in this article. I think I am going to explain multi-armed bandit problems with Monte Carlo tree search in one of upcoming articles to explain the algorithm of AlphaGo/AlphaZero.

(4)”Achievement” or “estimation”

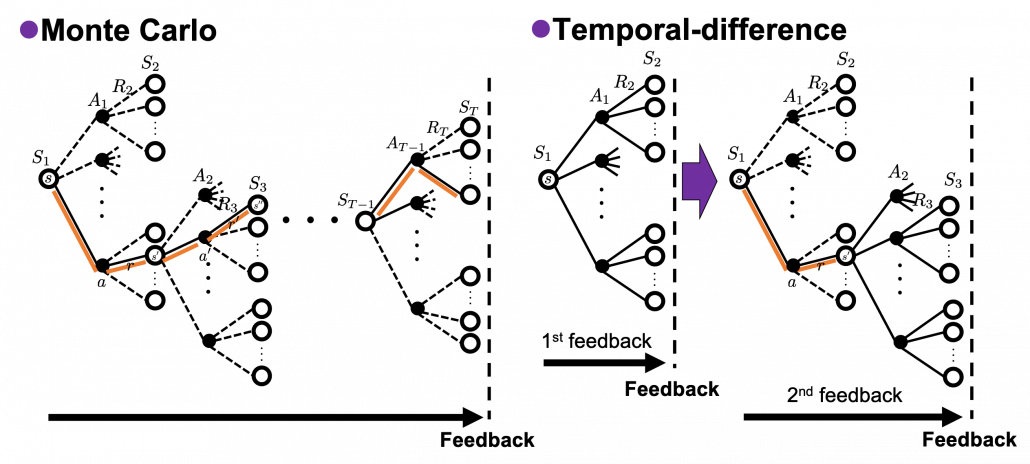
The last pair of keywords is “achievement” or “estimation,” and it might be better to instead see them as a comparison of “Monte Carlo” and “temporal-difference (TD).” I said RL algorithms often approximate Bellman equation based on data an agent has collected. Agents moving around in environments can be viewed as sampling data from the environment. Agents sample data of states, actions, and rewards. At the same time agents constantly estimate the value of each state. Thus agents can modify their estimations of values using value calculated with sampled data. This is how agents make use of their “experiences” in RL. There are several variations of when to update estimations of values, but roughly they are classified to Monte Carlo and Temporal-difference (TD). Monte Carlo is based on achievements of agents after one episode or actions. And TD is more of based on constant estimation of values at every time step. Which approach is to take depends on tasks but it seems many major algorithms adopt TD types. But I got an impression that major RL algorithms adopt TD, and also it is said evaluating actions by TD has some analogies with how brain is “reinforced.” And above all, according to the book by Sutton and Barto “If one had to identify one idea as central and novel to reinforcement learning, it would undoubtedly be temporal-difference (TD) learning.” And an intermediate idea, between Monte Carlo and TD, also can be formulated as eligibility trace.

In this article I have briefly covered all the topics I am planning to explain in this series. This article is a start of a long-term journey of studying RL also to me. Any feedback on this series, as posts or  emails, would be appreciated. The next article is going to be about dynamic programming, which is a major way for solving planning problems. In contexts of RL, dynamic programming is solved by repeatedly applying Bellman equation on values of states of a model of an environment. Thus I think it is no exaggeration to say dynamic programming is the backbone of RL algorithms.

Appendix

The code I used for the multi-armed bandit simulation. Just copy and paste them on Jupyter Notebook.

* I make study materials on machine learning, sponsored by DATANOMIQ. I do my best to make my content as straightforward but as precise as possible. I include all of my reference sources. If you notice any mistakes in my materials, including grammatical errors, please let me know (email: yasuto.tamura@datanomiq.de). And if you have any advice for making my materials more understandable to learners, I would appreciate hearing it.

Rethinking linear algebra part two: ellipsoids in data science

1 Our expedition of eigenvectors still continues

This article is still going to be about eigenvectors and PCA, and this article still will not cover LDA (linear discriminant analysis). Hereby I would like you to have more organic links of the data science ideas with eigenvectors.

In the second article, we have covered the following points:

  • You can visualize linear transformations with matrices by calculating displacement vectors, and they usually look like vectors swirling.
  • Diagonalization is finding a direction in which the displacement vectors do not swirl, and that is equal to finding new axis/basis where you can describe its linear transformations more straightforwardly. But we have to consider diagonalizability of the matrices.
  • In linear dimension reduction such as PCA or LDA, we mainly use types of matrices called positive definite or positive semidefinite matrices.

In the last article we have seen the following points:

  • PCA is an algorithm of calculating orthogonal axes along which data “swell” the most.
  • PCA is equivalent to calculating a new orthonormal basis for the data where the covariance between components is zero.
  • You can reduced the dimension of the data in the new coordinate system by ignoring the axes corresponding to small eigenvalues.
  • Covariance matrices enable linear transformation of rotation and expansion and contraction of vectors.

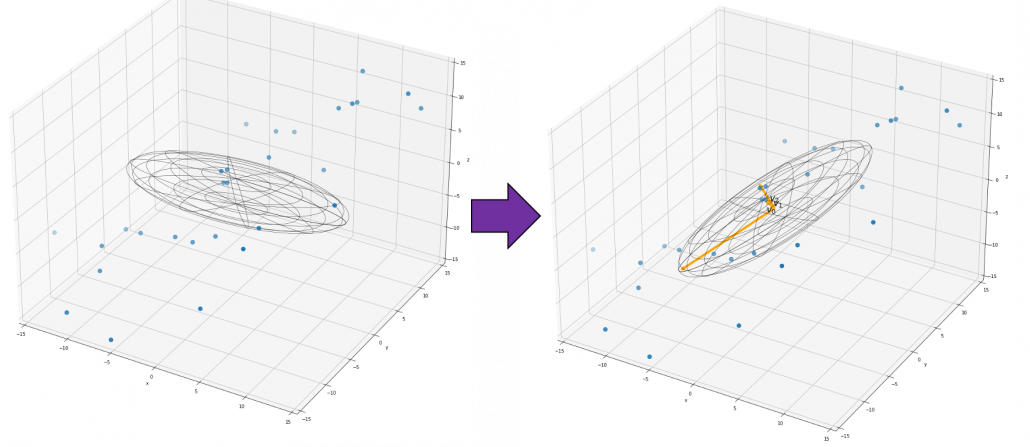
I emphasized that the axes are more important than the surface of the high dimensional ellipsoids, but in this article let’s focus more on the surface of ellipsoids, or I would rather say general quadratic curves. After also seeing how to draw ellipsoids on data, you would see the following points about PCA or eigenvectors.

  • Covariance matrices are real symmetric matrices, and also they are positive semidefinite. That means you can always diagonalize covariance matrices, and their eigenvalues are all equal or greater than 0.
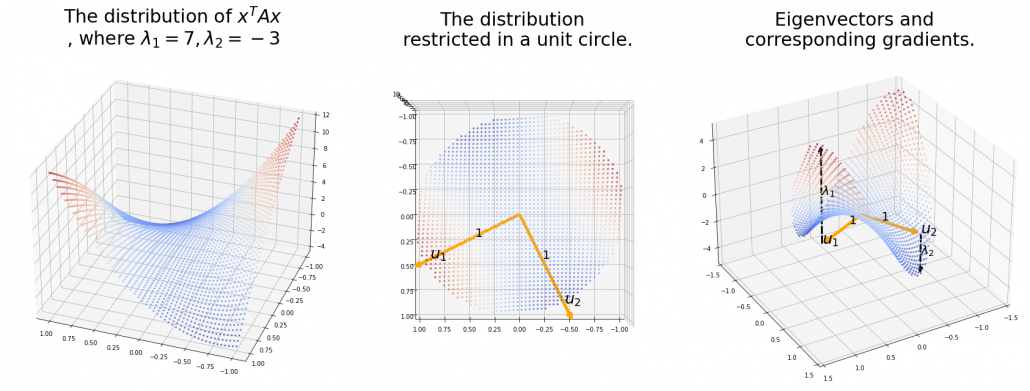
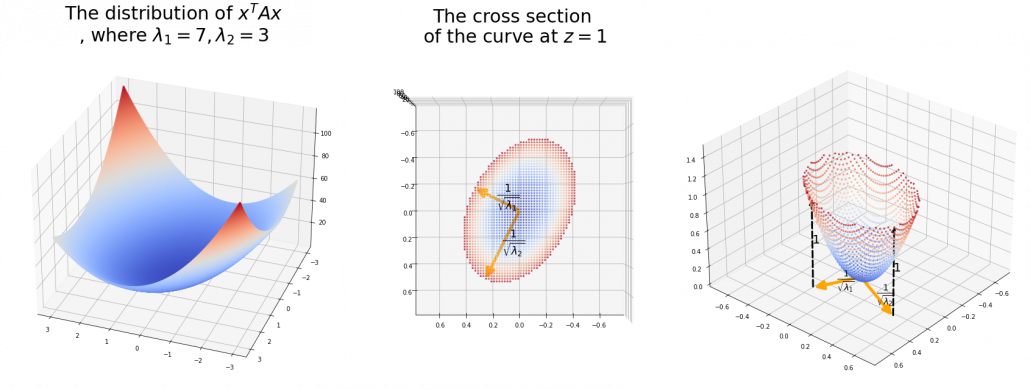
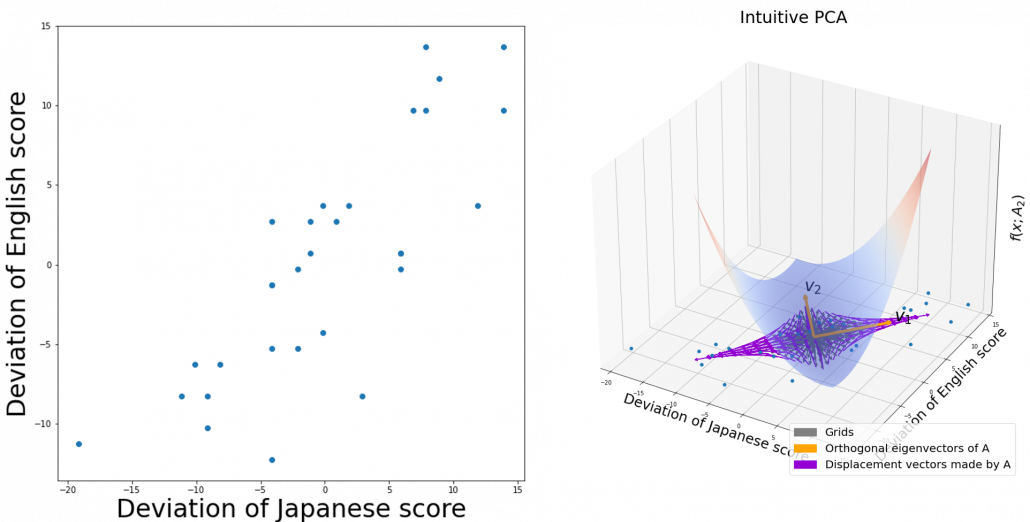
  • PCA is equivalent to finding axes of quadratic curves in which gradients are biggest. The values of quadratic curves increases the most in those directions, and that means the directions describe great deal of information of data distribution.
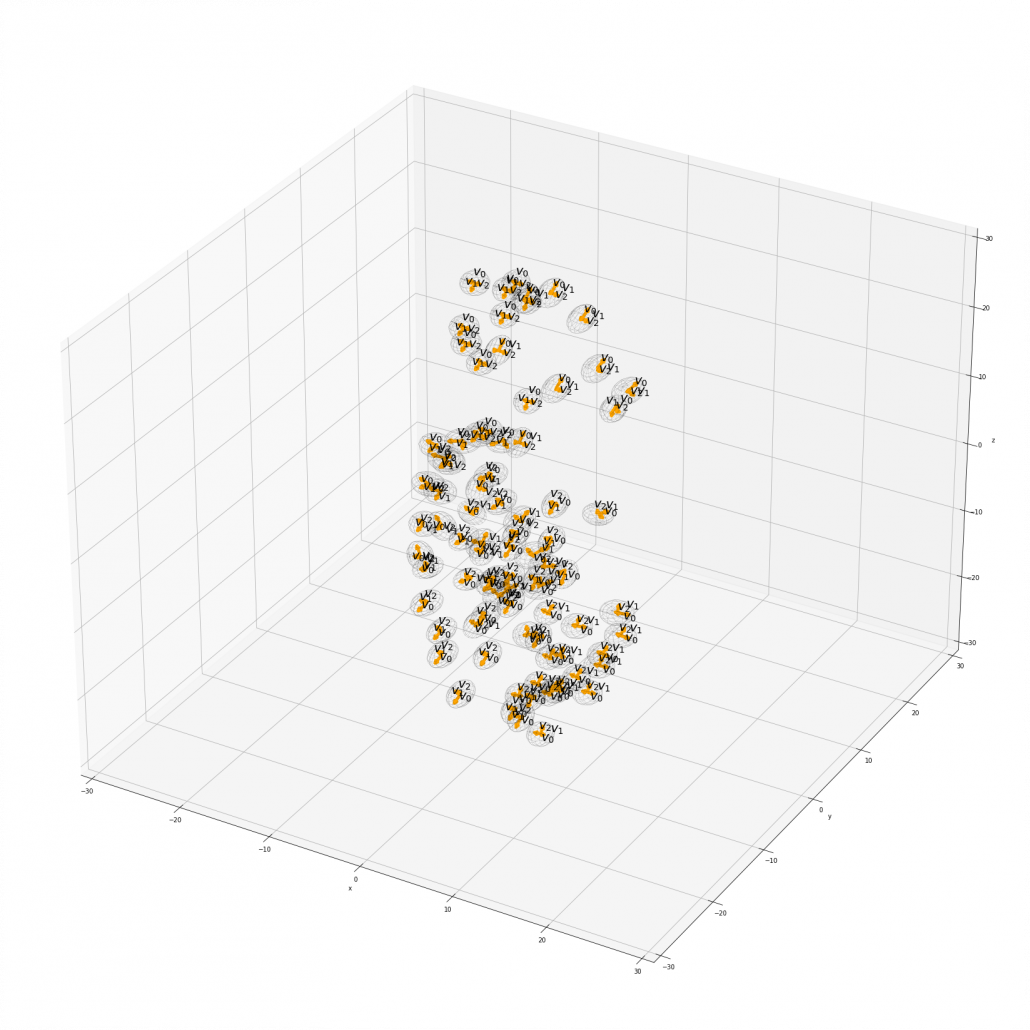
  • Intuitively dimension reduction by PCA is equal to fitting a high dimensional ellipsoid on data and cutting off the axes corresponding to small eigenvalues.

Even if you already understand PCA to some extent, I hope this article provides you with deeper insight into PCA, and at least after reading this article, I think you would be more or less able to visually control eigenvectors and ellipsoids with the Numpy and Maplotlib libraries.

*Let me first introduce some mathematical facts and how I denote them throughout this article in advance. If you are allergic to mathematics, take it easy or please go back to my former articles.

  • Any quadratic curves can be denoted as \boldsymbol{x}^T A\boldsymbol{x} + 2\boldsymbol{b}^T\boldsymbol{x} + s = 0, where \boldsymbol{x}\in \mathbb{R}^D , A \in \mathbb{R}^{D\times D} \boldsymbol{b}\in \mathbb{R}^D s\in \mathbb{R}.
  • When I want to clarify dimensions of variables of quadratic curves, I denote parameters as A_D, b_D.
  • If a matrix A is a real symmetric matrix, there exist a rotation matrix U such that U^T A U = \Lambda, where \Lambda = diag(\lambda_1, \dots, \lambda_D) and U = (\boldsymbol{u}_1, \dots , \boldsymbol{u}_D). \boldsymbol{u}_1, \dots , \boldsymbol{u}_D are eigenvectors corresponding to \lambda_1, \dots, \lambda_D respectively.
  • PCA corresponds to a case of diagonalizing A where A is a covariance matrix of certain data. When I want to clarify that A is a covariance matrix, I denote it as A=\Sigma.
  • Importantly covariance matrices \Sigma are positive semidefinite and real symmetric, which means you can always diagonalize \Sigma and any of their engenvalues cannot be lower than 0.

*In the last article, I denoted the covariance of data as S, based on Pattern Recognition and Machine Learning by C. M. Bishop.

*Sooner or later you are going to see that I am explaining basically the same ideas from different points of view, using the topic of PCA. However I believe they are all important when you learn linear algebra for data science of machine learning. Even you have not learnt linear algebra or if you have to teach linear algebra, I recommend you to first take a review on the idea of diagonalization, like the second article. And you should be conscious that, in the context of machine learning or data science, only a very limited type of matrices are important, which I have been explaining throughout this article.

2 Rotation or projection?

In this section I am going to talk about basic stuff found in most textbooks on linear algebra. In the last article, I mentioned that if A is a real symmetric matrix, you can diagonalize A with a rotation matrix U = (\boldsymbol{u}_1 \: \cdots \: \boldsymbol{u}_D), such that U^{-1}AU = U^{T}AU =\Lambda, where \Lambda = diag(\lambda_{1}, \dots , \lambda_{D}). I also explained that PCA is a case where A=\Sigma, that is, A is the covariance matrix of certain data. \Sigma is known to be positive semidefinite and real symmetric. Thus you can always diagonalize \Sigma and any of their engenvalues cannot be lower than 0.

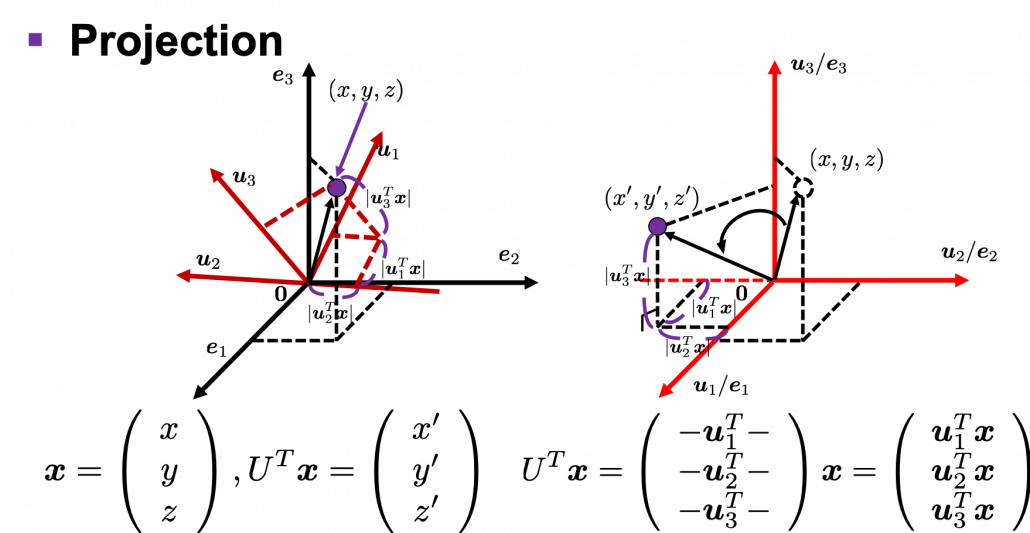
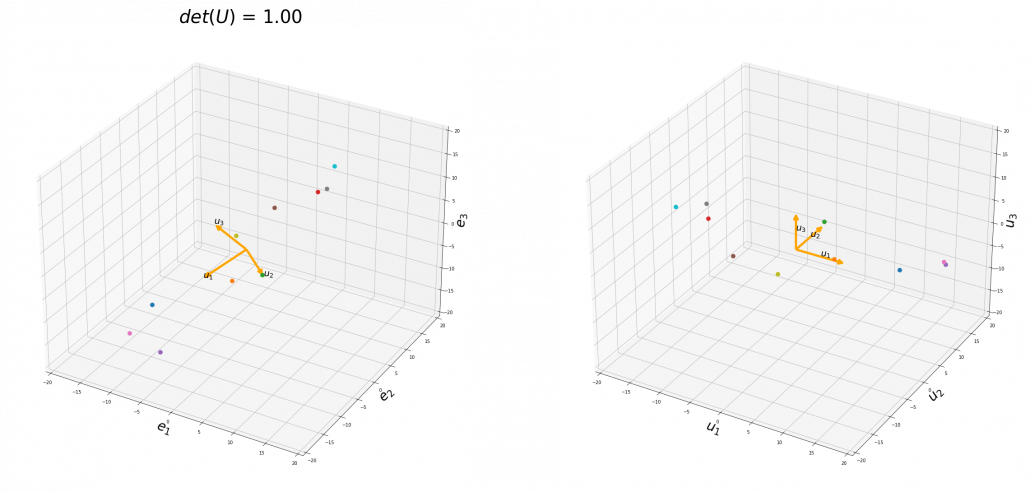
I think we first need to clarify the difference of rotation and projection. In order to visualize the ideas, let’s consider a case of D=3. Assume that you have got an orthonormal rotation matrix U = (\boldsymbol{u}_1 \: \boldsymbol{u}_2 \: \boldsymbol{u}_3) which diagonalizes A. In the last article I said diagonalization is equivalent to finding new orthogonal axes formed by eigenvectors, and in the case of this section you got new orthonoramal basis (\boldsymbol{u}_1, \boldsymbol{u}_2, \boldsymbol{u}_3) which are in red in the figure below. Projecting a point \boldsymbol{x} = (x, y, z) on the new orthonormal basis is simple: you just have to multiply \boldsymbol{x} with U^T. Let U^T \boldsymbol{x} be (x', y', z')^T, and then \left( \begin{array}{c} x' \\ y' \\ z' \end{array} \right) = U^T\boldsymbol{x} = \left( \begin{array}{c} \boldsymbol{u}_1^{T}\boldsymbol{x} \\ \boldsymbol{u}_2^{T}\boldsymbol{x} \\ \boldsymbol{u}_3^{T}\boldsymbol{x} \end{array} \right). You can see x', y', z' are \boldsymbol{x} projected on \boldsymbol{u}_1, \boldsymbol{u}_2, \boldsymbol{u}_3 respectively, and the left side of the figure below shows the idea. When you replace the orginal orthonormal basis (\boldsymbol{e}_1, \boldsymbol{e}_2, \boldsymbol{e}_3) with (\boldsymbol{u}_1, \boldsymbol{u}_2, \boldsymbol{u}_3) as in the right side of the figure below, you can comprehend the projection as a rotation from (x, y, z) to (x', y', z') by a rotation matrix U^T.

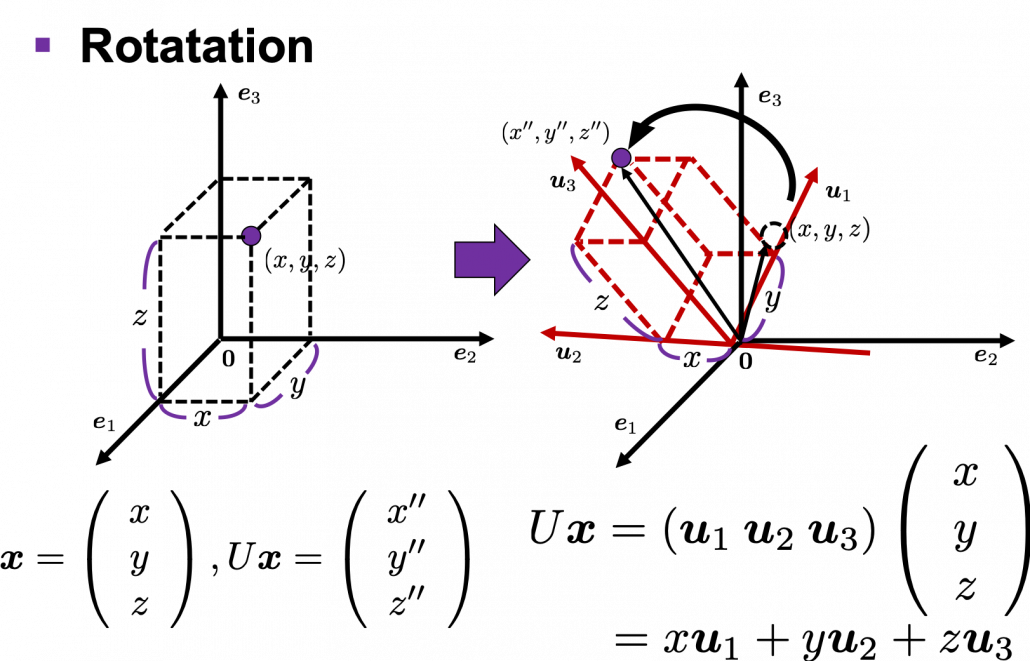
Next, let’s see what rotation is. In case of rotation, you should imagine that you rotate the point \boldsymbol{x} in the same coordinate system, rather than projecting to other coordinate system. You can rotate \boldsymbol{x} by multiplying it with U. This rotation looks like the figure below.

In the initial position, the edges of the cube are aligned with the three orthogonal black axes (\boldsymbol{e}_1,  \boldsymbol{e}_2 , \boldsymbol{e}_3), with one corner of the cube located at the origin point of those axes. The purple dot denotes the corner of the cube directly opposite the origin corner. The cube is rotated in three dimensions, with the origin corner staying fixed in place. After the rotation with a pivot at the origin, the edges of the cube are now aligned with a new set of orthogonal axes (\boldsymbol{u}_1,  \boldsymbol{u}_2 , \boldsymbol{u}_3), shown in red. You might understand that more clearly with an equation: U\boldsymbol{x} = (\boldsymbol{u}_1 \: \boldsymbol{u}_2 \: \boldsymbol{u}_3) \left( \begin{array}{c} x \\ y \\ z \end{array} \right) = x\boldsymbol{u}_1 + y\boldsymbol{u}_2 + z\boldsymbol{u}_3. In short this rotation means you keep relative position of \boldsymbol{x}, I mean its coordinates (x, y, z), in the new orthonormal basis. In this article, let me call this a “cube rotation.”

The discussion above can be generalized to spaces with dimensions higher than 3. When U \in \mathbb{R}^{D \times D} is an orthonormal matrix and a vector \boldsymbol{x} \in \mathbb{R}^D, you can project \boldsymbol{x} to \boldsymbol{x}' = U^T \boldsymbol{x}or rotate it to \boldsymbol{x}'' = U \boldsymbol{x}, where \boldsymbol{x}' = (x_{1}', \dots, x_{D}')^T and \boldsymbol{x}'' = (x_{1}'', \dots, x_{D}'')^T. In other words \boldsymbol{x} = U \boldsymbol{x}', which means you can rotate back \boldsymbol{x}' to the original point \boldsymbol{x} with the rotation matrix U.

I think you at least saw that rotation and projection are basically the same, and that is only a matter of how you look at the coordinate systems. But I would say the idea of projection is more important through out this article.

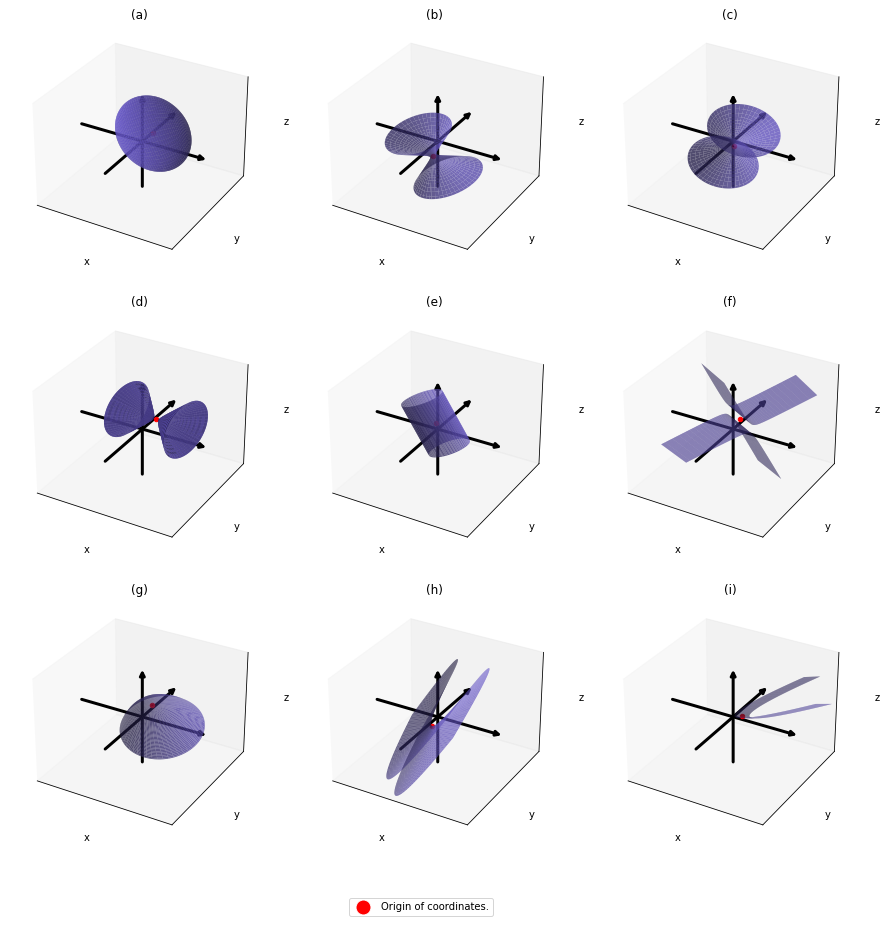
Let’s consider a function f(\boldsymbol{x}; A) = \boldsymbol{x}^T A \boldsymbol{x} = (\boldsymbol{x}, A \boldsymbol{x}), where A\in \mathbb{R}^{D\times D} is a real symmetric matrix. The distribution of f(\boldsymbol{x}; A) is quadratic curves whose center point covers the origin, and it is known that you can express this distribution in a much simpler way using eigenvectors. When you project this function on eigenvectors of A, that is when you substitute U \boldsymbol{x}' for \boldsymbol{x}, you get f = (\boldsymbol{x}, A \boldsymbol{x}) =(U \boldsymbol{x}', AU \boldsymbol{x}') = (\boldsymbol{x}')^T U^TAU \boldsymbol{x}' = (\boldsymbol{x}')^T \Lambda \boldsymbol{x}' = \lambda_1 ({x'}_1)^2 + \cdots + \lambda_D ({x'}_D)^2. You can always diagonalize real symmetric matrices, so the formula implies that the shapes of quadratic curves largely depend on eigenvectors. We are going to see this in detail in the next section.

*(\boldsymbol{x}, \boldsymbol{y}) denotes an inner product of \boldsymbol{x} and \boldsymbol{y}.

*We are going to see details of the shapes of quadratic “curves” or “functions” in the next section.

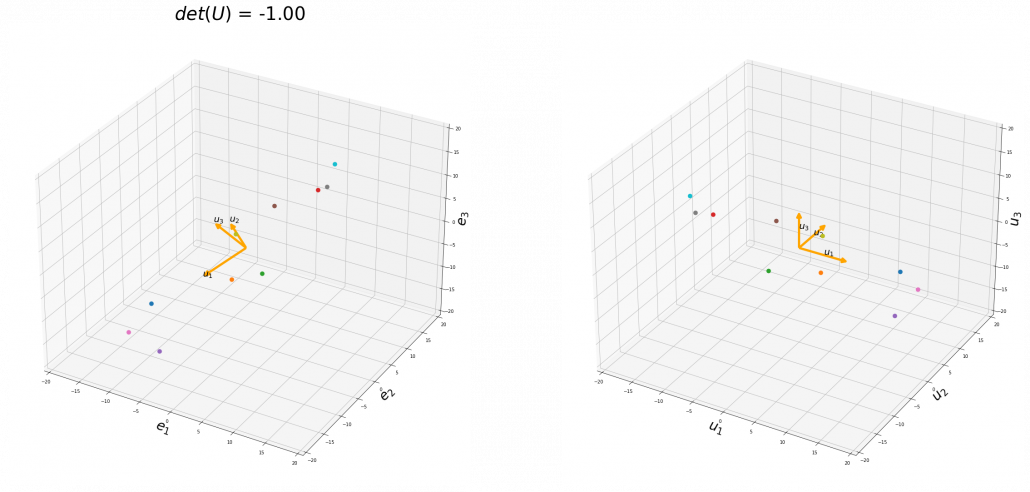
To be exact, you cannot naively multiply U or U^T for rotation. Let’s take a part of data I showed in the last article as an example. In the figure below, I projected data on the basis (\boldsymbol{u}_1,  \boldsymbol{u}_2 , \boldsymbol{u}_3).

You might have noticed that you cannot do a “cube rotation” in this case. If you make the coordinate system (\boldsymbol{u}_1, \boldsymbol{u}_2, \boldsymbol{u}_3) with your left hand, like you might have done in science classes in school to learn Fleming’s rule, you would soon realize that the coordinate systems in the figure above do not match. You need to flip the direction of one axis to match them.

Mathematically, you have to consider the determinant of the rotation matrix U. You can do a “cube rotation” when det(U)=1, and in the case above det(U) was -1, and you needed to flip one axis to make the determinant 1. In the example in the figure below, you can match the basis. This also can be generalized to higher dimensions, but that is also beyond the scope of this article series. If you are really interested, you should prepare some coffee and snacks and textbooks on linear algebra, and some weekends.

When you want to make general ellipsoids in a 3d space on Matplotlib, you can take advantage of rotation matrices. You first make a simple ellipsoid symmetric about xyz axis using polar coordinates, and you can rotate the whole ellipsoid with rotation matrices. I made some simple modules for drawing ellipsoid. If you put in a rotation matrix which diagonalize the covariance matrix of data and a list of three radiuses \sqrt{\lambda_1}, \sqrt{\lambda_2}, \sqrt{\lambda_3}, you can rotate the original ellipsoid so that it fits the data well.

3 Types of quadratic curves.

*This article might look like a mathematical writing, but I would say this is more about computer science. Please tolerate some inaccuracy in terms of mathematics. I gave priority to visualizing necessary mathematical ideas in my article series. If you are not sure about details, please let me know.

In linear dimension reduction, or at least in this article series you mainly have to consider ellipsoids. However ellipsoids are just one type of quadratic curves. In the last article, I mentioned that when the center of a D dimensional ellipsoid is the origin point of a normal coordinate system, the formula of the surface of the ellipsoid is as follows: (\boldsymbol{x}, A\boldsymbol{x})=1, where A satisfies certain conditions. To be concrete, when (\boldsymbol{x}, A\boldsymbol{x})=1 is the surface of a ellipsoid, A has to be diagonalizable and positive definite.

*Real symmetric matrices are diagonalizable, and positive definite matrices have only positive eigenvalues. Covariance matrices \Sigma, whose displacement vectors I visualized in the last two articles, are known to be symmetric real matrices and positive semi-defintie. However, the surface of an ellipsoid which fit the data is \boldsymbol{x}^T \Sigma ^{-1} \boldsymbol{x} = const., not \boldsymbol{x}^T \Sigma \boldsymbol{x} = const..

*You have to keep it in mind that \boldsymbol{x} are all deviations.

*You do not have to think too much about what the “semi” of the term “positive semi-definite” means fow now.

As you could imagine, this is just one simple case of richer variety of graphs. Let’s consider a 3-dimensional space. Any quadratic curves in this space can be denoted as ax^2 + by^2 + cz^2 + dxy + eyz + fxz + px + qy + rz + s = 0, where at least one of a, b, c, d, e, f, p, q, r, s is not 0.  Let \boldsymbol{x} be (x, y, z)^T, then the quadratic curves can be simply denoted with a 3\times 3 matrix A and a 3-dimensional vector \boldsymbol{b} as follows: \boldsymbol{x}^T A\boldsymbol{x} + 2\boldsymbol{b}^T\boldsymbol{x} + s = 0, where A = \left( \begin{array}{ccc} a & \frac{d}{2} & \frac{f}{2} \\ \frac{d}{2} & b & \frac{e}{2} \\ \frac{f}{2} & \frac{e}{2} & c \end{array} \right), \boldsymbol{b} = \left( \begin{array}{c} \frac{p}{2} \\ \frac{q}{2} \\ \frac{r}{2} \end{array} \right). General quadratic curves are roughly classified into the 9 types below.

You can shift these quadratic curves so that their center points come to the origin, without rotation, and the resulting curves are as follows. The curves can be all denoted as \boldsymbol{x}^T A\boldsymbol{x}.

As you can see, A is a real symmetric matrix. As I have mentioned repeatedly, when all the elements of a D \times D symmetric matrix A are real values and its eigen values are \lambda_{i} (i=1, \dots , D), there exist orthogonal/orthonormal matrices U such that U^{-1}AU = \Lambda, where \Lambda = diag(\lambda_{1}, \dots , \lambda_{D}). Hence, you can diagonalize the A = \left( \begin{array}{ccc} a & \frac{d}{2} & \frac{f}{2} \\ \frac{d}{2} & b & \frac{e}{2} \\ \frac{f}{2} & \frac{e}{2} & c \end{array} \right) with an orthogonal matrix U. Let U be an orthogonal matrix such that U^T A U = \left( \begin{array}{ccc} \alpha  & 0 & 0 \\ 0 & \beta & 0 \\ 0 & 0 & \gamma \end{array} \right) =\left( \begin{array}{ccc} \lambda_1  & 0 & 0 \\ 0 & \lambda_2 & 0 \\ 0 & 0 & \lambda_3 \end{array} \right). After you apply rotation by U to the curves (a)” ~ (i)”, those curves are symmetrically placed about the xyz axes, and their center points still cross the origin. The resulting curves look like below. Or rather I should say you projected (a)’ ~ (i)’ on their eigenvectors.

In this article mainly (a)” , (g)”, (h)”, and (i)” are important. General equations for the curves is as follows

  • (a)”: \frac{x^2}{l^2} + \frac{y^2}{m^2} + \frac{z^2}{n^2} = 1
  • (g)”: z = \frac{x^2}{l^2} + \frac{y^2}{m^2}
  • (h)”: z = \frac{x^2}{l^2} - \frac{y^2}{m^2}
  • (i)”: z = \frac{x^2}{l^2}

, where l, m, n \in \mathbb{R}^+.

Even if this section has been puzzling to you, you just have to keep one point in your mind: we have been discussing general quadratic curves, but in PCA, you only need to consider a case where A is a covariance matrix, that is A=\Sigma. PCA corresponds to the case where you shift and rotate the curve (a) into (a)”. Subtracting the mean of data from each point of data corresponds to shifting quadratic curve (a) to (a)’. Calculating eigenvectors of A corresponds to calculating a rotation matrix U such that the curve (a)’ comes to (a)” after applying the rotation, or projecting curves on eigenvectors of \Sigma. Importantly we are only discussing the covariance of certain data, not the distribution of the data itself.

*Just in case you are interested in a little more mathematical sides: it is known that if you rotate all the points \boldsymbol{x} on the curve \boldsymbol{x}^T A\boldsymbol{x} + 2\boldsymbol{b}^T\boldsymbol{x} + s = 0 with the rotation matrix P, those points \boldsymbol{x} are mapped into a new quadratic curve \alpha x^2 + \beta y^2 + \gamma z^2 + \lambda x + \mu y + \nu z + \rho = 0. That means the rotation of the original quadratic curve with P (or rather rotating axes) enables getting rid of the terms xy, yz, zx. Also it is known that when \alpha ' \neq 0, with proper translations and rotations, the quadratic curve \alpha x^2 + \beta y^2 + \gamma z^2 + \lambda x + \mu y + \nu z + \rho = 0 can be mapped into one of the types of quadratic curves in the figure below, depending on coefficients of the original quadratic curve. And the discussion so far can be generalized to higher dimensional spaces, but that is beyond the scope of this article series. Please consult decent textbooks on linear algebra around you for further details.

4 Eigenvectors are gradients and sometimes variances.

In the second section I explained that you can express quadratic functions f(\boldsymbol{x}; A) = \boldsymbol{x}^T A \boldsymbol{x} in a very simple way by projecting \boldsymbol{x} on eigenvectors of A.

You can comprehend what I have explained in another way: eigenvectors, to be exact eigenvectors of real symmetric matrices A, are gradients. And in case of PCA, I mean when A=\Sigma eigenvalues are also variances. Before explaining what that means, let me explain a little of the totally common facts on mathematics. If you have variables \boldsymbol{x}\in \mathbb{R}^D, I think you can comprehend functions f(\boldysmbol{x}) in two ways. One is a normal “functions” f(\boldsymbol{x}), and the others are “curves” f(\boldsymbol{x}) = const.. “Functions” get an input \boldsymbol{x} and gives out an output f(\boldsymbol{x}), just as well as normal functions you would imagine. “Curves” are rather sets of \boldsymbol{x} \in \mathbb{R}^D such that f(\boldsymbol{x}) = const..

*Please assume that the terms “functions” and “curves” are my original words. I use them just in case I fail to use functions and curves properly.

The quadratic curves in the figure above are all “curves” in my term, which can be denoted as f(\boldsymbol{x}; A_3, \boldsymbol{b}_3)=const or f(\boldsymbol{x}; A_3)=const. However if you replace z of (g)”, (h)”, and (i)” with f, you can interpret the “curves” as “functions” which are denoted as f(\boldsymbol{x}; A_2). This might sounds too obvious to you, and my point is you can visualize how values of “functions” change only when the inputs are 2 dimensional.

When a symmetric 2\times 2 real matrices A_2 have two eigenvalues \lambda_1, \lambda_2, the distribution of quadratic curves can be roughly classified to the following three types.

  • (g): Both \lambda_1 and \lambda_2 are positive or negative.
  • (h): Either of \lambda_1 or \lambda_2 is positive and the other is negative.
  • (i): Either of \lambda_1 or \lambda_2 is 0 and the other is not.

The equations of (g)” , (h)”, and (i)” correspond to each type of f=(\boldsymbol{x}; A_2), and thier curves look like the three graphs below.

And in fact, when start from the origin and go in the direction of an eigenvector \boldsymbol{u}_i, \lambda_i is the gradient of the direction. You can see that more clearly when you restrict the distribution of f=(\boldsymbol{x}; A_2) to a unit circle. Like in the figure below, in case \lambda_1 = 7, \lambda_2 = 3, which is classified to (g), the distribution looks like the left side, and if you restrict the distribution in the unit circle, the distribution looks like a bowl like the middle and the right side. When you move in the direction of \boldsymbol{u}_1, you can climb the bowl as as high as \lambda_1, in \boldsymbol{u}_2 as high as \lambda_2.

Also in case of (h), the same facts hold. But in this case, you can also descend the curve.

*You might have seen the curve above in the context of optimization with stochastic gradient descent. The origin of the curve above is a notorious saddle point, where gradients are all 0 in any directions but not a local maximum or minimum. Points can be stuck in this point during optimization.

Especially in case of PCA, A is a covariance matrix, thus A=\Sigma. Eigenvalues of \Sigma are all equal to or greater than 0. And it is known that in this case \lambda_i is the variance of data projected on its corresponding eigenvector \boldsymbol{u}_i (i=0, \dots , D). Hence, if you project f(\boldsymbol{x}; \Sigma), quadratic curves formed by a covariance matrix \Sigma, on eigenvectors of \Sigma, you get f(\boldsymbol{x}; \Sigma) = ({x'}_1 \: \dots \: {x'}_D) (\lambda_1 {x'}_1 \: \dots \: \lambda_D {x'}_D)^t =\lambda_1 ({x'}_1)^2 + \cdots + \lambda_D ({x'}_D)^2.  This shows that you can re-weight ({x'}_1 \: \dots \: {x'}_D), the coordinates of data projected projected on eigenvectors of A, with \lambda_1, \dots, \lambda_D, which are variances ({x'}_1 \: \dots \: {x'}_D). As I mentioned in an example of data of exam scores in the last article, the bigger a variance \lambda_i is, the more the feature described by \boldsymbol{u}_i vary from sample to sample. In other words, you can ignore eigenvectors corresponding to small eigenvalues.

That is a great hint why principal components corresponding to large eigenvectors contain much information of the data distribution. And you can also interpret PCA as a “climbing” a bowl of f(\boldsymbol{x}; A_D), as I have visualized in the case of (g) type curve in the figure above.

*But as I have repeatedly mentioned, ellipsoid which fit data well isf(\boldsymbol{x}; \Sigma ^{-1}) =(\boldsymbol{x}')^T diag(\frac{1}{\lambda_1}, \dots, \frac{1}{\lambda_D})\boldsymbol{x}' = \frac{({x'}_{1})^2}{\lambda_1} + \cdots + \frac{({x'}_{D})^2}{\lambda_D} = const..

*You have to be careful that even if you slice a type (h) curve f(\boldsymbol{x}; A_D) with a place z=const. the resulting cross section does not fit the original data well because the equation of the cross section is \lambda_1 ({x'}_1)^2 + \cdots + \lambda_D ({x'}_D)^2 = const. The figure below is an example of slicing the same f(\boldsymbol{x}; A_2) as the one above with z=1, and the resulting cross section.

As we have seen, \lambda_i, the eigenvalues of the covariance matrix of data are variances or data when projected on it eigenvectors. At the same time, when you fit an ellipsoid on the data, \sqrt{\lambda_i} is the radius of the ellipsoid corresponding to \boldsymbol{u}_i. Thus ignoring data projected on eigenvectors corresponding to small eigenvalues is equivalent to cutting of the axes of the ellipsoid with small radiusses.

I have explained PCA in three different ways over three articles.

  • The second article: I focused on what kind of linear transformations convariance matrices \Sigma enable, by visualizing displacement vectors. And those vectors look like swirling and extending into directions of eigenvectors of \Sigma.
  • The third article: We directly found directions where certain data distribution “swell” the most, to find that data swell the most in directions of eigenvectors.
  • In this article, we have seen PCA corresponds to only one case of quadratic functions, where the matrix A is a covariance matrix. When you go in the directions of eigenvectors corresponding to big eigenvalues, the quadratic function increases the most. Also that means data samples have bigger variances when projected on the eigenvectors. Thus you can cut off eigenvectors corresponding to small eigenvectors because they retain little information about data, and that is equivalent to fitting an ellipsoid on data and cutting off axes with small radiuses.

*Let A be a covariance matrix, and you can diagonalize it with an orthogonal matrix U as follow: U^{T}AU = \Lambda, where \Lambda = diag(\lambda_1, \dots, \lambda_D). Thus A = U \Lambda U^{T}. U is a rotation, and multiplying a \boldsymbol{x} with \Lambda means you multiply each eigenvalue to each element of \boldsymbol{x}. At the end U^T enables the reverse rotation.

If you get data like the left side of the figure below, most explanation on PCA would just fit an oval on this data distribution. However after reading this articles series so far, you would have learned to see PCA from different viewpoints like at the right side of the figure below.


5 Ellipsoids in Gaussian distributions.

I have explained that if the covariance of a data distribution is \boldsymbol{\Sigma}, the ellipsoid which fits the distribution the best is \bigl((\boldsymbol{x} - \boldsymbol{\mu}), \boldsymbol{\Sigma}^{-1}(\boldsymbol{x} - \boldsymbol{\mu})\bigr) = 1. You might have seen the part \bigl((\boldsymbol{x} - \boldsymbol{\mu}), \boldsymbol{\Sigma}^{-1}(\boldsymbol{x} - \boldsymbol{\mu})\bigr) = (\boldsymbol{x} - \boldsymbol{\mu}) \boldsymbol{\Sigma}^{-1}(\boldsymbol{x} - \boldsymbol{\mu}) somewhere else. It is the exponent of general Gaussian distributions: \mathcal{N}(\boldsymbol{x} | \boldsymbol{\mu}, \boldsymbol{\Sigma}) = \frac{1}{(2\pi)^{D/2}} \frac{1}{|\boldsymbol{\Sigma}|} exp\{ -\frac{1}{2}(\boldsymbol{x} - \boldsymbol{\mu}) \boldsymbol{\Sigma}^{-1}(\boldsymbol{x} - \boldsymbol{\mu}) \}.  It is known that the eigenvalues of \Sigma ^{-1} are \frac{1}{\lambda_1}, \dots, \frac{1}{\lambda_D}, and eigenvectors corresponding to each eigenvalue are also \boldsymbol{u}_1, \dots, \boldsymbol{u}_D respectively. Hence just as well as what we have seen, if you project (\boldsymbol{x} - \boldsymbol{\mu}) on each eigenvector of \Sigma ^{-1}, we can convert the exponent of the Gaussian distribution.

Let -\frac{1}{2}(\boldsymbol{x} - \boldsymbol{\mu}) \boldsymbol{\Sigma}^{-1}(\boldsymbol{x} - \boldsymbol{\mu}) be \boldsymbol{y} and U ^{-1} \boldsymbol{y}= U^{T} \boldsymbol{y} be \boldsymbol{y}', where U=(\boldsymbol{u}_1 \: \dots \: \boldsymbol{u}_D). Just as we have seen, (\boldsymbol{x} - \boldsymbol{\mu}) \boldsymbol{\Sigma}^{-1}(\boldsymbol{x} - \boldsymbol{\mu}) =\boldsymbol{y}^T\Sigma^{-1} \boldsymbol{y} =(U\boldsymbol{y}')^T \Sigma^{-1} U\boldsymbol{y}' =((\boldsymbol{y}')^T U^T \Sigma^{-1} U\boldsymbol{y}' = (\boldsymbol{y}')^T diag(\frac{1}{\lambda_1}, \dots, \frac{1}{\lambda_D}) \boldsymbol{y}' = \frac{({y'}_{1})^2}{\lambda_1} + \cdots + \frac{({y'}_{D})^2}{\lambda_D}. Hence \mathcal{N}(\boldsymbol{x} | \boldsymbol{\mu}, \boldsymbol{\Sigma}) = \frac{1}{(2\pi)^{D/2}} \frac{1}{|\boldsymbol{\Sigma}|} exp\{ -\frac{1}{2}(\boldsymbol{y}) \boldsymbol{\Sigma}^{-1}(\boldsymbol{y}) \} =  \frac{1}{(2\pi)^{D/2}} \frac{1}{|\boldsymbol{\Sigma}|} exp\{ -\frac{1}{2}(\frac{({y'}_{1})^2}{\lambda_1} + \cdots + \frac{({y'}_{D})^2}{\lambda_D} ) \} =\frac{1}{(2\pi)^{1/2}} \frac{1}{|\boldsymbol{\Sigma}|} exp\biggl( -\frac{1}{2} \frac{({y'}_{1})^2}{\lambda_1} \biggl) \cdots \frac{1}{(2\pi)^{1/2}} \frac{1}{|\boldsymbol{\Sigma}|} exp\biggl( -\frac{1}{2}\frac{({y'}_{D})^2}{\lambda_D} \biggl).

*To be mathematically exact about changing variants of normal distributions, you have to consider for example Jacobian matrices.

This results above demonstrate that, by projecting data on the eigenvectors of its covariance matrix, you can factorize the original multi-dimensional Gaussian distribution into a product of Gaussian distributions which are irrelevant to each other. However, at the same time, that is the potential limit of approximating data with PCA. This idea is going to be more important when you think about more probabilistic ways to handle PCA, which is more robust to lack of data.

I have explained PCA over 3 articles from various viewpoints. If you have been patient enough to read my article series, I think you have gained some deeper insight into not only PCA, but also linear algebra, and that should be helpful when you learn or teach data science. I hope my codes also help you. In fact these are not the only topics about PCA. There are a lot of important PCA-like algorithms.

In fact our expedition of ellipsoids, or PCA still continues, just as Star Wars series still continues. Especially if I have to explain an algorithm named probabilistic PCA, I need to explain the “Bayesian world” of machine learning. Most machine learning algorithms covered by major introductory textbooks tend to be too deterministic and dependent on the size of data. Many of those algorithms have another “parallel world,” where you can handle inaccuracy in better ways. I hope I can also write about them, and I might prepare another trilogy for such PCA. But I will not disappoint you, like “The Phantom Menace.”

Appendix: making a model of a bunch of grape with ellipsoid berries.

If you can control quadratic curves, reshaping and rotating them, you can make a model of a grape of olive bunch on Matplotlib. I made a program of making a model of a bunch of berries on Matplotlib using the module to draw ellipsoids which I introduced earlier. You can check the codes in this page.

*I have no idea how many people on this earth are in need of making such models.

I made some modules so that you can see the grape bunch from several angles. This might look very simple to you, but the locations of berries are organized carefully so that it looks like they are placed around a stem and that the berries are not too close to each other.


The programming code I created for this article is completly available here.

[Refereces]

[1]C. M. Bishop, “Pattern Recognition and Machine Learning,” (2006), Springer, pp. 78-83, 559-577

[2]「理工系新課程 線形代数 基礎から応用まで」, 培風館、(2017)

[3]「これなら分かる 最適化数学 基礎原理から計算手法まで」, 金谷健一著、共立出版, (2019), pp. 17-49

[4]「これなら分かる 応用数学教室 最小二乗法からウェーブレットまで」, 金谷健一著、共立出版, (2019), pp.165-208

[5] 「サボテンパイソン 」
https://sabopy.com/


How to make a toy English-German translator with multi-head attention heat maps: the overall architecture of Transformer

If you have been patient enough to read the former articles of this article series Instructions on Transformer for people outside NLP field, but with examples of NLP, you should have already learned a great deal of Transformer model, and I hope you gained a solid foundation of learning theoretical sides on this algorithm.

This article is going to focus more on practical implementation of a transformer model. We use codes in the Tensorflow official tutorial. They are maintained well by Google, and I think it is the best practice to use widely known codes.

The figure below shows what I have explained in the articles so far. Depending on your level of understanding, you can go back to my former articles. If you are familiar with NLP with deep learning, you can start with the third article.

1 The datasets

I think this article series appears to be on NLP, and I do believe that learning Transformer through NLP examples is very effective. But I cannot delve into effective techniques of processing corpus in each language. Thus we are going to use a library named BPEmb. This library enables you to encode any sentences in various languages into lists of integers. And conversely you can decode lists of integers to the language. Thanks to this library, we do not have to do simplification of alphabets, such as getting rid of Umlaut.

*Actually, I am studying in computer vision field, so my codes would look elementary to those in NLP fields.

The official Tensorflow tutorial makes a Portuguese-English translator, but in article we are going to make an English-German translator. Basically, only the codes below are my original. As I said, this is not an article on NLP, so all you have to know is that at every iteration you get a batch of (64, 41) sized tensor as the source sentences, and a batch of (64, 42) tensor as corresponding target sentences. 41, 42 are respectively the maximum lengths of the input or target sentences, and when input sentences are shorter than them, the rest positions are zero padded, as you can see in the codes below.

*If you just replace datasets and modules for encoding, you can make translators of other pairs of languages.

We are going to train a seq2seq-like Transformer model of converting those list of integers, thus a mapping from a vector to another vector. But each word, or integer is encoded as an embedding vector, so virtually the Transformer model is going to learn a mapping from sequence data to another sequence data. Let’s formulate this into a bit more mathematics-like way: when we get a pair of sequence data \boldsymbol{X} = (\boldsymbol{x}^{(1)}, \dots, \boldsymbol{x}^{(\tau _x)}) and \boldsymbol{Y} = (\boldsymbol{y}^{(1)}, \dots, \boldsymbol{y}^{(\tau _y)}), where \boldsymbol{x}^{(t)} \in \mathbb{R}^{|\mathcal{V}_{\mathcal{X}}|}, \boldsymbol{x}^{(t)} \in \mathbb{R}^{|\mathcal{V}_{\mathcal{Y}}|}, respectively from English and German corpus, then we learn a mapping f: \boldsymbol{X} \to \boldsymbol{Y}.

*In this implementation the vocabulary sizes are both 10002. Thus |\mathcal{V}_{\mathcal{X}}|=|\mathcal{V}_{\mathcal{Y}}|=10002

2 The whole architecture

This article series has covered most of components of Transformer model, but you might not understand how seq2seq-like models can be constructed with them. It is very effective to understand how transformer is constructed by actually reading or writing codes, and in this article we are finally going to construct the whole architecture of a Transforme translator, following the Tensorflow official tutorial. At the end of this article, you would be able to make a toy English-German translator.

The implementation is mainly composed of 4 classes, EncoderLayer(), Encoder(), DecoderLayer(), and Decoder() class. The inclusion relations of the classes are displayed in the figure below.

To be more exact in a seq2seq-like model with Transformer, the encoder and the decoder are connected like in the figure below. The encoder part keeps converting input sentences in the original language through N layers. The decoder part also keeps converting the inputs in the target languages, also through N layers, but it receives the output of the final layer of the Encoder at every layer.

You can see how the Encoder() class and the Decoder() class are combined in Transformer in the codes below. If you have used Tensorflow or Pytorch to some extent, the codes below should not be that hard to read.

3 The encoder

*From now on “sentences” do not mean only the input tokens in natural language, but also the reweighted and concatenated “values,” which I repeatedly explained in explained in the former articles. By the end of this section, you will see that Transformer repeatedly converts sentences layer by layer, remaining the shape of the original sentence.

I have explained multi-head attention mechanism in the third article, precisely, and I explained positional encoding and masked multi-head attention in the last article. Thus if you have read them and have ever written some codes in Tensorflow or Pytorch, I think the codes of Transformer in the official Tensorflow tutorial is not so hard to read. What is more, you do not use CNNs or RNNs in this implementation. Basically all you need is linear transformations. First of all let’s see how the EncoderLayer() and the Encoder() classes are implemented in the codes below.

You might be confused what “Feed Forward” means in  this article or the original paper on Transformer. The original paper says this layer is calculated as FFN(x) = max(0, xW_1 + b_1)W_2 +b_2. In short you stack two fully connected layers and activate it with a ReLU function. Let’s see how point_wise_feed_forward_network() function works in the implementation with some simple codes. As you can see from the number of parameters in each layer of the position wise feed forward neural network, the network does not depend on the length of the sentences.

From the number of parameters of the position-wise feed forward neural networks, you can see that you share the same parameters over all the positions of the sentences. That means in the figure above, you use the same densely connected layers at all the positions, in single layer. But you also have to keep it in mind that parameters for position-wise feed-forward networks change from layer to layer. That is also true of “Layer” parts in Transformer model, including the output part of the decoder: there are no learnable parameters which cover over different positions of tokens. These facts lead to one very important feature of Transformer: the number of parameters does not depend on the length of input or target sentences. You can offset the influences of the length of sentences with multi-head attention mechanisms. Also in the decoder part, you can keep the shape of sentences, or reweighted values, layer by layer, which is expected to enhance calculation efficiency of Transformer models.

4, The decoder

The structures of DecoderLayer() and the Decoder() classes are quite similar to those of EncoderLayer() and the Encoder() classes, so if you understand the last section, you would not find it hard to understand the codes below. What you have to care additionally in this section is inter-language multi-head attention mechanism. In the third article I was repeatedly explaining multi-head self attention mechanism, taking the input sentence “Anthony Hopkins admired Michael Bay as a great director.” as an example. However, as I explained in the second article, usually in attention mechanism, you compare sentences with the same meaning in two languages. Thus the decoder part of Transformer model has not only self-attention multi-head attention mechanism of the target sentence, but also an inter-language multi-head attention mechanism. That means, In case of translating from English to German, you compare the sentence “Anthony Hopkins hat Michael Bay als einen großartigen Regisseur bewundert.” with the sentence itself in masked multi-head attention mechanism (, just as I repeatedly explained in the third article). On the other hand, you compare “Anthony Hopkins hat Michael Bay als einen großartigen Regisseur bewundert.” with “Anthony Hopkins admired Michael Bay as a great director.” in the inter-language multi-head attention mechanism (, just as you can see in the figure above).

*The “inter-language multi-head attention mechanism” is my original way to call it.

I briefly mentioned how you calculate the inter-language multi-head attention mechanism in the end of the third article, with some simple codes, but let’s see that again, with more straightforward figures. If you understand my explanation on multi-head attention mechanism in the third article, the inter-language multi-head attention mechanism is nothing difficult to understand. In the multi-head attention mechanism in encoder layers, “queries”, “keys”, and “values” come from the same sentence in English, but in case of inter-language one, only “keys” and “values” come from the original sentence, and “queries” come from the target sentence. You compare “queries” in German with the “keys” in the original sentence in English, and you re-weight the sentence in English. You use the re-weighted English sentence in the decoder part, and you do not need look-ahead mask in this inter-language multi-head attention mechanism.

Just as well as multi-head self-attention, you can calculate inter-language multi-head attention mechanism as follows: softmax(\frac{\boldsymbol{Q} \boldsymbol{K} ^T}{\sqrt{d}_k}). In the example above, the resulting multi-head attention map is a 10 \times 9 matrix like in the figure below.

Once you keep the points above in you mind, the implementation of the decoder part should not be that hard.

5 Masking tokens in practice

I explained masked-multi-head attention mechanism in the last article, and the ideas itself is not so difficult. However in practice this is implemented in a little tricky way. You might have realized that the size of input matrices is fixed so that it fits the longest sentence. That means, when the maximum length of the input sentences is 41, even if the sentences in a batch have less than 41 tokens, you sample (64, 41) sized tensor as a batch every time (The 64 is a batch size). Let “Anthony Hopkins admired Michael Bay as a great director.”, which has 9 tokens in total, be an input. We have been considering calculating (9, 9) sized attention maps or (10, 9) sized attention maps, but in practice you use (41, 41) or (42, 41) sized ones. When it comes to calculating self attentions in the encoder part, you zero pad self attention maps with encoder padding masks, like in the figure below. The black dots denote the zero valued elements.

As you can see in the codes below, encode padding masks are quite simple. You just multiply the padding masks with -1e9 and add them to attention maps and apply a softmax function. Thereby you can zero-pad the columns in the positions/columns where you added -1e9 to.

I explained look ahead mask in the last article, and in practice you combine normal padding masks and look ahead masks like in the figure below. You can see that you can compare each token with only its previous tokens. For example you can compare “als” only with “Anthony”, “Hopkins”, “hat”, “Michael”, “Bay”, “als”, not with “einen”, “großartigen”, “Regisseur” or “bewundert.”

Decoder padding masks are almost the same as encoder one. You have to keep it in mind that you zero pad positions which surpassed the length of the source input sentence.

6 Decoding process

In the last section we have seen that we can zero-pad columns, but still the rows are redundant. However I guess that is not a big problem because you decode the final output in the direction of the rows of attention maps. Once you decode <end> token, you stop decoding. The redundant rows would not affect the decoding anymore.

This decoding process is similar to that of seq2seq models with RNNs, and that is why you need to hide future tokens in the self-multi-head attention mechanism in the decoder. You share the same densely connected layers followed by a softmax function, at all the time steps of decoding. Transformer has to learn how to decode only based on the words which have appeared so far.

According to the original paper, “We also modify the self-attention sub-layer in the decoder stack to prevent positions from attending to subsequent positions. This masking, combined with fact that the output embeddings are offset by one position, ensures that the predictions for position i can depend only on the known outputs at positions less than i.” After these explanations, I think you understand the part more clearly.

The codes blow is for the decoding part. You can see that you first start decoding an output sentence with a sentence composed of only <start>, and you decide which word to decoded, step by step.

*It easy to imagine that this decoding procedure is not the best. In reality you have to consider some possibilities of decoding, and you can do that with beam search decoding.

After training this English-German translator for 30 epochs you can translate relatively simple English sentences into German. I displayed some results below, with heat maps of multi-head attention. Each colored attention maps corresponds to each head of multi-head attention. The examples below are all from the fourth (last) layer, but you can visualize maps in any layers. When it comes to look ahead attention, naturally only the lower triangular part of the maps is activated.

This article series has not covered some important topics machine translation, for example how to calculate translation errors. Actually there are many other fascinating topics related to machine translation. For example beam search decoding, which consider some decoding possibilities, or other topics like how to handle proper nouns such as “Anthony” or “Hopkins.” But this article series is not on NLP. I hope you could effectively learn the architecture of Transformer model with examples of languages so far. And also I have not explained some details of training the network, but I will not cover that because I think that depends on tasks. The next article is going to be the last one of this series, and I hope you can see how Transformer is applied in computer vision fields, in a more “linguistic” manner.

But anyway we have finally made it. In this article series we have seen that one of the earliest computers was invented to break Enigma. And today we can quickly make a more or less accurate translator on our desk. With Transformer models, you can even translate deadly funny jokes into German.

*You can train a translator with this code.

*After training a translator, you can translate English sentences into German with this code.

[References]

[1] Ashish Vaswani, Noam Shazeer, Niki Parmar, Jakob Uszkoreit, Llion Jones, Aidan N. Gomez, Lukasz Kaiser, Illia Polosukhin, “Attention Is All You Need” (2017)

[2] “Transformer model for language understanding,” Tensorflow Core
https://www.tensorflow.org/overview

[3] Jay Alammar, “The Illustrated Transformer,”
http://jalammar.github.io/illustrated-transformer/

[4] “Stanford CS224N: NLP with Deep Learning | Winter 2019 | Lecture 14 – Transformers and Self-Attention,” stanfordonline, (2019)
https://www.youtube.com/watch?v=5vcj8kSwBCY

[5]Tsuboi Yuuta, Unno Yuuya, Suzuki Jun, “Machine Learning Professional Series: Natural Language Processing with Deep Learning,” (2017), pp. 91-94
坪井祐太、海野裕也、鈴木潤 著, 「機械学習プロフェッショナルシリーズ 深層学習による自然言語処理」, (2017), pp. 191-193

* I make study materials on machine learning, sponsored by DATANOMIQ. I do my best to make my content as straightforward but as precise as possible. I include all of my reference sources. If you notice any mistakes in my materials, including grammatical errors, please let me know (email: yasuto.tamura@datanomiq.de). And if you have any advice for making my materials more understandable to learners, I would appreciate hearing it.

Five ways Data Science is used in Fintech

Data science experts process and act upon data that digital resources produce. In the fintech world, data comes from mobile apps, transactions, conversations and financial standings. With this data for fintech, experts can improve the experience and success of businesses and customers alike.

Apps like PayPal, Venmo and Cash App have led the way for other fintech organizations, big and small, to grow. In fact, roughly 65% of Americans are already using digital banking in some capacity, whether it’s an app or online service. This growth, in turn, brings benefits. From personalization to integrating robotic advisors, here are five ways data scientists help fintech brands.

1. Personalization

Finance is one of the most personal industries out there as it deals with your private accounts and data. To match this uniqueness, fintechs can use data science for personalization. That way, customer service caters to individual needs.

As the fintech company gathers data from individual transactions, communications, behavior and interests, data scientists can then use said data to curate a better experience for the customer. They can advertise products and services that the customer may need to help with savings, for instance.

Contis is one example of a fintech that has integrated personalization into its services. Customers receive specific recommendations to create an efficient experience.

2. Fundraising

Fundraising had an interesting year in 2020. Amid racial justice protests and movements, crowdfunding took off on fintechs like GoFundMe and Kickstarter. These platforms helped provide funding for those who needed it. From here, data scientists can use fundraising in unique ways.

They can help raise money by targeting people who have donated in the past, or who are likely to donate based on spending habits. This data provides a more well-rounded fundraising campaign.

Then, once they do have donors, they can again use data to segment contributors by interest, demographic or engagement history. This segmentation helps advertise in a more personal, interest-specific way.

3. Fraud Detection

Cybercriminals thrive on an abundance of digital interactions. With the rise in digital banking — and the pandemic-driven shift to technology — fintechs could potentially see high rates of fraud. In fact, by the end of 2020, the United States saw about $11 billion in lost funds from credit card fraud alone.

Data for fintech brands will help address and prevent fraud like this in the future. As customers produce data from their transactions and interactions, it provides a better picture of their behavior. If there’s deviance, the data then shows potential fraud may be occurring.

If fraud does occur, data scientists can then use that instance to learn and properly recognize how data behaves during cybercriminal activity.

4. Robo-Advisors

With more people using fintech services, employees have a lot on their hands. They must properly address the customers’ needs and provide solutions. However, in the online world, employees are now getting some robotic assistance.

Robo-advisors use machine learning algorithms to interact with customers online or on mobile apps. They ask questions, understand the problems and provide solutions. They also collect data like customer goals and financial plans, which they can report back to data scientists for analysis.

Overall, roughly 75% and 46% of large and small banks, respectively, are implementing artificial intelligence to some degree. This data-driven revolution is one to keep your eye on.

5. Blockchain Governance

Blockchain governance is a somewhat newer way that experts can use data for fintech services. The blockchain is commonly known for its support of cryptocurrency services. Though crypto assets like Bitcoin and Ethereum are on the rise, the blockchain itself is still getting its footing.

Now, fintechs like PayPal are offering crypto services, which means data scientists will be able to expand what’s possible for digital banking. As customers transfer crypto funds, data scientists can monitor their activity and get a better handle on the data that exists on the blockchain. From there, they can provide personalization and prevent fraud in the same ways as they would with standard digital banking.

A Changing Landscape

As data scientists continue to help fintech services grow, you’ll notice each of these five areas begins to become more common. Some, like personalization and fraud detection, are already key focuses for fintech companies. However, alongside robo-advisor, fundraising and blockchain, they all have room to grow through the use of data science.

Positional encoding, residual connections, padding masks: covering the rest of Transformer components

This is the fourth article of my article series named “Instructions on Transformer for people outside NLP field, but with examples of NLP.”

1 Wrapping points up so far

This article series has already covered a great deal of the Transformer mechanism. Whether you have read my former articles or not, I bet you are more or less lost in the course of learning Transformer model. The left side of the figure below is from the original paper on Transformer model, and my previous articles explained the parts in each colored frame. In the first article, I  mainly explained how language is encoded in deep learning task and how that is evaluated.

This is more of a matter of inputs and the outputs of deep learning networks, which are in blue dotted frames in the figure. They are not so dependent on types of deep learning NLP tasks. In the second article, I explained seq2seq models, which are encoder-decoder models used in machine translation. Seq2seq models can can be simplified like the figure in the orange frame. In the article I mainly explained seq2seq models with RNNs, but the purpose of this article series is ultimately replace them with Transformer models. In the last article, I finally wrote about some actual components of Transformer models: multi-head attention mechanism. I think this mechanism is the core of Transformed models, and I did my best to explain it with a whole single article, with a lot of visualizations. However, there are still many elements I have not explained.

First, you need to do positional encoding to the word embedding so that Transformer models can learn the relations of the positions of input tokens. At least I was too stupid to understand what this is only with the original paper on Transformer. I am going to explain this algorithm in illustrative ways, which I needed to self-teach it. The second point is residual connections.

The last article has already explained multi-head attention, as precisely as I could do, but I still have to say I covered only two multi-head attention parts in a layer of Transformer model, which are in pink frames. During training, you have to mask some tokens at the decoder part so that some of tokens are invisible, and masked multi-head attention enables that.

You might be tired of the words “queries,” “keys,” and “values,” if you read the last article. But in fact that was not enough. When you think about applying Transformer in other tasks, such as object detection or image generation, you need to reconsider what the structure of data and how “queries,” “keys,” and “values,” correspond to each elements of the data, and probably one of my upcoming articles would cover this topic.

2 Why Transformer?

One powerful strength of Transformer model is its parallelization. As you saw in the last article, Trasformer models enable calculating relations of tokens to all other tokens, on different standards, independently in each head. And each head requires very simple linear transformations. In case of RNN encoders, if an input has \tau tokens, basically you have to wait for \tau time steps to finish encoding the input sentence. Also, at the time step (\tau) the RNN cell retains the information at the time step (1) only via recurrent connections. In this way you cannot attend to tokens in the earlier time steps, and this is obviously far from how we compare tokens in a sentence. You can bring information backward by bidirectional connection s in RNN models, but that all the more deteriorate parallelization of the model. And possessing information via recurrent connections, like a telephone game, potentially has risks of vanishing gradient problems. Gated RNN, such as LSTM or GRU mitigate the problems by a lot of nonlinear functions, but that adds to computational costs. If you understand multi-head attention mechanism, I think you can see that Transformer solves those problems.

I guess this is closer to when you speak a foreign language which you are fluent in. You wan to say something in a foreign language, and you put the original sentence in your mother tongue in the “encoder” in your brain. And you decode it, word by word, in the foreign language. You do not have to wait for the word at the end in your language, or rather you have to consider the relations of of a chunk of words to another chunk of words, in forward and backward ways. This is crucial especially when Japanese people speak English. You have to make the conclusion clear in English usually with the second word, but the conclusion is usually at the end of the sentence in Japanese.

3 Positional encoding

I explained disadvantages of RNN in the last section, but RNN has been a standard algorithm of neural machine translation. As I mentioned in the fourth section of the first article of my series on RNN, other neural nets like fully connected layers or convolutional neural networks cannot handle sequence data well. I would say RNN could be one of the only algorithms to handle sequence data, including natural language data, in more of classical methods of time series data processing.

*As I explained in this article, the original idea of RNN was first proposed in 1997, and I would say the way it factorizes time series data is very classical, and you would see similar procedures in many other algorithms. I think Transformer is a successful breakthrough which gave up the idea of processing sequence data time step by time step.

You might have noticed that multi-head attention mechanism does not explicitly uses the the information of the orders or position of input data, as it basically calculates only the products of matrices. In the case where the input is “Anthony Hopkins admired Michael Bay as a great director.”, multi head attention mechanism does not uses the information that “Hopkins” is the second token, or the information that the token two time steps later is “Michael.” Transformer tackles this problem with an almost magical algorithm named positional encoding.

In order to learn positional encoding, you should first think about what kind of encoding is ideal. According to this blog post, ideal encoding of positions of tokens have the following features.

  • Positional encoding of one token deterministically represents the position of the token.
  • The actual values of positional encoding should not be too big compared to the values of elements of embedding vectors.
  • Positional encodings of different tokens should successfully express their relative positions.

The most straightforward way to give the information of position is implementing the index of times steps (t), but if you naively give the term (t) to the data, the term could get too big compared to the values of data ,for example when the sequence data is 100 time steps long. The next straightforward idea is compressing the idea of time steps to for example the range [0, 1]. With this approach, however, the resolution of encodings can vary depending on the length of the input sequence data. Thus these naive approaches do not meet the requirements above, and I guess even conventional RNN-based models were not so successful in these points.

*I guess that is why attention mechanism of RNN seq2seq models, which I explained in the second article, was successful. You can constantly calculate the relative positions of decoder tokens compared to the encoder tokens.

Positional encoding, to me almost magically, meets the points I have mentioned. However the explanation of positional encoding in the original paper of Transformer is unkindly brief. It says you can encode positions of tokens with the following vector PE_{(pos, 2i)} = sin(pos / 10000^{2i/d_model}), PE_{(pos, 2i+1)} = cos(pos / 10000^{2i/d_model}), where i = 0, 1, \dots, d_{model}/2 - 1. d_{model} is the dimension of word embedding. The heat map below is the most typical type of visualization of positional encoding you would see everywhere, and in this case d_{model}=256, and pos is discrete number which varies from 0 to 49, thus the heat map blow is equal to a 50\times 256 matrix, whose elements are from -1 to 1. Each row of the graph corresponds to one token, and you can see that lower dimensional part is constantly changing like waves. Also it is quite easy to encode an input with this positional encoding: assume that you have a matrix of an input sentence composed of 50 tokens, each of which is a 256 dimensional vector, then all you have to do is just adding the heat map below to the matrix.

Concretely writing down, the encoding of the 256-dim token at pos  is (PE_{(pos, 0)}, PE_{(pos, 1)}, \dots ,  PE_{(pos, 254)}, PE_{(pos, 255)})^T = \bigl( sin(pos / 10000^{0/256}), cos(pos / 10000^{0/256}) \bigr),  \dots , \bigl( sin(pos / 10000^{254/256}), cos(pos / 10000^{254/256}) \bigr)^T.

You should see this encoding more as d_{model} / 2 pairs of circles rather than d_{model} dimensional vectors. When you fix the i, the index of the depth of each encoding, you can extract a 2 dimensional vector \boldsymbol{PE}_i = \bigl( sin(pos / 10000^{2i/d_model}), cos(pos / 10000^{2i/d_model}) \bigr). If you constantly change the value pos, the vector \boldsymbol{PE}_i rotates clockwise on the unit circle in the figure below.

Also, the deeper the dimension of the embedding is, I mean the bigger the index i is, the smaller the frequency of rotation is. I think the video below is a more intuitive way to see how each token is encoded with positional encoding. You can see that the bigger pos is, that is the more tokens an input has, the deeper part positional encoding starts to rotate on the circles.


Very importantly, the original paper of Transformer says, “We chose this function because we hypothesized it would allow the model to easily learn to attend by relative positions, since for any fixed offset k, PE_{pos+k} can be represented as a linear function of PE_{pos}.” For each circle at any depth, I mean for any i, the following simple equation holds:

\left( \begin{array}{c} sin(\frac{pos+k}{10000^{2i/d_{model}}}) \\ cos(\frac{pos+k}{10000^{2i/d_{model}}}) \end{array} \right) =
\left( \begin{array}{ccc} cos(\frac{k}{10000^{2i/d_{model}}}) & sin(\frac{k}{10000^{2i/d_{model}}}) \\ -sin(\frac{k}{10000^{2i/d_{model}}}) & cos(\frac{k}{10000^{2i/d_{model}}}) \\ \end{array} \right) \cdot \left( \begin{array}{c} sin(\frac{pos}{10000^{2i/d_{model}}}) \\ cos(\frac{pos}{10000^{2i/d_{model}}}) \end{array} \right)

The matrix is a simple rotation matrix, so if i is fixed the rotation only depends on k, how many positions to move forward or backward. Then we get a very important fact: as the pos changes (pos is a discrete number), each point rotates in proportion to the offset of “pos,” with different frequencies depending on the depth of the circles. The deeper the circle is, the smaller the frequency is. That means, this type of positional encoding encourages Transformer models to learn definite and relative positions of tokens with rotations of those circles, and the values of each element of the rotation matrices are from -1 to 1, so they do not get bigger no matter how many tokens inputs have.

For example when an input is “Anthony Hopkins admired Michael Bay as a great director.”, a shift from the token “Hopkins” to “Bay” is a rotation matrix  \left( \begin{array}{ccc} cos(\frac{k}{10000^{2i/d_{model}}}) & sin(\frac{k}{10000^{2i/d_{model}}}) \\ -sin(\frac{k}{10000^{2i/d_{model}}}) & cos(\frac{k}{10000^{2i/d_{model}}}) \\ \end{array} \right), where k=3. Also the shift from “Bay” to “great” has the same rotation.

*Positional encoding reminded me of Enigma, a notorious cipher machine used by Nazi Germany. It maps alphabets to different alphabets with different rotating gear connected by cables. With constantly changing gears and keys, it changed countless patterns of alphabetical mappings, every day, which is impossible for humans to solve. One of the first form of computers was invented to break Enigma.

*As far as I could understand from “Imitation Game (2014).”

*But I would say Enigma only relied on discrete deterministic algebraic mapping of alphabets. The rotations of positional encoding is not that tricky as Enigma, but it can encode both definite and deterministic positions of much more variety of tokens. Or rather I would say AI algorithms developed enough to learn such encodings with subtle numerical changes, and I am sure development of NLP increased the possibility of breaking the Turing test in the future.

5 Residual connections

If you naively stack neural networks with simple implementation, that would suffer from vanishing gradient problems during training. Back propagation is basically multiplying many gradients, so

One way to mitigate vanishing gradient problems is quite easy: you have only to make a bypass of propagation. You would find a lot of good explanations on residual connections, so I am not going to explain how this is effective for vanishing gradient problems in this article.

In Transformer models you add positional encodings to the input only in the first layer, but I assume that the encodings remain through the layers by these bypass routes, and that might be one of reasons why Transformer models can retain information of positions of tokens.

6 Masked multi-head attention

Even though Transformer, unlike RNN, can attend to the whole input sentence at once, the decoding process of Transformer-based translator is close to RNN-based one, and you are going to see that more clearly in the codes in the next article. As I explained in the second article, RNN decoders decode each token only based on the tokens the have generated so far. Transformer decoder also predicts the output sequences autoregressively one token at a time step, just as RNN decoders. I think it easy to understand this process because RNN decoder generates tokens just as you connect RNN cells one after another, like connecting rings to a chain. In this way it is easy to make sure that generating of one token in only affected by the former tokens. On the other hand, during training Transformer decoders, you input the whole sentence at once. That means Transformer decoders can see the whole sentence during training. That is as if a student preparing for a French translation test could look at the whole answer French sentences. It is easy to imagine that you cannot prepare for the French test effectively if you study this way. Transformer decoders also have to learn to decode only based on the tokens they have generated so far.

In order to properly train a Transformer-based translator to learn such decoding, you have to hide the upcoming tokens in target sentences during training. During calculating multi-head attentions in each Transformer layer, if you keep ignoring the weights from up coming tokens like in the figure below, it is likely that Transformer models learn to decode only based on the tokens generated so far. This is called masked multi-head attention.

*I am going to take an input “Anthonly Hopkins admire Michael Bay as a great director.” as an example of calculating masked multi-head attention mechanism, but this is supposed to be in the target laguage. So when you train an translator from English to German, in practice you have to calculate masked multi-head atetntion of “Anthony Hopkins hat Michael Bay als einen großartigen Regisseur bewundert.”

As you can see from the whole architecture of Transformer, you only need to consider masked multi-head attentions of of self-attentions of the input sentences at the decoder side. In order to concretely calculate masked multi-head attentions, you need a technique named look ahead masking. This is also quite simple. Just as well as the last article, let’s take an example of calculating self attentions of an input “Anthony Hopkins admired Michael Bay as a great director.” Also in this case you just calculate multi-head attention as usual, but when you get the histograms below, you apply look ahead masking to each histogram and delete the weights from the future tokens. In the figure below the black dots denote zero, and the sum of each row of the resulting attention map is also one. In other words, you get a lower triangular matrix, the sum of whose each row is 1.

Also just as I explained in the last article, you reweight vlaues with the triangular attention map. The figure below is calculating a transposed masked multi-head attention because I think it is a more straightforward way to see how vectors are reweighted in multi-head attention mechanism.

When you closely look at how each column of the transposed multi-head attention is reweighted, you can clearly see that the token is reweighted only based on the tokens generated so far.

*If you are still not sure why you need such masking in multi-head attention of target sentences, you should proceed to the next article for now. Once you check the decoding processes of Transformer-based translators, you would see why you need masked multi-head attention mechanism on the target sentence during training.

If you have read my articles, at least this one and the last one, I think you have gained more or less clear insights into how each component of Transfomer model works. You might have realized that each components require simple calculations. Combined with the fact that multi-head attention mechanism is highly parallelizable, Transformer is easier to train, compared to RNN.

In this article, we are going to see how masking of multi-head attention is implemented and how the whole Transformer structure is constructed. By the end of the next article, you would be able to create a toy English-German translator with more or less clear understanding on its architecture.

Appendix

You can visualize positional encoding the way I explained with simple Python codes below. Please just copy and paste them, importing necessary libraries. You can visualize positional encoding as both heat maps and points rotating on rings, and in this case the dimension of word embedding is 256, and the maximum length of sentences is 50.

# I borrowed this code from Tensorflow official tutorial. 
# https://www.tensorflow.org/tutorials/text/transformer

import matplotlib as mpl
from mpl_toolkits.mplot3d import Axes3D
import numpy as np
import matplotlib.pyplot as plt
from matplotlib import cm

def get_angles(pos, i, d_model):
  angle_rates = 1 / np.power(10000, (2 * (i//2)) / np.float32(d_model))
  return pos * angle_rates

def positional_encoding(position, d_model):
  angle_rads = get_angles(np.arange(position)[:, np.newaxis],
                          np.arange(d_model)[np.newaxis, :],
                          d_model)

  # apply sin to even indices in the array; 2i
  angle_rads[:, 0::2] = np.sin(angle_rads[:, 0::2])

  # apply cos to odd indices in the array; 2i+1
  angle_rads[:, 1::2] = np.cos(angle_rads[:, 1::2])

  pos_encoding = angle_rads[np.newaxis, ...]

  return pos_encoding.astype(np.float32)

resolution = 50
d_model = 256

n, d = resolution, d_model
pos_encoding = positional_encoding(n, d)
pos_encoding = pos_encoding[0]

plt.figure(figsize=(25, 10))
plt.pcolormesh(pos_encoding, cmap='RdBu')
plt.gca().invert_yaxis()
plt.ylabel('pos (the position of token)', fontsize=30)
plt.xlabel('2i, 2i+1', fontsize=30)
plt.colorbar()
plt.title("Positional encoding of 50 256-d tokens", fontsize=40)
plt.savefig("positional_encoding_heat_map.png")
plt.show()


import matplotlib as mpl
from mpl_toolkits.mplot3d import Axes3D
import numpy as np
import matplotlib.pyplot as plt
from matplotlib import cm

def get_angles(pos, i, d_model):
  angle_rates = 1 / np.power(10000, (2 * (i//2)) / np.float32(d_model))
  return pos * angle_rates

def positional_encoding(position, d_model):
  angle_rads = get_angles(np.arange(position)[:, np.newaxis],
                          np.arange(d_model)[np.newaxis, :],
                          d_model)

  # apply sin to even indices in the array; 2i
  angle_rads[:, 0::2] = np.sin(angle_rads[:, 0::2])

  # apply cos to odd indices in the array; 2i+1
  angle_rads[:, 1::2] = np.cos(angle_rads[:, 1::2])

  pos_encoding = angle_rads[np.newaxis, ...]

  return pos_encoding.astype(np.float32)


# A function to mix blue and red colors. 
def blue_red_gradation(x, y):
    red = np.array([1.0, 0.0, 0.0])
    blue = np.array([0.0, 0.0, 1.0])
    combined_color_x = (max(0, x)*blue + abs(min(x, 0))*red)/(abs(x) + abs(y))
    combined_color_y = (max(0, y)*blue + abs(min(y, 0))*red)/(abs(x) + abs(y))
    combined_color = (combined_color_x*abs(x) + combined_color_y*abs(y))/(abs(x) + abs(y))
    return combined_color[np.newaxis, ...]


resolution = 50
d_model = 256
x_range = 512
x_coordinates = np.linspace(0, d_model//2 - 1, d_model//2)
radius = 1
angular_velocity = np.pi / 12
y_coordinates = radius*np.cos(np.linspace(0, 1, resolution)*2*np.pi)
z_coordinates = radius*np.sin(np.linspace(0, 1, resolution)*2*np.pi)


n, d = resolution, d_model
pos_encoding = positional_encoding(n, d)
pos_encoding = pos_encoding[0]


#ax = fig.add_subplot(1, 1, 1, projection='3d')
color_vec = [[1., 0., 1.]]

markersize = 1
for j in range(resolution):
#for j in range(5):
    fig = plt.figure(figsize=(25, 10))
    ax = fig.gca(projection='3d')
    for i in range(d_model//2):
        ax.plot(x_coordinates[i]*np.ones(len(y_coordinates)), y_coordinates, z_coordinates, c='black', alpha=0.2)
    
    
    for i in range(len(x_coordinates)):
        ax.scatter(x_coordinates[i], radius*pos_encoding[:, 0::2][j, i], radius*pos_encoding[:, 1::2][j, i], 
                   c=blue_red_gradation(pos_encoding[:, 0::2][j, i], pos_encoding[:, 1::2][j, i]), alpha=0.5, s=20)
        ax.grid(False)

    ax.set_title(r'No. {} token  (pos)'.format(j+1), fontsize=40)
    ax.set_xlabel(r"i  (index of dimension)", fontsize=40)
    ax.set_ylabel(r'PE_{(pos, 2i)}', fontsize=40)
    ax.set_zlabel(r'PE_{(pos, 2i+1)}', fontsize=40)
    ax.set_xticks(np.arange(0, d_model//2, 10))
    plt.subplots_adjust(left=0, right=1, bottom=0, top=1)
    #plt.savefig('./positional_encoding_gif/{}.png'.format(j+1))
    plt.show()


*In fact some implementations use different type of positional encoding, as you can see in the codes below. In this case, embedding vectors are roughly divided into two parts, and each part is encoded with different sine waves. I have been using a metaphor of rotating rings or gears in this article to explain positional encoding, but to be honest that is not necessarily true of all the types of Transformer implementation. Some papers compare different types of pairs of positional encoding. The most important point is, Transformer models is navigated to learn positions of tokens with certain types of mathematical patterns.

[References]

[1] Ashish Vaswani, Noam Shazeer, Niki Parmar, Jakob Uszkoreit, Llion Jones, Aidan N. Gomez, Lukasz Kaiser, Illia Polosukhin, “Attention Is All You Need” (2017)

[2] “Transformer model for language understanding,” Tensorflow Core
https://www.tensorflow.org/overview

[3] Jay Alammar, “The Illustrated Transformer,”
http://jalammar.github.io/illustrated-transformer/

[4] “Stanford CS224N: NLP with Deep Learning | Winter 2019 | Lecture 14 – Transformers and Self-Attention,” stanfordonline, (2019)
https://www.youtube.com/watch?v=5vcj8kSwBCY

[5]Harada Tatsuya, “Machine Learning Professional Series: Image Recognition,” (2017), pp. 191-193
原田達也 著, 「機械学習プロフェッショナルシリーズ 画像認識」, (2017), pp. 191-193

[6] Amirhossein Kazemnejad, “Transformer Architecture: The Positional Encoding
Let’s use sinusoidal functions to inject the order of words in our model”, Amirhossein Kazemnejad’s Blog, (2019)
https://kazemnejad.com/blog/transformer_architecture_positional_encoding/

[7] Nicolas Carion, Francisco Massa, Gabriel Synnaeve, Nicolas Usunier, Alexander Kirillov, Sergey Zagoruyko, “End-to-End Object Detection with Transformers,” (2020)

[8]中西 啓、「【第5回】機械式暗号機の傑作~エニグマ登場~」、HH News & Reports, (2011)
https://www.hummingheads.co.jp/reports/series/ser01/110714.html

[9]中西 啓、「【第6回】エニグマ解読~第2次世界大戦とコンピュータの誕生~」、HH News & Reports, (2011)

[10]Tsuboi Yuuta, Unno Yuuya, Suzuki Jun, “Machine Learning Professional Series: Natural Language Processing with Deep Learning,” (2017), pp. 91-94
坪井祐太、海野裕也、鈴木潤 著, 「機械学習プロフェッショナルシリーズ 深層学習による自然言語処理」, (2017), pp. 191-193

[11]”Stanford CS224N: NLP with Deep Learning | Winter 2019 | Lecture 8 – Translation, Seq2Seq, Attention”, stanfordonline, (2019)
https://www.youtube.com/watch?v=XXtpJxZBa2c

* I make study materials on machine learning, sponsored by DATANOMIQ. I do my best to make my content as straightforward but as precise as possible. I include all of my reference sources. If you notice any mistakes in my materials, including grammatical errors, please let me know (email: yasuto.tamura@datanomiq.de). And if you have any advice for making my materials more understandable to learners, I would appreciate hearing it.


Data Mining Process flow – Easy Understanding

1 Overview

Development of computer processing power, network and automated software completely change and give new concept of each business. And data mining play the vital part to solve, finding the hidden patterns and relationship from large dataset with business by using sophisticated data analysis tools like methodology, method, process flow etc.

On this paper, proposed a process flow followed CRISP-DM methodology and has six steps where data understanding does not considered.

Phase of new process flow given below:-

Phase 1: Involved with collection, outliner treatment, imputation, transformation, scaling, and partition dataset in to two sub-frames (Training and Testing). Here as an example for outliner treatment, imputation, transformation, scaling consider accordingly Z score, mean, One hot encoding and Min Max Scaler.

Phase 2: On this Phase training and testing data balance with same balancing algorithm but separately. As an example here SMOTE (synthetic minority oversampling technique) is considered.

Phase 3: This phase involved with reduction, selection, aggregation, extraction. But here for an example considering same feature reduction algorithm (LDA -Linear Discriminant analysis) on training and testing data set separately.

Phase 4: On this Phase Training data set again partition into two more set (Training and Validation).

Phase 5: This Phase considering several base algorithms as a base model like CNN, RNN, Random forest, MLP, Regression, Ensemble method. This phase also involve to find out best hyper parameter and sub-algorithm for each base algorithm. As an example on this paper consider two class classification problems and also consider Random forest (Included CART – Classification and Regression Tree and GINI index impurity) and MLP classifier (Included (Relu, Sigmoid, binary cross entropy, Adam – Adaptive Moment Estimation) as base algorithms.

Phase 6: First, Prediction with validation data then evaluates with Test dataset which is fully unknown for these (Random forest, MLP classifier) two base algorithms. Then calculate the confusion matrix, ROC, AUC to find the best base algorithm.

New method from phase 1 to phase 4 followed CRISP-DM methodology steps such as data collection, data preparation then phase 5 followed modelling and phase 6 followed evaluation and implementation steps.

Structure of proposed process flow for two class problem combined with algorithm and sub-algorithm display on figure – 1.

These articles mainly focus to describe all algorithms which are going to implementation for better understanding.


Data Mining Process Flow

Figure 1 – Data Mining Process Flow

2 Phase 1: Outlier treatment, Transform, Scaling, Imputation

This phase involved with outlier treatment, imputation, scaling, and transform data.

2.1 Outliner treatment: – Z score

Outlier is a data point which lies far from all other data point in a data set. Outlier need to treat because it may bias the entire result. Outlier treatment with Z score is a common technique.  Z score is a standard score in statistics.  Z score provides information about data value is smaller or grater then mean that means how many standard deviations away from the mean value. Z score equation display below:

Z = \frac{(x - \mu)}{\sigma}

Here x = data point
σ = Standard deviation
μ = mean value

Equation- 1 Z-Score

In a normal distribution Z score represent 68% data lies on +/- 1, 95% data point lies on +/- 2, 99.7% data point lies on +/- 3 standard deviation.

2.2 Imputation data: – mean

Imputation is a way to handle missing data by replacing substituted value. There are many imputation technique represent like mean, median, mode, k-nearest neighbours. Mean imputation is the technique to replacing missing information with mean value. On the mean imputation first calculate the particular features mean value and then replace the missing value with mean value. The next equation displays the mean calculation:

\mu = \frac{(\sum x)}{n}

Here x = value of each point
n = number of values
μ = mean value

Equation- 2 Mean

2.3 Transform: – One hot encoding

Encoding is a pre-processing technique which represents data in such a way that computer can understand.  For understanding of machine learning algorithm categorical columns convert to numerical columns, this process called categorical encoding. There are multiple way to handle categorical variable but most widely used techniques are label encoding and one host encoding. On label encoding give a numeric (integer number) for each category. Suppose there are 3 categories of foods like apples, orange, banana. When label encoding is used then 3 categories will get a numerical value like apples = 1, banana = 2 and orange = 3. But there is very high probability that machine learning model can capture the relationship in between categories such as apple < banana < orange or calculate average across categories like 1 +3 = 4 / 2 = 2 that means model can understand average of apple and orange together is banana which is not acceptable because model correlation calculation is wrong. For solving this problem one hot encoding appear. The following table displays the label encoding is transformed into one hot encoding.

Label Encoding and One-Hot-Encoding

Table- 1 Encoding example

On hot encoding categorical value split into columns and each column contains 0 or 1 according to columns placement.

2.4 Scaling data: – Min Max Scaler

Feature scaling method is standardized or normalization the independent variable that means it is used to scale the data in a particular range like -1 to +1 or depending on algorithm. Generally normalization used where data distribution does not follow Gaussian distribution and standardization used where data distribution follow Gaussian distribution. On standardization techniques transform data values are cantered around the mean and unit is standard deviation. Formula for standardization given below:

Standardization X = \frac{(X - \mu)}{\sigma}

Equation-3 Equations for Standardization

X represent the feature value, µ represent mean of the feature value and σ represent standard deviation of the feature value. Standardized data value does not restrict to a particular range.

Normalization techniques shifted and rescaled data value range between 0 and 1. Normalization techniques also called Min-Max scaling. Formula for normalization given below:

Normalization X = \frac{(X - X_{min})}{X_{max} - X_{min}}

Equation – 4 Equations for Normalization

Above X, Xmin, Xmax are accordingly feature values, feature minimum value and feature maximum value. On above formula when X is minimums then numerator will be 0 (  is 0) or if X is maximums then the numerator is equal to the denominator (  is 1). But when X data value between minimum and maximum then  is between 0 and 1. If ranges value of data does not normalized then bigger range can influence the result.

3 Phase 2: – Balance Data

3.1 SMOTE

SMOTE (synthetic minority oversampling technique) is an oversampling technique where synthetic observations are created based on existing minority observations. This technique operates in feature space instead of data space. Under SMOTE each minority class observation calculates k nearest neighbours and randomly chose the neighbours depending on over-sampling requirements. Suppose there are 4 data point on minority class and 10 data point on majority class. For this imbalance data set, balance by increasing minority class with synthetic data point.   SMOTE creating synthetic data point but it is necessary to consider k nearest neighbours first. If k = 3 then SMOTE consider 3 nearest neighbours. Figure-2 display SMOTE with k = 3 and x = x1, x2, x3, x4 data point denote minority class. And all circles represent majority class.

SMOTE Example

Figure- 2 SMOTE example


4 Phase 3: – Feature Reduction

4.1 LDA

LDA stands for Linear Discriminant analysis supervised technique are commonly used for classification problem.  On this feature reduction account continuous independent variable and output categorical variable. It is multivariate analysis technique. LDA analyse by comparing mean of the variables.  Main goal of LDA is differentiate classes in low dimension space. LDA is similar to PCA (Principal component analysis) but in addition LDA maximize the separation between multiple classes. LDA is a dimensionality reduction technique where creating synthetic feature from linear combination of original data set then discard less important feature. LDA calculate class variance, it maximize between class variance and minimize within class variance. Table-2 display the process steps of LDA.

LDA Process

Table- 2 LDA process

5 Phase 5: – Base Model

Here we consider two base model ensemble random forest and MLP classifier.

5.1 Random Forest

Random forest is an ensemble (Bagging) method where group of weak learner (decision tree) come together to form a strong leaner. Random forest is a supervised algorithm which is used for regression and classification problem. Random forests create several decisions tree for predictions and provide solution by voting (classification) or mean (regression) value. Working process of Random forest given below (Table -3).

Random Forest

Table-3 Random Forest process

When training a Random forest root node contains a sample of bootstrap dataset and the feature is as same as original dataset. Suppose the dataset is D and contain d record and m number of columns. From the dataset D random forest first randomly select sample of rows (d) with replacement and sample of features (n) and give it to the decision tree. Suppose Random forest created several decision trees like T1, T2, T3, T4 . . . Tn. Then randomly selected dataset D = d + n is given to the decision tree T1, T2, T3, T4 . . . Tn where D < D, m > n and d > d.  After taking the dataset decision tree give the prediction for binary classification 1 or 0 then aggregating the decision and select the majority voted result. Figure-3 describes the structure of random forest process.

Random Forest Process

Figure- 3 Random Forest process

On Random forest base learner Decision Tree grows complete depth where bias (properly train on training dataset) is low and variance is high (when implementing test data give big error) called overfitting. On Random forest using multiple decision trees where each Decision tree is high variance but when combining all decision trees with the respect of majority vote then high variance converted into low variance because using row and feature sampling with replacement and taking the majority vote where decision is not depend on one decision tree.

CART (Classification and Regression Tree) is binary segmentation technique. CART is a Gini’s impurity index based classical algorithm to split a dataset and build a decision tree. By splitting a selected dataset CART created two child nodes repeatedly and builds a tree until the data no longer be split. There are three steps CART algorithm follow:

  1. Find best split for each features. For each feature in binary split make two groups of the ordered classes. That means possibility of split for k classes is k-1. Find which split is maximized and contain best splits (one for each feature) result.
  2. Find the best split for nodes. From step 1 find the best one split (from all features) which maximized the splitting criterion.
  3. Split the best node from step 2 and repeat from step 1 until fulfil the stopping criterion.


For splitting criteria CART use GINI index impurity algorithm to calculate the purity of split in a decision tree. Gini impurity randomly classified the labels with the same distribution in the dataset. A Gini impurity of 0 (lowest) is the best possible impurity and it is achieve when everything is in a same class. Gini index varies from 0 to 1. 0 indicate the purity of class where only one class exits or all element under a specific class. 1 indicates that elements are randomly distributed across various classes. And 0.5 indicate equal elements distributed over classes. Gini index (GI) described by mathematically that sum of squared of probabilities of each class (pi) deducted from one (Equation-5).

Gini Impurities

Equation – 5 Gini impurities

Here (Equation-5) pi represent the probability (probability of p+ or yes and probability of p- or no) of distinct class with classified element. Suppose randomly selected feature (a1) which has 8 yes and 4 no. After the split right had side (b1 on equation-6) has 4 yes and 4 no and left had side (b2 on equation – 7) has 4 yes and 0 no. here b2 is a pure split (leaf node) because only one class yes is present. By using the GI (Gini index) formula for b1 and b2:-

Equation- 6 & 7 – Gini Impurity b1 & Gini Impurity b2

Here for b1 value 0.5 indicates that equal element (yes and no) distribute over classes which is not pure split. And b2 value 0 indicates pure split. On GINI impurity indicates that when probability (yes or no) increases GINI value also increases. Here 0 indicate pure split and .5 indicate equal split that means worst situation. After calculating the GINI index for b1 and b2 now calculate the reduction of impurity for data point a1. Here total yes 8 (b1 and b2 on Equation – 8) and total no 4 (b1) so total data is 12 on a1. Below display the weighted GINI index for feature a1:

Total data point on b1 with Gini index (m) = 8/12 * 0.5 = 0.3333

Total data point on b2 with Gini index (n) = 4/12 * 0 = 0

Weighted Gini index for feature a1 = m + n = 0.3333

Equation- 8 Gini Impurity b1 & b2

After computing the weighted Gini value for every feature on a dataset taking the highest value feature as first node and split accordingly in a decision tree. Gini is less costly to compute.

5.2 Multilayer Perceptron Classifier (MLP Classifier)

Multilayer perceptron classifier is a feedforward neural network utilizes supervised learning technique (backpropagation) for training. MLP Classifier combines with multiple perceptron (hidden) layers. For feedforward taking input send combining with weight bias and then activation function from one hidden layer output goes to other hidden and this process continuing until reached the output. Then output calculates the error with error algorithm. These errors send back with backpropagation for weight adjustment by decreasing the total error and process is repeated, this process is call epoch. Number of epoch is determined with the hyper-parameter and reduction rate of total error.

5.2.1 Back-Propagation

Backpropagation is supervised learning algorithm that is used to train neural network. A neural network consists of input layer, hidden layer and output layer and each layer consists of neuron. So a neural network is a circuit of neurons. Backpropagation is a method to train multilayer neural network the updating of the weights of neural network and is done in such a way so that the error observed can be reduced here, error is only observed in the output layer and that error is back propagated to the previous layers and previous layer is proportionally updated weight. Backpropagation maintain chain rule to update weight. Mainly three steps on backpropagation are (Table-4):

Step Process
Step 1 Forward Pass
Step 2 Backward Pass
Step 3 Sum of all values and calculate updated weight value with Chain – rules.

Table-4 Back-Propagation process

5.2.2 Forward pass/ Forward propagation

Forward propagation is the process where input layer send the input value with randomly selected weight and bias to connected neuron and inside neuron selected activation function combine them and forward to other connected neuron layer after layer then give an output with the help of output layer. Below (Figure-4) display the forward propagation.

Foreward Pass

Figure-4 Forward passes

Input layer take the input of X (X1, X2) combine with randomly selected weight for each connection and with fixed bias (different hidden layer has different bias) send it to first hidden layer where first multiply the input with corresponding weight and added all input with single bias then selected activation function (may different form other layer) combine all input and give output according to function and this process is going on until reach in output layer. Output layer give the output like Y (Y1, Y2) (here output is binary classification as an example) according to selected activation function.

5.2.3 Backward Pass

After calculating error (difference between Forward pass output and actual output) backward pass try to minimize the error with optimisation function by sending backward with proportionally distribution and maintain a chain rule. Backward pass distribution the error in such a way where weighted value is taking under consideration. Below (Figure-5) diagram display the Backward pass process.

Backward Pass

Figure-5 Backward passes

Backpropagation push back the error which is calculated with error function or loss function for update proportional distribution with the help of optimisation algorithm. Division of Optimisation algorithm given below on Figure – 6

Optimisation Algorithms

Figure -6 Division of Optimisation algorithms

Gradient decent calculate gradient and update value by increases or decreases opposite direction of gradients unit and try to find the minimal value. Gradient decent update just one time for whole dataset but stochastic gradient decent update on each training sample and it is faster than normal gradient decent. Gradient decent can be improve by tuning parameter like learning rate (0 to 1 mostly use 0.5). Adagrad use time step based parameter to compute learning rate for every parameter. Adam is Adaptive Moment Estimation. It calculates different parameter with different learning rate. It is faster and performance rate is higher than other optimization algorithm. On the other way Adam algorithm is squares the calculated exponential weighted moving average of gradient.

5.2.4 Chain – rules

Backpropagation maintain chain-rules to update weighted value. On chain-rules backpropagation find the derivative of error respect to any weight. Suppose E is output error. w is weight for input a and bias b and ac neuron output respect of activation function and summation of bias with weighted input (w*a) input to neuron is net. So partial derivative for error respect to weight is ∂E / ∂w display the process on figure-7.

Figure- 7 Partial derivative for error respect to weight

On the chain rules for backward pass to find (error respect to weight) ∂E / ∂w = ∂E / ∂ac * ∂ac / ∂net * ∂net / ∂w. here find to error respect to weight are error respect to output of activation function multiply by activation function output respect to input in a neuron multiply by input in a neuron respect to weight.

5.2.5 Activation function

Activation function is a function which takes the decision about neuron to activate or deactivate. If the activate function activate the neuron then it will give an output on the basis of input. Input in a activation function is sum of input multiply with corresponding weight and adding the layered bias.  The main function of a activate function is non-linearity output of a neuron.

Activation Function

Figure-8 Activation function

Figure – 8 display a neuron in a hidden layer. Here several input (1, 2, 3) with corresponding weight (w1, w2, w3) putting in a neuron input layer where layer bias add with summation of multiplication with input and weight. Equation-9 display the output of an activate function.

Output from activate function y = Activate function (Ʃ (weight * input) + bias)

y = f (Ʃ (w*x) +b)

Equation- 9 Activate function

There are many activation functions like linear function for regression problem, sigmoid function for binary classification problem where result either 0 or 1, Tanh function which is based on sigmoid function but mathematically shifted version and values line -1 to 1. RELU function is Rectified linear unit. RELU is less expensive to compute.

5.2.6 Sigmoid

Sigmoid is a squashing activate function where output range between 0 and 1. Sigmoidal name comes from Greek letter sigma which looks like letter S when graphed. Sigmoid function is a logistic type function, it mainly use in output layer in neural network. Sigmoid is non-linear, fixed output range (between 0 and 1), monotonic (never decrees or never increases) and continuously differentiated function. Sigmoid function is good at classification and output from sigmoid is nonlinear. But Sigmoid has a vanishing gradient problem because output variable is very less to change in input variable. Figure- 9 displays the output of a Sigmoid and derivative of Sigmoid. Here x is any number (positive or negative). On sigmoid function 1 is divided by exponential negative input with adding 1.

Sigmoid

Figure – 9 Sigmoid Functions

4.5.2.7 RELU

RELU stands for Rectified Linear Units it is simple, less expensive in computation and rectifies the gradient vanishing problem. RELU is nonlinear activation function. It gives output either positive (infinity) or 0. RELU has a dying problem because if neurons stop for responding to variation because of gradient is 0 or nothing has to change. Figure- 10 displays the output of an RELU and derivative of RELU. Here x is any positive input and if x is grater then 0 give the output as x or give output 0. RELU function gives the output maximum value of input, here max (0, x).

Relu Activation Function

Figure – 10 RELU Function

4.5.2.8 Cost / loss function (Binary Cross-Entropy)

Cost or loss function compare the predictive value (model outcome) with actual value and give a quantitative value which give the indication about how much good or bad the prediction is.

Cost Function

Figure- 11 Cost function work process

Figure-11 x1 and x2 are input in a activate function f(x) and output y1_out which is sum of weighted input added with bias going through activate function. After model output activate function compare the output with actual output and give a quantitative value which indicate how good or bad the prediction is.

There are many type of loss function but choosing of optimal loss function depends on the problem going to be solved such as regression or classification. For binary classification problem binary cross entropy is used to calculate cost. Equation-10 displays the binary cross entropy where y is actual binary value and yp predictive outcome range 0 and 1. And i is scalar vale range between 1 to model output size (N).

Binary Crossentropy

Equation-10 displays the binary cross entropy

6 Phase 6: – Evaluation

6.1 Confusion matrix

In a classification confusion matrix describe the performance of actual value against predictive value. Confusion Matrix does the performance measurement. So confusion matrix classifies and display predicted and actual value (Visa, S., Ramsay 2011).

Confusion Matrix

Table- 5 Confusion Matrix

Confusion Matrix (Table-5) combines with True Positive (TP), True Negative (TN), False Positive (FP), and False Negative (FN). True Positive is prediction positive and true. True Negative is prediction negative and that is true. False positive is prediction positive and it’s false. False negative is prediction negative and that is false. False positive is known as Type1 error and false negative is known as Type 2 error. Confusion matrix can able to calculate several list of rates which are given below on Table- 6.

Here    N = Total number of observation, TP = True Positive, TN = True Negative

FP = False Positive, FN = False Negative, Total Actual No (AN) = TN + FP,

Total Predictive Yes (PY) = FP + TP. Total Actual Yes (AY) = FN + TP

Rate


Description Mathematical Description
Accuracy Classifier, overall how often correctly identified  (TP+TN) / N
Misclassification Rate Classifier, overall how often wrongly identified (FP + FN) / N
True Positive Rate

(Sensitivity / Recall)

Classifier, how often predict correctly yes when it is actually yes.  TP / AY
False Positive Rate Classifier, how often predict wrongly yes when it is actually no.  FP / AN
True Negative Rate

(Specificity)

Classifier, how often predict correctly no when it is actually no.  TN / AN
Precision Classifier how often predict yes when it is correct.  TP / PY
Prevalence Yes conditions how often occur in a sample. AY / N

Table – 6 Confusion matrixes Calculation

From confusion matrix F1 score can be calculated because F1 score related to precision and recall. Higher F1 score is better. If precision or recall any one goes down F1 score also go down.

F1 = \frac{2 * Precision * Recall}{Precision + Recall}

4.6.2 ROC (Receiver Operating Characteristic) curve

In statistics ROC is represent in a graph with plotting a curve which describe a binary classifiers performance as its differentiation threshold is varied. ROC (Equation-11) curve created true positive rate (TPR) against false positive rate (FPR). True positive rate also called as Sensitivity and False positive rate also known as Probability of false alarm. False positive rate also called as a probability of false alarm and it is calculated as 1 – Specificity.

True Positive Rate = \frac{True Positive}{True Positive + False Negative} = Recall or Sensivity

False Positive Rate = \frac{True Negative}{True Negative + False Positive} = 1 - Specificity

Equation- 11 ROC

So ROC (Receiver Operation Characteristic) curve allows visual representation between sensitivity and specificity associated with different values of the test result (Grzybowski, M. and Younger, J.G., 1997)

On ROC curve each point has different Threshold level. Below (Figure – 12) display the ROC curve. Higher the area curve covers is better that means high sensitivity and high specificity represent more accuracy. ROC curve also represent that if classifier predict more often true than it has more true positive and also more false positive. If classifier predict true less often then fewer false positive and also fewer true positive.

ROC Curve

ROC Curve

Figure – 12 ROC curve description

4.6.3 AUC (Area under Curve)

Area under curve (AUC) is the area surrounded by the ROC curve and AUC also represent the degree of separability that means how good the model to distinguished between classes. Higher the AUC value represents better the model performance to separate classes. AUC = 1 for perfect classifier, AUC = 0 represent worst classifier, and AUC = 0.5 means has no class separation capacity. Suppose AUC value is 0.6 that means 60% chance that model can classify positive and negative class.

Figure- 13 to Figure – 16 displays an example of AUC where green distribution curve for positive class and blue distribution curve for negative class. Here threshold or cut-off value is 0.5 and range between ‘0’ to ‘1’. True negative = TN, True Positive = TP, False Negative = FN, False Positive = FP, True positive rate = TPR (range 0 to 1), False positive rate = FPR (range 0 to 1).

On Figure – 13 left distribution curve where two class curves does not overlap that means both class are perfectly distinguished. So this is ideal position and AUC value is 1.  On the left side ROC also display that TPR for positive class is 100% occupied.

ROC distributions (perfectly distinguished

ROC distributions (perfectly distinguished

Figure – 14 two class overlap each other and raise false positive (Type 1), false negative (Type 2) errors. Here error could be minimize or maximize according to threshold. Suppose here AUC = 0.6, that means chance of a model to distinguish two classes is 60%. On ROC curve also display the curve occupied for positive class is 60%.

ROC distributions (class partly overlap distinguished)

ROC distributions (class partly overlap distinguished)

Figure- 15 displayed that positive and negative overlap each other. Here AUC value is 0.5 or near to 0.5. On this position classifier model does not able distinguish positive and negative classes. On left side ROC curve become straight that means TPR and FPR are equal.

ROC distributions (class fully overlap distinguished)

ROC distributions (class fully overlap distinguished)

Figure- 16 positive and negative class swap position and on this position AUC = 0. That means classified model predict positive as a negative and negative as a positive. On the left ROC curve display that curve on FPR side fully fitted.

ROC distributions (class swap position distinguished)

ROC distributions (class swap position distinguished)

7 Summaries

This paper describes a data mining process flow and related model and its algorithm with textual representation. One hot encoding create dummy variable for class features and min-max scaling scale the data in a single format. Balancing by SMOTE data where Euclidian distance calculates the distance in-between nearest neighbour to produce synthetic data under minority class. LDA reduce the distance inside class and maximise distance in-between class and for two class problem give a single dimension features which is less costly to calculate accuracy by base algorithm (random forest and MLP classifier).  Confusion matrix gives the accuracy, precision, sensitivity, specificity which is help to take a decision about base algorithm. AUC and ROC curve also represent true positive rate against false positive rate which indicate base algorithm performance.

Base algorithm Random forest using CART with GINI impurity for feature selection to spread the tree. Here CART is selected because of less costly to run. Random forest algorithm is using bootstrap dataset to grow trees, and aggregation using majority vote to select accuracy.

MLP classifier is a neural network algorithm using backpropagation chain-rule to reducing error. Here inside layers using RLU activation function. Output layers using Sigmoid activation function and binary cross entropy loss function calculate the loss which is back propagate with Adam optimizer to optimize weight and reduce loss.

References:

  1. Visa, S., Ramsay, B., Ralescu, A.L. and Van Der Knaap, E., 2011. Confusion Matrix-based Feature Selection. MAICS, 710, pp.120-127.
  2. Grzybowski, M. and Younger, J.G., 1997. Statistical methodology: III. Receiver operating characteristic (ROC) curves. Academic Emergency Medicine, 4(8), pp.818-826.

Bias and Variance in Machine Learning

Machine learning continues to be an ever more vital component of our lives and ecosystem, whether we’re applying the techniques to answer research or business problems or in some cases even predicting the future. Machine learning models need to give accurate predictions in order to create real value for a given industry or domain.

While training a model is one of the key steps in the Data Science Project Life Cycle, how the model generalizes on unseen data is an equally important aspect that should be considered in every Data Science Project Life Cycle. We need to know whether it works and, consequently, if we can trust its predictions. Could the model be merely memorizing the data it is fed with, and therefore unable to make good predictions on future samples, or samples that it hasn’t seen before?

Let’s know the importance of evaluation with a simple example, There are two student’s Ramesh and Suresh preparing for the CAT exam to get into top IIMs (Indian Institute of Management). They both are quite good friends and stayed in the room during preparation and put an equal amount of hard work while solving numerical problems.

They both prepared for almost the same number of hours for the entire year and appeared in the final CAT exam. Surprisingly, Ramesh cleared, but Suresh did not. When asked, we got to know that there was one difference in their strategy of preparation between them, Ramesh had joined a Test Series course where he used to test his knowledge and understanding by giving mock exams and then further evaluating on which portions he is lagging and making necessary adjustments to he is preparation cycle in order to do well in those areas. But Suresh was confident, and he just kept training himself without testing on the preparation he had done.

Like the above situation we can train a Machine Learning Algorithm extensively with many parameters and new techniques, but if you are skipping its evaluation step, you cannot trust your model to perform well on the unseen data. In this article, we explain the importance of Bias, Variance and the trade-off between them in order to know how well a machine learning model generalizes to new, previously unseen data.

Training of Supervised Machine Learning

Bias

Bias is the difference between the Predicted Value and the Expected Value or how far are the predicted values from the actual values. During the training process the model makes certain assumptions on the training data provided. After Training, when it is introduced to the testing/validation data or unseen data, these assumptions may not always be correct.

If we use a large number of nearest neighbors in the K-Nearest Neighbors Algorithm, the model can totally decide that some parameters are not important at all for the modelling.  For example, it can just consider that only two predictor variables are enough to classify the data point though we have more than 10 variables.

This type of model will make very strong assumptions about the other parameters not affecting the outcome at all. You can take it as a model predicting or understanding only the simple relationship when the data points clearly indicate a more complex relationship.

When the model has high bias error, it results in a very simplistic model that does not consider the complexity of the data very well leading to Underfitting.

Variance

Variance occurs when the model performs well on the trained dataset but does not do well on an unseen data set, it is when the model considers the fluctuations or i.e. the noise as in the data as well. The model will still consider the variance as something to learn from because it learns too much from the noise inside the trained data set that it fails to perform as expected on the unseen data.

Based on the above example from Bias, if the model learns that all the ten predictor variables are important to classify a given data point then it tends to have high variance. You can take it as the model is trying to understand every minute detail making it more complex and failing to perform well on the unseen data.

When a model has High Bias error, it underfits the data and makes very simplistic assumptions on it. When a model has High Variance error, it overfits the data and learns too much from it. When a model has balanced Bias and Variance errors, it performs well on the unseen data.

Bias-Variance Trade-off

Based on the definitions of bias and variance, there is clear trade-off between bias and variance when it comes to the performance of the model. A model will have a high error if it has very high bias and low variance and have a high error if it has high variance and low bias.

A model that strikes a balance between the bias and variance can minimize the error better than those that live on extreme ends.

We can find whether the model has High Bias using the below steps:

  1. We tend to get high training errors.
  2. The validation error or test error will be similar to the training error.

We can find whether the model has High Bias using the below steps:

  1. We tend to get low training error
  2. The validation error or test error will be very high.

We can fix the High Bias using below steps:

  1. We need to gather more input features or can even try to create few using the feature engineering techniques.
  2. We can even add few polynomial features in order to increase the complexity.
  3. If we are using any regularization terms in our model, we can try to minimize it.

We can fix the High Variance using below steps:

  1. We can gather more training data so that the model can learn more on the patterns rather than the noise.
  2. We can even try to reduce the input features or do feature selection.
  3.  If we are using any regularization terms in our model we can try to maximize it.

Conclusion

In this article, we got to know the importance of the evaluation step in the Data Science Project Life Cycle, definitions of Bias and Variance, the trade-off between them and the steps we can take to fix the Underfitting and Overfitting of a Machine Learning Model.

Rethinking linear algebra: visualizing linear transformations and eigen vectors

In terms of calculation processes of Principal Component Analysis (PCA) or Linear Discriminant Analysis (LDA), which are the dimension reduction techniques I am going to explain in the following articles, diagonalization is what they are all about. Throughout this article, I would like you to have richer insight into diagonalization in order to prepare for understanding those basic dimension reduction techniques.

When our professor started a lecture on the last chapter of our textbook on linear algebra, he said “It is no exaggeration to say that everything we have studied is for this ‘diagonalization.'” Until then we had to write tons of numerical matrices and vectors all over our notebooks, calculating those products, adding their rows or columns to other rows or columns, sometimes transposing the matrices, calculating their determinants.

It was like the scene in “The Karate Kid,” where the protagonist finally understood the profound meaning behind the prolonged and boring “wax on, wax off” training given by Miyagi (or “jacket on, jacket off” training given by Jackie Chan). We had finally understood why we had been doing those seemingly endless calculations.

Source: http://thinkbedoleadership.com/secret-success-wax-wax-off/

But usually you can do those calculations easily with functions in the Numpy library. Unlike Japanese college freshmen, I bet you are too busy to reopen textbooks on linear algebra to refresh your mathematics. Thus I am going to provide less mathematical and more intuitive explanation of diagonalization in this article.

1, The mainstream ways of explaining diagonalization.

*The statements below are very rough for mathematical topics, but I am going to give priority to offering more visual understanding on linear algebra in this article. For further understanding, please refer to textbooks on linear algebra. If you would like to have minimum understandings on linear algebra needed for machine learning, I recommend the Appendix C of Pattern Recognition and Machine Learning by C. M. Bishop.

In most textbooks on linear algebra, the explanations on dioagonalization is like this (if you are not sure what diagonalization is or if you are allergic to mathematics, you do not have to read this seriously):

Let V (dimV = D)be a vector space and let  T_A : V \rightarrow V be a mapping of V into itself,  defined as T_A(v) = A \cdot \boldsymbol{v}, where A is a D\times D matrix and \boldsymbol{v} is D dimensional vector. An element \boldsymbol{v} \in V is called an eigen vector if there exists a number \lambda such that A \cdot \boldsymbol{v}= \lambda \cdot \boldsymbol{v} and \boldsymbol{v} \neq \boldsymbol{0}. In this case \lambda is uniquely determined and is called an eigen value of A belonging to the eigen vector \boldsymbol{v}.

Any matrix A has D eigen values \lambda_{i}, belonging to \boldsymbol{v}_{i} (i=1, 2, …., D). If \boldsymbol{v}_{i} is basis of the vector space V, then A is diagonalizable.

When A is diagonalizable, with D \times D matrices P = (\boldsymbol{v}_{1}, \dots, \boldsymbol{v}_{D}) , whose column vectors are eigen vectors \boldsymbol{v}_{i} (i=1, 2, …., D), the following equation holds: P^{-1}AP = \Lambda, where \Lambda = diag(\lambda_{1}, \dots, \lambda_{D})= \begin{pmatrix} \lambda_{1} & 0& \ldots &0\\ 0 & \lambda_{2} & \ldots & 0 \\ \vdots & \vdots & \ddots & \vdots \\ 0 & 0 & \ldots & \lambda_{D} \end{pmatrix}.

And when A is diagonalizable, you can diagonalize A as below.

Most textbooks keep explaining these type of stuff, but I have to say they lack efforts to make it understandable to readers with low mathematical literacy like me. Especially if you have to apply the idea to data science field, I believe you need more visual understanding of diagonalization. Therefore instead of just explaining the definitions and theorems, I would like to take a different approach. But in order to understand them in more intuitive ways, we first have to rethink waht linear transformation T_A means in more visible ways.

2, Linear transformations

Even though I did my best to make this article understandable to as little prerequisite knowledge, you at least have to understand linear transformation of numerical vectors and with matrices. Linear transformation is nothing difficult, and in this article I am going to use only 2 or 3 dimensional numerical vectors or square matrices. You can calculate linear transformation of \boldsymbol{v} by A as equations in the figure. In other words, \boldsymbol{u} is a vector transformed by A.

*I am not going to use the term “linear transformation” in a precise way in the context of linear algebra. In this article or in the context of data science or machine learning, “linear transformation” for the most part means products of matrices or vectors. 

*Forward/back propagation of deep learning is mainly composed of this linear transformation. You keep linearly transforming input vectors, frequently transforming them with activation functions, which are for the most part not linear transformation.

As you can see in the equations above, linear transformation with A transforms a vector to another vector. Assume that you have an original vector \boldsymbol{v} in grey and that the vector \boldsymbol{u} in pink is the transformed \boldsymbol{v} by A is. If you subtract \boldsymbol{v} from \boldsymbol{u}, you can get a displacement vector, which I displayed in purple. A displacement vector means the transition from a vector to another vector.

Let’s calculate the displacement vector with more vectors \boldsymbol{v}. Assume that A =\begin{pmatrix} 3 & 1 \\ 1 & 2 \end{pmatrix}, and I prepared several grid vectors \boldsymbol{v} in grey as you can see in the figure below. If you transform those grey grid points with A, they are mapped into the vectors \boldsymbol{u} in pink. With those vectors in grey or pink, you can calculate the their displacement vectors \boldsymbol{u} = \boldsymbol{v} in purple.

I think you noticed that the displacement vectors in the figure above have some tendencies. In order to see that more clearly, let’s calculate displacement vectors with several matrices A and more grid points. Assume that you have three 2 \times 2 square matrices A_1 =\begin{pmatrix} 3 & 1 \\ 1 & 2 \end{pmatrix}, A_2 =\begin{pmatrix} 3 & 1 \\ -1 & 1 \end{pmatrix}, A_3 =\begin{pmatrix} 1 & -1 \\ 1 & 1 \end{pmatrix}, and I plotted displace vectors made by the matrices respectively in the figure below.

I think you noticed some characteristics of the displacement vectors made by those linear transformations: the vectors are swirling and many of them seem to be oriented in certain directions. To be exact, some displacement vectors have extend in the same directions as some of original vectors in grey. That means  linear transformation by A did not change the direction of the original vector \boldsymbol{v}, and the unchanged vectors are called eigen vectors. Real eigen vectors of each A are displayed as arrows in yellow in the figure above. But when it comes to A_3, the matrix does not have any real eigan values.

In linear algebra, depending on the type matrices A, you have consider various cases such as whether the matrices have real or imaginary eigen values, whether the matrices are diagonalizable, whether the eigen vectors are orthogonal, or whether they are unit vectors. But those topics are out of the scope of this article series, so please refer to textbooks on linear algebra if you are interested.

Luckily, however, in terms of PCA or LDA, you only have to consider a type of matrices named positive semidefinite matrices, which A_1 is classified to, and I am going to explain positive semidefinite matrices in the fourth section.

3, Eigen vectors as coordinate system

Source: Ian Stewart, “Professor Stewart’s Cabinet of Mathematical Curiosities,” (2008), Basic Books

Let me take Fibonacci numbers as an example to briefly see why diagonalization is useful. Fibonacci is sequence is quite simple and it is often explained using an example of pairs of rabbits increasing generation by generation. Let a_n (n=0, 1, 2, …) be the number of pairs of grown up rabbits in the n^{th} generation. One pair of grown up rabbits produce one pair of young rabbit The concrete values of a_n are a_0 = 0, a_1 = 1, a_2=1, a_3=2, a_4=3, a_5=5, a_6=8, a_7=13, \dots. Assume that A =\begin{pmatrix} 1 & 1 \\ 1 & 0 \end{pmatrix} and that \begin{pmatrix} a_1 \\ a_0  \end{pmatrix} =\begin{pmatrix} 1 \\ 0  \end{pmatrix}, then you can calculate the number of the pairs of grown up rabbits in the next generation with the following recurrence relation. \begin{pmatrix} a_{n+1} \\ a_{n}  \end{pmatrix}=\begin{pmatrix} 1 & 1 \\ 1 & 0 \end{pmatrix} \cdot \begin{pmatrix} a_{n+1} \\ a_{n}  \end{pmatrix}.Let \boldsymbol{a}_n be \begin{pmatrix} a_{n+1} \\ a_{n}  \end{pmatrix}, then the recurrence relation can be written as \boldsymbol{a}_{n+1} = A \boldsymbol{a}_n, and the transition of \boldsymbol{a}_n are like purple arrows in the figure below. It seems that the changes of the purple arrows are irregular if you look at the plots in normal coordinate.

Assume that \lambda _1, \lambda_2 (\lambda _1< \lambda_2) are eigen values of A, and \boldsymbol{v}_1, \boldsymbol{v}_2 are eigen vectors belonging to them respectively. Also let \alpha, \beta scalars such that \begin{pmatrix} a_{1} \\ a_{0}  \end{pmatrix} = \begin{pmatrix} 1 \\ 0  \end{pmatrix} = \alpha \boldsymbol{v}_1 + \beta \boldsymbol{v}_2. According to the definition of eigen values and eigen vectors belonging to them, the following two equations hold: A\boldsymbol{v}_1 = \lambda_1 \boldsymbol{v}_1, A\boldsymbol{v}_2 = \lambda_2 \boldsymbol{v}_2. If you calculate \boldsymbol{a}_1 is, using eigen vectors of A, \boldsymbol{a}_1  = A\boldsymbol{a}_0 = A (\alpha \boldsymbol{v}_1 + \beta \boldsymbol{v}_2) = \alpha\lambda _1 \boldsymbol{v}_1 + \beta \lambda_2 \boldsymbol{v}_2. In the same way, \boldsymbol{a}_2 = A\boldsymbol{a}_1 = A (\alpha\lambda _1 \boldsymbol{v}_1 + \beta \lambda_2 \boldsymbol{v}_2) = \alpha\lambda _{1}^{2} \boldsymbol{v}_1 + \beta \lambda_{2}^{2} \boldsymbol{v}_2, and \boldsymbol{a}_3 = A\boldsymbol{a}_2 = A (\alpha\lambda _{1}^{2} \boldsymbol{v}_1 + \beta \lambda_{2}^{2} \boldsymbol{v}_2) = \alpha\lambda _{1}^{3} \boldsymbol{v}_1 + \beta \lambda_{2}^{3} \boldsymbol{v}_2. These equations show that in coordinate system made by eigen vectors of A, linear transformation by A is easily done by just multiplying eigen values with each eigen vector. Compared to the graph of Fibonacci numbers above, in the figure below you can see that in coordinate system made by eigen vectors the plots changes more systematically generation by generation.


In coordinate system made by eigen vectors of square matrices, the linear transformations by the matrices can be much more straightforward, and this is one powerful strength of eigen vectors.

*I do not major in mathematics, so I am not 100% sure, but vectors in linear algebra have more abstract meanings and various things in mathematics can be vectors, even though in machine learning or data science we  mainly use numerical vectors with more concrete elements. We can also say that matrices are a kind of maps. That is just like, at leas in my impression, even though a real town is composed of various components such as houses, smooth or bumpy roads, you can simplify its structure with simple orthogonal lines, like the map of Manhattan. But if you know what the town actually looks like, you do not have to follow the zigzag path on the map.

4, Eigen vectors of positive semidefinite matrices

In the second section of this article I told you that, even though you have to consider various elements when you discuss general diagonalization, in terms of PCA and LDA we mainly use only a type of matrices named positive semidefinite matrices. Let A be a D \times D square matrix. If \boldsymbol{x}^T A \boldsymbol{x} \geq 0 for all values of the vector \boldsymbol{x}, the A is said to be a positive semidefinite matrix. And also it is known that A being a semidefinite matrix is equivalent to \lambda _{i} \geq 0 for all the eigen values \lambda_i (i=1, \dots , D).

*I think most people first learn a type of matrices called positive definite matrices. Let A be aD \times D square matrix. If \boldsymbol{x}^T A \boldsymbol{x} > 0 for all values of the vector \boldsymbol{x}, the A is said to be a positive definite matrix. You have to keep it in mind that even if all the elements of A are positive, A is not necessarly positive definite/semidefinite.

Just as we did in the second section of this article, let’s visualize displacement vectors made by linear transformation with a 3 \times 3 square positive semidefinite matrix A.

*In fact A_1 =\begin{pmatrix} 3 & 1 \\ 1 & 2 \end{pmatrix}, whose linear transformation I visualized the second section, is also positive semidefinite.

Let’s visualize linear transformations by a positive definite matrix A = \frac{1}{50} \begin{pmatrix} 60.45 &  33.63 & 46.29 \\33.63 & 68.49 & 50.93 \\ 46.29 & 50.93 & 53.61 \end{pmatrix}. I visualized the displacement vectors made by the A just as the same way as in the second section of this article. The result is as below, and you can see that, as well as the displacement vectors made by A_1, the three dimensional displacement vectors below are swirling and extending in three directions, in the directions of the three orthogonal eigen vectors \boldsymbol{v}_1, \boldsymbol{v}_2, and \boldsymbol{v}_3.

*It might seem like a weird choice of a matrix, but you are going to see why in the next article.

You might have already noticed A_1 =\begin{pmatrix} 3 & 1 \\ 1 & 2 \end{pmatrix} and A = \frac{1}{50} \begin{pmatrix} 60.45 &  33.63 & 46.29 \\33.63 & 68.49 & 50.93 \\ 46.29 & 50.93 & 53.61 \end{pmatrix} are both symmetric matrices and that their elements are all real values, and that their diagonal elements are all positive values. Super importantly, when all the elements of a D \times D symmetric matrix A are real values and its eigen values are \lambda_{i} (i=1, \dots , D), there exist orthonormal matrices U such that U^{-1}AU = \Lambda, where \Lambda = diag(\lambda_{1}, \dots , \lambda_{D}).

*The title of this section might be misleading, but please keep it in mind that positive definite/semidefinite matrices are not necessarily real symmetric matrices. And real symmetric vectors are not necessarily positive definite/semidefinite matrices.

5, Orthonormal matrices and rotation of vectors

In this section I am gong to explain orthonormal matrices, as known as rotation matrices. If a D\times D matrix U is an orthonormal matrix, column vectors of U are orthonormal, which means U = (\boldsymbol{u}_1 \dots \boldsymbol{u}_D), where \begin{cases} \boldsymbol{u}_{i}^{T}\boldsymbol{u}_{j} = 1 \quad (i = j) \\ \boldsymbol{u}_{i}^{T}\boldsymbol{u}_{j} = 0 \quad (i\neq j) \end{cases}. In other words column vectors \boldsymbol{u}_{i} form an orthonormal coordinate system.

Orthonormal matrices U have several important matrices, and one of them is U^{-1} = U^{T}. Combining this fact with what I have told you so far, you we can reach one conclusion that you can orthogonalize a real symmetric matrix A as U^{T}AU = \Lambda. This is known as spectral decomposition or singular value decomposition.

Another important property of U is that U^{T} is also orthonormal. In other words, assume U is orthonormal and that U = (\boldsymbol{u}_1 \dots \boldsymbol{u}_D) = \begin{pmatrix} -\boldsymbol{v_1}^{T}- \\ \vdots \\ -\boldsymbol{v_D}^{T}- \end{pmatrix}, (\boldsymbol{v}_1 \dots \boldsymbol{v}_D) also forms a orthonormal coordinate system.

…It seems things are getting too mathematical and abstract (for me), thus for now I am going to wrap up what I have explained in this article .

We have seen

  • Numerical matrices linearly transform vectors.
  • Certain linear transformations do not change the direction of vectors in certain directions, which are called eigen vectors.
  • Making use of eigen vectors, you can form new coordinate system which can describe the linear transformations in a more straightforward way.
  • You can diagonalize a real symmetric matrix A with an orthonormal matrix U.

Of our current interest is what kind of linear transformation the real symmetric positive definite matrix enables. I am going to explain why the purple vectors in the figure above is swirling like that in the upcoming articles. Before that, however, we are going to  see one application of what we have seen in this article, on dimension reduction. To be concrete the next article is going to be about principal component analysis (PCA), which is very important in many fields.

*In short, the orthonormal matrix U I mentioned above enables rotation of matrix, and the diagonal matrix diag(\lambda_1, \dots, \lambda_D) expands or contracts vectors along each axis. I am going to explain that more precisely in the upcoming articles.

* I make study materials on machine learning, sponsored by DATANOMIQ. I do my best to make my content as straightforward but as precise as possible. I include all of my reference sources. If you notice any mistakes in my materials, including grammatical errors, please let me know (email: yasuto.tamura@datanomiq.de). And if you have any advice for making my materials more understandable to learners, I would appreciate hearing it.
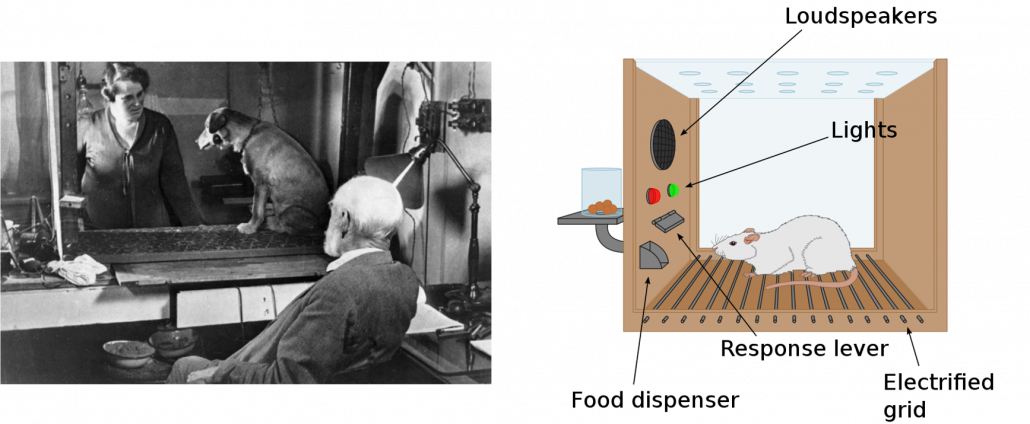
*I attatched the codes I used to make the figures in this article. You can just copy, paste, and run, sometimes installing necessary libraries.

import matplotlib.pyplot as plt 
import numpy as np
import matplotlib.patches as mpatches

T_A = np.array([[1, 1], 
                [1, 0]])

total_step = 5
x = np.zeros((total_step, 2))

x[0]  = np.array([1, 0])

for i in range(total_step - 1):
    x[i + 1] = np.dot(T_A, x[i])

eigen_values, eigen_vectors = np.linalg.eig(T_A)
idx = eigen_values.argsort()[::-1]   
eigen_values = eigen_values[idx]
eigen_vectors = eigen_vectors[:,idx]
for i in range(len(eigen_vectors)):
    if(eigen_vectors.T[i][0] < 0):
        eigen_vectors.T[i] = - eigen_vectors.T[i]   

v_initial = x[0]
v_coefficients = np.zeros((total_step , 2))
v_coefficients[0] = np.dot(v_initial ,  np.linalg.inv(eigen_vectors.T)) 

for i in range(total_step-1):
    v_coefficients[i + 1] = v_coefficients[i] * eigen_values 

for i in range(total_step):
    v_1_list[i+1] = v_coefficients.T[0][i]*eigen_vectors.T[0]
    v_2_list[i+1] = v_coefficients.T[1][i]*eigen_vectors.T[1]

plt.figure(figsize=(20, 15))
fontsize = 20
small_shift = 0.2

plt.plot(x[:, 0], x[:, 1], marker='o', linestyle='none', markersize=10, color='black')

plt.arrow(0, 0, eigen_vectors.T[0][0], eigen_vectors.T[0][1], width=0.05, head_width=0.2, color='orange')
plt.arrow(0, 0, eigen_vectors.T[1][0], eigen_vectors.T[1][1], width=0.05, head_width=0.2, color='orange')

plt.text(eigen_vectors.T[0][0], eigen_vectors.T[0][1]+small_shift, r'v_{1}', va='center',ha='right', fontsize=fontsize + 10)
plt.text(eigen_vectors.T[1][0] - small_shift, eigen_vectors.T[1][1],r'v_{2}', va='center',ha='right', fontsize=fontsize + 10)

for i in range(total_step): 
    
    plt.arrow(0, 0, v_1_list[i+1][0], v_1_list[i+1][1], head_width=0.05, color='darkviolet', length_includes_head=True)
    plt.arrow(0, 0, v_2_list[i+1][0], v_2_list[i+1][1], head_width=0.05, color='darkviolet', length_includes_head=True)
    
    plt.text(v_1_list[i+1][0] + 2*small_shift , v_1_list[i+1][1]-2*small_shift,r'\alpha \cdot \lambda_{0} ^{1} \cdot v_{2}'.format(1,i+1, 1),va='center',ha='right', fontsize=fontsize)
    plt.text(v_2_list[i+1][0]-0.1, v_2_list[i+1][1],r'\beta \cdot \lambda_{0} ^{1} \cdot v_{2}'.format(2, i+1, 2),va='center',ha='right', fontsize=fontsize)

    plt.arrow(v_1_list[i+1][0], v_1_list[i+1][1], v_2_list[i+1][0], v_2_list[i+1][1], head_width=0, color='black', linestyle='--', length_includes_head=True)
    plt.arrow(v_2_list[i+1][0], v_2_list[i+1][1], v_1_list[i+1][0], v_1_list[i+1][1], head_width=0, color='black', linestyle='--', length_includes_head=True)
    
orange_patch = mpatches.Patch(color='orange', label='Eigen vectors')
purple_patch = mpatches.Patch(color='darkviolet', label='Scalar multiples of the eigen vectors')
plt.legend(handles=[orange_patch, purple_patch], fontsize=25, loc='lower right')

for i in range(total_step):
    plt.text(x[i][0]+0.1, x[i][1]-0.05, r'n={0}'.format(i), fontsize=20)

plt.grid(True)
plt.ylabel("a_{n}: n^{th} generation", fontsize=20)
plt.xlabel("a_{n+1}: n+1 ^{th} geneartion", fontsize=20)
plt.title("Fibonacci sequence and its eigen space", fontsize=30)
#plt.savefig("Fibonacci_eigen_space.png")
plt.show()
import matplotlib.pyplot as plt 
import numpy as np 
import matplotlib.patches as mpatches

const_range = 10

X = np.arange(-const_range, const_range + 1, 1)
Y = np.arange(-const_range, const_range + 1, 1)
U_x, U_y = np.meshgrid(X, Y)

T_A_0 = np.array([[3, 1], 
                [1, 2]])

T_A_1 = np.array([[3, 1],
                [-1, 1]])

T_A_2 = np.array([[1, -1], 
                [1, 1]])

T_A_list = np.array((T_A_0, T_A_1, T_A_2))

const_range = 5
plt.figure(figsize=(30, 10))
plt.subplots_adjust(wspace=0.1)
labels = ["Grids", "Displacement vectors made by A", "Real eigen vectors of A"]  
title_list = [r"A_1 has two different real eigen vectors.", r"A_2 has two identical real unit eigen vectors.",  r"A_3 has only imaginary eigen vectors."]
for idx in range(len(T_A_list)): 
    
    eigen_values, eigen_vectors = np.linalg.eig(T_A_list[idx])
    sorted_idx = eigen_values.argsort()[::-1]   
    eigen_values = eigen_values[sorted_idx]
    eigen_vectors = eigen_vectors[:,sorted_idx]
    eigen_vectors = eigen_vectors.astype(float)
        
    for i in range(len(eigen_vectors)):
        if(eigen_vectors.T[i][0] < 0):
            eigen_vectors.T[i] = - eigen_vectors.T[i]
        

    X = np.arange(-const_range, const_range + 1, 1)
    Y = np.arange(-const_range, const_range + 1, 1)
    U_x, U_y = np.meshgrid(X, Y)

    V_x = np.zeros((len(U_x), len(U_y)))
    V_y = np.zeros((len(U_x), len(U_y)))

    temp_vec = np.zeros((1, 2))

    W_x = np.zeros((len(U_x), len(U_y)))
    W_y = np.zeros((len(U_x), len(U_y)))

    plt.subplot(1, 3, idx + 1)


    for i in range(len(U_x)):
        for j in range(len(U_y)):
            temp_vec[0][0] = U_x[i][j]
            temp_vec[0][1] = U_y[i][j]
        
            temp_vec[0] = np.dot(T_A_list[idx], temp_vec[0])
        
            V_x[i][j] = temp_vec[0][0]
            V_y[i][j] = temp_vec[0][1]
        
            W_x[i][j] = V_x[i][j] - U_x[i][j]
            W_y[i][j] = V_y[i][j] - U_y[i][j]
            #plt.arrow(0, 0, V_x[i][j], V_y[i][j], head_width=0.1, color='red')
            plt.arrow(0, 0, U_x[i][j], U_y[i][j], head_width=0.3, color='dimgrey', label=labels[0])
            plt.arrow(U_x[i][j], U_y[i][j], W_x[i][j], W_y[i][j], head_width=0.3, color='darkviolet', label=labels[1])
            
            range_const = 20
            plt.xlim([-range_const, range_const])
            plt.ylim([-range_const, range_const])
            plt.title(title_list[idx], fontsize=25)
            
            if idx==2:
                continue
 
            plt.arrow(0, 0, eigen_vectors.T[0][0]*10, eigen_vectors.T[0][1]*10, head_width=1, color='orange', label=labels[2])
            plt.arrow(0, 0, eigen_vectors.T[1][0]*10, eigen_vectors.T[1][1]*10, head_width=1, color='orange', label=labels[2])

grey_patch = mpatches.Patch(color='grey', label='Grids')
purple_patch = mpatches.Patch(color='darkviolet', label='Displacement vectors made by A')
yellow_patch = mpatches.Patch(color='gold', label='Real eigen vectors of A')
plt.legend(handles=[grey_patch, purple_patch, yellow_patch], fontsize=25, loc='lower right', bbox_to_anchor=(-0.1, -.35))
#plt.savefig("linear_transformation.png")
plt.show()
import numpy as np 
import matplotlib.pyplot as plt
from mpl_toolkits.mplot3d.proj3d import proj_transform
from mpl_toolkits.mplot3d.axes3d import Axes3D
from matplotlib.text import Annotation
from matplotlib.patches import FancyArrowPatch
import matplotlib.patches as mpatches

class Annotation3D(Annotation):
    def __init__(self, text, xyz, *args, **kwargs):
        super().__init__(text, xy=(0,0), *args, **kwargs)
        self._xyz = xyz

    def draw(self, renderer):
        x2, y2, z2 = proj_transform(*self._xyz, renderer.M)
        self.xy=(x2,y2)
        super().draw(renderer)

def _annotate3D(ax,text, xyz, *args, **kwargs):
    '''Add anotation `text` to an `Axes3d` instance.'''

    annotation= Annotation3D(text, xyz, *args, **kwargs)
    ax.add_artist(annotation)

setattr(Axes3D,'annotate3D',_annotate3D)

class Arrow3D(FancyArrowPatch):
    def __init__(self, x, y, z, dx, dy, dz, *args, **kwargs):
        super().__init__((0,0), (0,0), *args, **kwargs)
        self._xyz = (x,y,z)
        self._dxdydz = (dx,dy,dz)

    def draw(self, renderer):
        x1,y1,z1 = self._xyz
        dx,dy,dz = self._dxdydz
        x2,y2,z2 = (x1+dx,y1+dy,z1+dz)

        xs, ys, zs = proj_transform((x1,x2),(y1,y2),(z1,z2), renderer.M)
        self.set_positions((xs[0],ys[0]),(xs[1],ys[1]))
        super().draw(renderer)

def _arrow3D(ax, x, y, z, dx, dy, dz, *args, **kwargs):
    '''Add an 3d arrow to an `Axes3D` instance.'''

    arrow = Arrow3D(x, y, z, dx, dy, dz, *args, **kwargs)
    ax.add_artist(arrow)

setattr(Axes3D,'arrow3D',_arrow3D)

T_A = np.array([[60.45, 33.63, 46.29], 
                [33.63, 68.49, 50.93], 
                [46.29, 50.93, 53.61]])

T_A = T_A/50
const_range = 2


X = np.arange(-const_range, const_range + 1, 1)
Y = np.arange(-const_range, const_range + 1, 1)
Z = np.arange(-const_range, const_range + 1, 1)

U_x, U_y, U_z = np.meshgrid(X, Y, Z)

V_x = np.zeros((len(U_x), len(U_y), len(U_z)))
V_y = np.zeros((len(U_x), len(U_y), len(U_z)))
V_z = np.zeros((len(U_x), len(U_y), len(U_z)))

temp_vec = np.zeros((1, 3))

W_x = np.zeros((len(U_x), len(U_y), len(U_z)))
W_y = np.zeros((len(U_x), len(U_y), len(U_z)))
W_z = np.zeros((len(U_x), len(U_y), len(U_z)))

eigen_values, eigen_vectors = np.linalg.eig(T_A)
sorted_idx = eigen_values.argsort()[::-1]   
eigen_values = eigen_values[sorted_idx]
eigen_vectors = eigen_vectors[:,sorted_idx]
eigen_vectors = eigen_vectors.astype(float)

fig = plt.figure(figsize=(15, 15))
ax = fig.add_subplot(111, projection='3d')
grid_range = const_range + 5
ax.set_xlim(-grid_range, grid_range)
ax.set_ylim(-grid_range, grid_range)
ax.set_zlim(-grid_range, grid_range)

eigen_values, eigen_vectors = np.linalg.eig(T_A)
sorted_idx = eigen_values.argsort()[::-1]   
eigen_values = eigen_values[sorted_idx]
eigen_vectors = eigen_vectors[:,sorted_idx]
eigen_vectors = eigen_vectors.astype(float)
     
    
for i in range(len(eigen_vectors)):
    if(eigen_vectors.T[i][0] < 0):
        eigen_vectors.T[i] = - eigen_vectors.T[i]

for i in range(len(U_x)):
    for j in range(len(U_x)):
        for k in range(len(U_x)):
            temp_vec[0][0] = U_x[i][j][k]
            temp_vec[0][1] = U_y[i][j][k]
            temp_vec[0][2] = U_z[i][j][k]
        
            temp_vec[0] = np.dot(T_A, temp_vec[0])
        
            V_x[i][j][k] = temp_vec[0][0]
            V_y[i][j][k] = temp_vec[0][1]
            V_z[i][j][k] = temp_vec[0][2]
        
            W_x[i][j][k] = V_x[i][j][k] - U_x[i][j][k]
            W_y[i][j][k] = V_y[i][j][k] - U_y[i][j][k]
            W_z[i][j][k] = V_z[i][j][k] - U_z[i][j][k]
            ax.arrow3D(0, 0, 0, 
                       U_x[i][j][k], U_y[i][j][k], U_z[i][j][k], 
                       mutation_scale=10, arrowstyle="-|>", fc='dimgrey', ec='dimgrey')
            #ax.arrow3D(0, 0, 0, 
            #          V_x[i][j][k], V_y[i][j][k], V_z[i][j][k], 
            #           mutation_scale=10, arrowstyle="-|>", fc='red', ec='red')
            ax.arrow3D(U_x[i][j][k], U_y[i][j][k], U_z[i][j][k], 
                       W_x[i][j][k], W_y[i][j][k], W_z[i][j][k],
                       mutation_scale=10, arrowstyle="-|>", fc='darkviolet', ec='darkviolet')
            
ax.arrow3D(0, 0, 0, eigen_vectors.T[0][0]*10, eigen_vectors.T[0][1]*10, eigen_vectors.T[0][2]*10,
                       mutation_scale=10,  arrowstyle="-|>", fc='orange', ec='orange')
ax.arrow3D(0, 0, 0, eigen_vectors.T[1][0]*10, eigen_vectors.T[1][1]*10, eigen_vectors.T[1][2]*10,
                       mutation_scale=10, arrowstyle="-|>", fc='orange', ec='orange')
ax.arrow3D(0, 0, 0, eigen_vectors.T[2][0]*10, eigen_vectors.T[2][1]*10, eigen_vectors.T[2][2]*10,
                       mutation_scale=10, arrowstyle="-|>", fc='orange', ec='orange')

ax.text(eigen_vectors.T[0][0]*8 , eigen_vectors.T[0][1]*8, eigen_vectors.T[0][2]*8+1, r'v_1', fontsize=20)
ax.text(eigen_vectors.T[1][0]*8 , eigen_vectors.T[1][1]*8, eigen_vectors.T[1][2]*8, r'v_2', fontsize=20)
ax.text(eigen_vectors.T[2][0]*8 , eigen_vectors.T[2][1]*8, eigen_vectors.T[2][2]*8, r'v_3', fontsize=20)


grey_patch = mpatches.Patch(color='grey', label='Grids')
orange_patch = mpatches.Patch(color='orange', label='Orthogonal eigen vectors of A')
purple_patch = mpatches.Patch(color='darkviolet', label='Displacement vectors made by A')
plt.legend(handles=[grey_patch, orange_patch, purple_patch], fontsize=20, loc='lower right')

ax.set_xlabel(r'x_1', fontsize=25)
ax.set_ylabel(r'x_2', fontsize=25)
ax.set_zlabel(r'x_3', fontsize=25)
#plt.savefig("symmetric_positive_definite_visualizaiton.png")
plt.show()