Tag Archive for: Business Intelligence

How to Ensure Data Quality in an Organization?

Introduction to Data Quality

Today, the world is filled with data. It is everywhere. And, the value of any organization can be measured by the quality of its data. So, what actually is the quality of data or data quality, and why is it important? Well, data quality refers to the capability of a set of data to serve an intended purpose. 

Data quality is important to any organization because it provides timely and accurate information to manage accountability and services. It also helps to ensure and prioritize the best use of resources. Thus, high-quality data will lead to appropriate insights and valuable information for any organization. We can evaluate the quality of data in certain aspects. They include accuracy, relevancy, completeness, and uniqueness. 

Data Quality Problems

As the organizations are collecting vast amounts of data, managing its quality becomes more important every single day. In the year 2016, the costs of problems caused due to poor data quality were estimated by IBM, and it turned out to be $3.1 trillion across the U.S economy. Also, a Forrester report has stated that almost 30 percent of analysts spend 40 percent of their time validating and vetting their data prior to its utilization for strategic decision-making. These statistics indicate that the scale of the problems with data quality is vast.

So, why do these data quality problems occur? The main reasons include manual entry of data, software updates, integration of data sources, skills shortages, and insufficient testing time. Wrong decisions can be taken due to poor data management processes and poor quality of data. Because of this, many organizations lose their clients and customers. So, ensuring data quality must be given utmost importance in an organization. 

How to Ensure Data Quality?

Data quality management helps by combining data, technology, and organizational culture to deliver useful and accurate results. Good management of data quality builds a foundation for all the initiatives of a business. Now, let’s see how we can improve the data quality in an organization.

The first aspect of improving the quality of data is monitoring and cleansing data. This verifies data against standard statistical measures, validates data against matching descriptions, and uncovers relationships. This also checks the uniqueness of data and analyzes the data for its reusability. 

The second one is managing metadata centrally. Multiple people gather and clean data very often and they may work in different countries or offices. Therefore, you require clear policies on how data is gathered and managed as people in different parts of a company may misinterpret certain data terms and concepts. Centralized management of metadata is the solution to this problem as it reduces inconsistent interpretations and helps in establishing corporate standards.  

The next one is to ensure all the requirements are available and offer documentation for data processors and data providers. You have to format the specifications and offer a data dictionary and also provide training for the providers of data and all other new staff. Make sure you offer immediate help for all the data providers.

Very often, data is gathered from different sources and may include distinct spelling options. Hence, segmentation, scoring, smart lists, and many others are impacted by this. So, for entering a data point, a singular approach is essential, and data normalization provides this approach. The goal of this approach is to eliminate redundancy in data. Its advantages include easier object-to-data mapping and increased consistency.

The last aspect is to verify whether the data is consistent with the data rules and business goals, and this has to be done at regular intervals. You have to communicate the current status and data quality metrics to every stakeholder regularly to ensure the maintenance of data quality discipline across the organization.

Conclusion

Data quality is a continuous process but not a one-time project which needs the entire company to be data-focused and data-driven. It is much more than reliability and accuracy. High level of data quality can be achieved when the decision-makers have confidence in data and rely upon it. Follow the above-mentioned steps to ensure a high level of data quality in your organization. 

The Power of Analyzing Processes

Are you thinking BIG enough? Over the past few years, the quality of discussion regarding a ‘process’ and its interfaces between different departments has developed radically. Organizations increasingly reject guesswork, individual assessments, or blame-shifting and instead focus on objective facts: the display of throughput times, process variants, and their optimization.

But while data can hold valuable insights into business, users, customer bases, and markets, companies are sometimes unsure how best to analyze and harness their data. In fact, the problem isn’t usually a lack of data; it’s a breakdown in leveraging useful data. Being unsure how to interpret, explore, and analyze processes can paralyze any go-live, leading to a failure in the efficient interaction of processes and business operations. Without robust data analysis, your business could be losing money, talent, and even clients.

After all, analyzing processes is about letting data tell its true story for improved understanding.

The “as-is” processes

Analyzing the as-is current state helps organizations document, track, and optimize processes for better performance, greater efficiency, and improved outcomes. By contextualizing data, we gain the ability to navigate and organize processes to negate bottlenecks, set business preferences, and plan an optimized route through process mining initiatives. This focus can help across an entire organization, or on one or more specific processes or trends within a department or team.

There are several vital goals/motivations for implementing current state analysis, including:

  • Saving money and improving ROI;
  • Improving existing processes or creating new processes;
  • Increasing customer satisfaction and journeys;
  • Improving business coordination and organizational responsiveness;
  • Complying with new regulatory standards;
  • Adapting methods following a merger or acquisition.

The “to-be” processes

Simply put, if as-is maps where your processes are, to-be maps where you want them to… be. To-be process mapping documents what you want the process to look like, and by using the as-is diagram, you can work with stakeholders to identify developments and improvements of the current process, then outline those changes on your to-be roadmap.

This analysis can help you make optimal decisions for your business and innovative OpEx imperatives. For instance, at leading data companies like Google and Amazon, data is used in such a way that the analysis results make the decisions! Just think of the power Recommendation Engines, PageRank, and Demand Forecasting Systems have over the content we see. To achieve this, advanced techniques of machine learning and statistical modeling are applied, resulting in mechanically improved results from the data. Interestingly, because these techniques reference large-scale data sets and reflect analysis and results in real-time, they are applied to areas that extend beyond human decision-making.

Also, by analyzing and continuously monitoring qualitative and quantitative data, we gain insights across potential risks and ongoing improvement opportunities, too. The powerful combination of process discovery, process analysis, and conformance checking supports a collaborative approach to process improvement, giving you game-changing insights into your business. For example:

  • Which incidents would I like to detect and act upon proactively?
  • Where would task prioritization help improve overall performance?
  • Where do I know that increased transparency would help the company?
  • How can I utilize processes in place of gut feeling/experience?

Further, as the economic environment continues to change rapidly, and modern organizations keep adopting process-based approaches to ensure they are achieving their business goals, process analysis naturally becomes the perfect template for any company.

With this, process mining technology can help modern businesses manage process challenges beyond the boundaries of implementation. We can evaluate the proof of concept (PoC) for any proposed improvements, and extract relevant information from a homogenous data set. Of course, process modeling and business process management (BPM) are available to solve the potentially tricky integration phase.

Process mining and analysis initiatives

Process mining and discovery initiatives can also provide critical insights throughout the automation and any Robotic Process Automation (RPA) journey, from defining the strategy to continuous improvement and innovation. Data-based process mining can even extend process analysis across teams and individuals, decreasing incident resolution times, and subsequently improving working habits via the discovery and validation of automation opportunities.

A further example of where process mining and strategic process analysis/alignment is already paying dividends is IT incident management. Here, “incident” is an unplanned interruption to an IT service, which may be complete unavailability or merely a reduction in quality. The goal of the incident management process is to restore regular service operation as quickly as possible and to minimize the impact on business operations. Incident management is a critical process in Information Technology Library (ITIL).

Process mining can also further drive improvement in as-is incident management processes as well as exceptional and unwanted process steps, by increasing visibility and transparency across IT processes. Process mining will swiftly analyze the different working habits across teams and individuals, decreasing incident resolution times, and subsequently improving customer impact cases.

Positive and practical experiences with process mining across industries have also led to the further dynamic development of tools, use cases, and the end-user community. Even with very experienced process owners, the visualization of processes can skyrocket improvement via new ideas and discussion.

However, the potential performance gains are more extensive, with the benefits of using process mining for incident management, also including:

  • Finding out how escalation rules are working and how the escalation is done;
  • Calculating incident management KPIs, including SLA (%);
  • Discovering root causes for process problems;
  • Understanding the effect of the opening interface (email, web form, phone, etc.);
  • Calculating the cost of the incident process;
  • Aligning the incident management system with your incident management process.

Robotic Process Automation (RPA)

Robotic process automation (RPA) provides a virtual workforce to automatize manual, repetitive, and error-prone tasks. However, successful process automation requires specific knowledge about the intended (and potential) benefits, effective training of the robots, and continuous monitoring of their performance and processes.

With this, process mining supports organizations throughout the lifecycle of RPA initiatives by monitoring and benchmarking robots to ensure sustainable benefits. These insights are especially valuable for process miners and managers with a particular interest in process automation. By unlocking the experiences with process mining, a company better understands what is needed today, for tomorrow’s process initiatives.

To further upgrade the impact of robot-led automation, there is also a need for a solid understanding of legacy systems, and an overview of automation opportunities. Process mining tools provide key insights throughout the entire RPA journey, from defining the strategy to continuous improvement and innovation.

Benefits of process mining and analysis within the RPA lifecycle include:

  1. Overviews of processes within the company, based on specific criteria;
  2. Identification of processes suitable for RPA implementation during the preparation phase;
  3. Mining the optimal process flow/process path;
  4. Understanding the extent to which RPA can be implemented in legacy processes and systems;
  5. Monitoring and analysis of RPA performance during the transition/handover of customization;
  6. Monitoring and continuous improvement of RPA in the post-implementation phase.

The process of better business understanding

Every organization is different and brings with it a variety of process-related questions. Yet some patterns are usually repeated. For example, customers who introduce data supported process analysis as part of business transformation initiatives will typically face challenges in harmonizing processes from fragmented sectors and regional locations. Here it helps enormously to base actions on data and statistics from the respective processes, instead of relying on the instincts and estimations of individuals.

With this, process analysis which is supported by data, enables a fact-based discussion, and builds a bridge between employees, process experts and management. This helps avoid siloed thinking, as well as allowing the transparent design of handovers and process steps which cross departmental boundaries within an organization.

In other words, to unlock future success and transformation, we must be processing… today.

Find out more about process mining with Signavio Process Intelligence, and see how it can help your organization uncover the hidden value of process, generate fresh ideas, and save time and money.

From BI to PI: The Next Step in the Evolution of Data-Driven Decisions

“Change is a constant.” “The pace of change is accelerating.” “The world is increasingly complex, and businesses have to keep up.” Organizations of all shapes and sizes have heard these ideas over and over—perhaps too often! However, the truth remains that adaptation is crucial to a successful business.


Read this article in German: Von der Datenanalyse zur Prozessverbesserung: So gelingt eine erfolgreiche Process-Mining-Initiative


Of course, the only way to ensure that the decisions you make are evolving in the right way is to understand the underlying building blocks of your organization. You can think of it as DNA; the business processes that underpin the way you work and combine to create a single unified whole. Knowing how those processes operate, and where the opportunities for improvement lie, can be the difference between success and failure.

Businesses with an eye on their growth understand this already. In the past, Business Intelligence was seen as the solution to this challenge. In more recent times, forward-thinking organizations see the need for monitoring solutions that can keep up with today’s rate of change, at the same time as they recognize that increasing complexity within business processes means traditional methods are no longer sufficient.

Adapting to a changing environment? The challenges of BI

Business Intelligence itself is not necessarily defunct or obsolete. However, the tools and solutions that enable Business Intelligence face a range of challenges in a fast-paced and constantly changing world. Some of these issues may include:

  • High data latency – Data latency refers to how long it takes for a business user to retrieve data from, for example, a business intelligence dashboard. In many cases, this can take more than 24 hours, a critical time period when businesses are attempting to take advantage of opportunities that may have a limited timeframe.
  • Incomplete data sets – The broad approach of Business Intelligence means investigations may run wide but not deep. This increases the chances that data will be missed, especially in instances where the tools themselves make the parameters for investigations difficult to change.
  • Discovery, not analysis – Business intelligence tools are primarily optimized for exploration, with a focus on actually finding data that may be useful to their users. Often, this is where the tools stop, offering no simple way for users to actually analyze the data, and therefore reducing the possibility of finding actionable insights.
  • Limited scalability – In general, Business Intelligence remains an arena for specialists and experts, leaving a gap in understanding for operational staff. Without a wide appreciation for processes and their analysis within an organization, the opportunities to increase the application of a particular Business Intelligence tool will be limited.
  • Unconnected metrics – Business Intelligence can be significantly restricted in its capacity to support positive change within a business through the use of metrics that are not connected to the business context. This makes it difficult for users to interpret and understand the results of an investigation, and apply these results to a useful purpose within their organization.

Process Intelligence: the next evolutionary step

To ensure companies can work efficiently and make the best decisions, a more effective method of process discovery is needed. Process Intelligence (PI) provides the critical background to answer questions that cannot be answered with Business Intelligence tools.

Process Intelligence offers visualization of end-to-end process sequences using raw data, and the right Process Intelligence tool means analysis of that raw data can be conducted straight away, so that processes are displayed accurately. The end-user is free to view and work with this accurate information as they please, without the need to do a preselection for the analysis.

By comparison, because Business Intelligence requires predefined analysis criteria, only once the criteria are defined can BI be truly useful. Organizations can avoid delayed analysis by using Process Intelligence to identify the root causes of process problems, then selecting the right criteria to determine the analysis framework.

Then, you can analyze your system processes and see the gaps and variants between the intended business process and what you actually have. And of course, the faster you discover what you have, the faster you can apply the changes that will make a difference in your business.

In short, Business Intelligence is suitable for gaining a broad understanding of the way a business usually functions. For some businesses, this will be sufficient. For others, an overview is not enough.

They understand that true insights lie in the detail, and are looking for a way of drilling down into exactly how each process within their organization actually works. Software that combines process discovery, process analysis, and conformance checking is the answer.

The right Process Intelligence tools means you will be able to automatically mine process models from the different IT systems operating within your business, as well as continuously monitor your end-to-end processes for insights into potential risks and ongoing improvement opportunities. All of this is in service of a collaborative approach to process improvement, which will lead to a game-changing understanding of how your business works, and how it can work better.

Early humans evolved from more primitive ancestors, and in the process, learned to use more and more sophisticated tools. For the modern human, working in a complex organization, the right tool is Process Intelligence.

Endless Potential with Signavio Process Intelligence

Signavio Process Intelligence allows you to unearth the truth about your processes and make better decisions based on true evidence found in your organization’s IT systems. Get a complete end-to-end perspective and understanding of exactly what is happening in your organization in a matter of weeks.

As part of Signavio Business Transformation Suite, Signavio Process Intelligence integrates perfectly with Signavio Process Manager and is accessible from the Signavio Collaboration Hub. As an entirely cloud-based process mining solution, the tool makes it easy to collaborate with colleagues from all over the world and harness the wisdom of the crowd.

Find out more about Signavio Process Intelligence, and see how it can help your organization generate more ideas, save time and money, and optimize processes.

Interview: Does Business Intelligence benefit from Cloud Data Warehousing?

Interview with Ross Perez, Senior Director, Marketing EMEA at Snowflake

Read this article in German:
“Profitiert Business Intelligence vom Data Warehouse in der Cloud?”

Does Business Intelligence benefit from Cloud Data Warehousing?

Ross Perez is the Senior Director, Marketing EMEA at Snowflake. He leads the Snowflake marketing team in EMEA and is charged with starting the discussion about analytics, data, and cloud data warehousing across EMEA. Before Snowflake, Ross was a product marketer at Tableau Software where he founded the Iron Viz Championship, the world’s largest and longest running data visualization competition.
Data Science Blog: Ross, Business Intelligence (BI) is not really a new trend. In 2019/2020, making data available for the whole company should not be a big thing anymore. Would you agree?

BI is definitely an old trend, reporting has been around for 50 years. People are accustomed to seeing statistics and data for the company at large, and even their business units. However, using BI to deliver analytics to everyone in the organization and encouraging them to make decisions based on data for their specific area is relatively new. In a lot of the companies Snowflake works with, there is a huge new group of people who have recently received access to self-service BI and visualization tools like Tableau, Looker and Sigma, and they are just starting to find answers to their questions.

Data Science Blog: Up until today, BI was just about delivering dashboards for reporting to the business. The data warehouse (DWH) was something like the backend. Today we have increased demand for data transparency. How should companies deal with this demand?

Because more people in more departments are wanting access to data more frequently, the demand on backend systems like the data warehouse is skyrocketing. In many cases, companies have data warehouses that weren’t built to cope with this concurrent demand and that means that the experience is slow. End users have to wait a long time for their reports. That is where Snowflake comes in: since we can use the power of the cloud to spin up resources on demand, we can serve any number of concurrent users. Snowflake can also house unlimited amounts of data, of both structured and semi-structured formats.

Data Science Blog: Would you say the DWH is the key driver for becoming a data-driven organization? What else should be considered here?

Absolutely. Without having all of your data in a single, highly elastic, and flexible data warehouse, it can be a huge challenge to actually deliver insight to people in the organization.

Data Science Blog: So much for the theory, now let’s talk about specific use cases. In general, it matters a lot whether you are storing and analyzing e.g. financial data or machine data. What do we have to consider for both purposes?

Financial data and machine data do look very different, and often come in different formats. For instance, financial data is often in a standard relational format. Data like this needs to be able to be easily queried with standard SQL, something that many Hadoop and noSQL tools were unable to provide. Luckily, Snowflake is an ansi-standard SQL data warehouse so it can be used with this type of data quite seamlessly.

On the other hand, machine data is often semi-structured or even completely unstructured. This type of data is becoming significantly more common with the rise of IoT, but traditional data warehouses were very bad at dealing with it since they were optimized for relational data. Semi-structured data like JSON, Avro, XML, Orc and Parquet can be loaded into Snowflake for analysis quite seamlessly in its native format. This is important, because you don’t want to have to flatten the data to get any use from it.

Both types of data are important, and Snowflake is really the first data warehouse that can work with them both seamlessly.

Data Science Blog: Back to the common business use case: Creating sales or purchase reports for the business managers, based on data from ERP-systems such as Microsoft or SAP. Which architecture for the DWH could be the right one? How many and which database layers do you see as necessary?

The type of report largely does not matter, because in all cases you want a data warehouse that can support all of your data and serve all of your users. Ideally, you also want to be able to turn it off and on depending on demand. That means that you need a cloud-based architecture… and specifically Snowflake’s innovative architecture that separates storage and compute, making it possible to pay for exactly what you use.

Data Science Blog: Where would you implement the main part of the business logic for the report? In the DWH or in the reporting tool? Does it matter which reporting tool we choose?

The great thing is that you can choose either. Snowflake, as an ansi-Standard SQL data warehouse, can support a high degree of data modeling and business logic. But you can also utilize partners like Looker and Sigma who specialize in data modeling for BI. We think it’s best that the customer chooses what is right for them.

Data Science Blog: Snowflake enables organizations to store and manage their data in the cloud. Does it mean companies lose control over their storage and data management?

Customers have complete control over their data, and in fact Snowflake cannot see, alter or change any aspect of their data. The benefit of a cloud solution is that customers don’t have to manage the infrastructure or the tuning – they decide how they want to store and analyze their data and Snowflake takes care of the rest.

Data Science Blog: How big is the effort for smaller and medium sized companies to set up a DWH in the cloud? Does this have to be an expensive long-term project in every case?

The nice thing about Snowflake is that you can get started with a free trial in a few minutes. Now, moving from a traditional data warehouse to Snowflake can take some time, depending on the legacy technology that you are using. But Snowflake itself is quite easy to set up and very much compatible with historical tools making it relatively easy to move over.

Business Intelligence Organizations

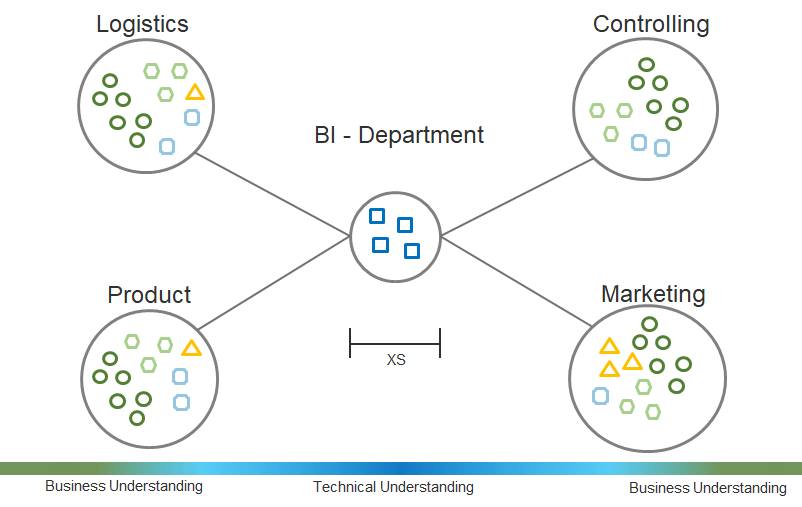
I am often asked how the Business Intelligence department should be set up and how it should interact and collaborate with other departments. First and foremost: There is no magic recipe here, but every company must find the right organization for itself.

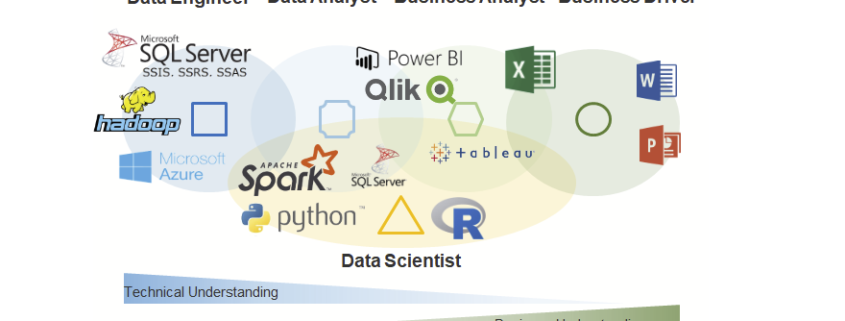
Before we can talk about organization of BI, we need to have a clear definition of roles for team members within a BI department.

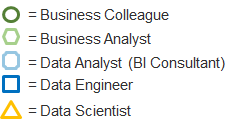
A Data Engineer (also Database Developer) uses databases to save structured, semi-structured and unstructured data. He or she is responsible for data cleaning, data availability, data models and also for the database performance. Furthermore, a good Data Engineer has at least basic knowledge about data security and data privacy. A Data Engineer uses SQL and NoSQL-Technologies.

A Data Analyst (also BI Analyst or BI Consultant) uses the data delivered by the Data Engineer to create or adjust data models and implementing business logic in those data models and BI dashboards. He or she needs to understand the needs of the business. This job requires good communication and consulting skills as well as good developing skills in SQL and BI Tools such like MS Power BI, Tableau or Qlik.

A Business Analyst (also Business Data Analyst) is a person form any business department who has basic knowledge in data analysis. He or she has good knowledge in MS Excel and at least basic knowledge in data analysis and BI Tools. A Business Analyst will not create data models in databases but uses existing data models to create dashboards or to adjust existing data analysis applications. Good Business Analyst have SQL Skills.

A Data Scientist is a Data Analyst with extended skills in statistics and machine learning. He or she can use very specific tools and analytical methods for finding pattern in unknow or big data (Data Mining) or to predict events based on pattern calculated by using historized data (Predictive Analytics). Data Scientists work mostly with Python or R programming.

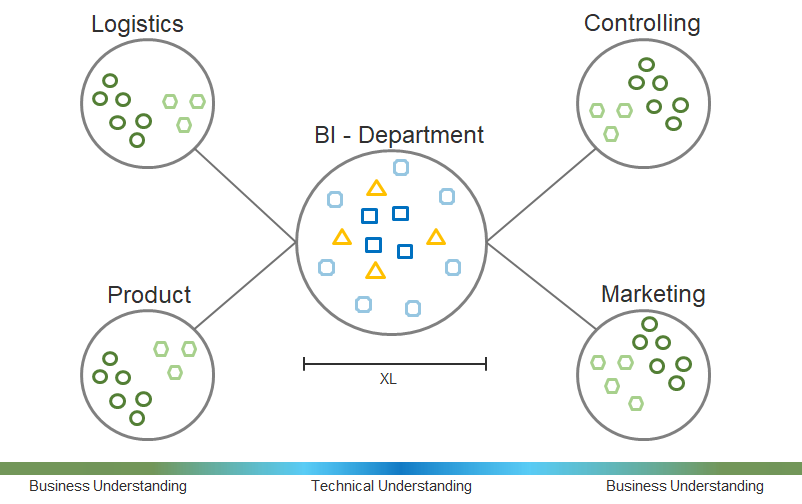
Organization Type 1 – Central Approach (Data Lab)

The first type of organization is the data lab approach. This organization form is easy to manage because it’s focused and therefore clear in terms of budgeting. The data delivery is done centrally by experts and their method and technology knowledge. Consequently, the quality expectation of data delivery and data analysis as well as the whole development process is highest here. Also the data governance is simple and the responsibilities clearly adjustable. Not to be underestimated is the aspect of recruiting, because new employees and qualified applicants like to join a central team of experts.

However, this form of organization requires that the company has the right working attitude, especially in the business intelligence department. A centralized business intelligence department acts as a shared service. Accordingly, customer-oriented thinking becomes a prerequisite for the company’s success – and customers here are the other departments that need access to the capacities of those centralized data experts. Communication boundaries must be overcome and ways of simple and effective communication must be found.

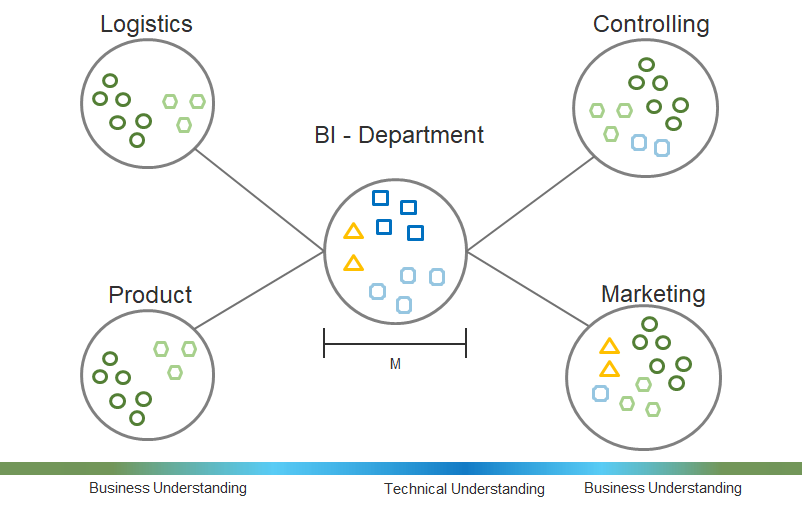
Organization Type 2 – Stakeholder Focus Approach

Other companies want to shift more responsibility for data governance, and especially data use and analytics, to those departments where data plays a key role right now. A central business intelligence department manages its own projects, which have a meaning for the entire company. The specialist departments, which have a special need for data analysis, have their own data experts who carry out critical projects for the specialist department. The central Business Intelligence department does not only provide the technical delivery of data, but also through methodical consulting. Although most of the responsibility lies with the Business Intelligence department, some other data-focused departments are at least co-responsible.

The advantage is obvious: There are special data experts who work deeper in the actual departments and feel more connected and responsible to them. The technical-business focus lies on pain points of the company.

However, this form of Ogranization also has decisive disadvantages: The danger of developing isolated solutions that are so special in some specific areas that they will not really work company-wide increases. Typically the company has to deal with asymmetrical growth of data analytics
know-how. Managing data governance is more complex and recruitment is becoming more difficult as the business intelligence department is weakened and smaller, and data professionals for other departments need to have more business focus, which means they are looking for more specialized profiles.

Organization Type 3 – Decentral Approach

Some companies are also taking a more extreme approach in the other direction. The Business Intelligence department now has only Data Engineers building and maintaining the data warehouse or data lake. As a result, the central department only provides data; it is used and analyzed in all other departments, specifically for the respective applications.

The advantage lies in the personal responsibility of the respective departments as „pain points“ of the company are in focus in belief that business departments know their problems and solutions better than any other department does. Highly specialized data experts can understand colleagues of their own department well and there is no no shared service mindset neccessary, except for the data delivery.

Of course, this organizational form has clear disadvantages since many isolated solutions are unavoidable and the development process of each data-driven solution will be inefficient. These insular solutions may work with luck for your own department, but not for the whole company. There is no one single source of truth. The recruiting process is more difficult as it requires more specialized data experts with more business background. We have to expect an asymmetrical growth of data analytics know-how and a difficult data governance.


Bringing intelligence to where data lives: Python & R embedded in T-SQL

Introduction

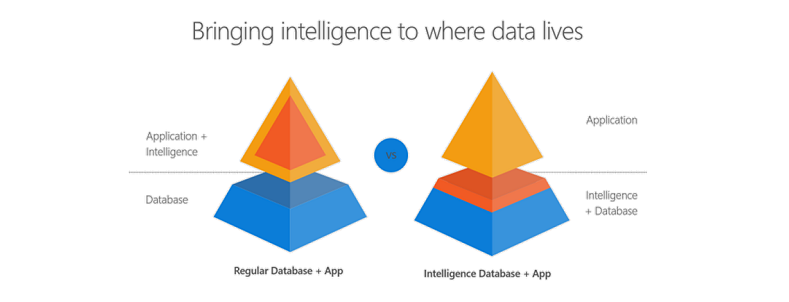
Did you know that you can write R and Python code within your T-SQL statements? Machine Learning Services in SQL Server eliminates the need for data movement. Instead of transferring large and sensitive data over the network or losing accuracy with sample csv files, you can have your R/Python code execute within your database. Easily deploy your R/Python code with SQL stored procedures making them accessible in your ETL processes or to any application. Train and store machine learning models in your database bringing intelligence to where your data lives.

You can install and run any of the latest open source R/Python packages to build Deep Learning and AI applications on large amounts of data in SQL Server. We also offer leading edge, high-performance algorithms in Microsoft’s RevoScaleR and RevoScalePy APIs. Using these with the latest innovations in the open source world allows you to bring unparalleled selection, performance, and scale to your applications.

If you are excited to try out SQL Server Machine Learning Services, check out the hands on tutorial below. If you do not have Machine Learning Services installed in SQL Server,you will first want to follow the getting started tutorial I published here: 

How-To Tutorial

In this tutorial, I will cover the basics of how to Execute R and Python in T-SQL statements. If you prefer learning through videos, I also published the tutorial on YouTube.

Basics

Open up SQL Server Management Studio and make a connection to your server. Open a new query and paste this basic example: (While I use Python in these samples, you can do everything with R as well)

EXEC sp_execute_external_script @language = N'Python',
@script = N'print(3+4)'

Sp_execute_external_script is a special system stored procedure that enables R and Python execution in SQL Server. There is a “language” parameter that allows us to choose between Python and R. There is a “script” parameter where we can paste R or Python code. If you do not see an output print 7, go back and review the setup steps in this article.

Parameter Introduction

Now that we discussed a basic example, let’s start adding more pieces:

EXEC sp_execute_external_script  @language =N'Python', 
@script = N' 
OutputDataSet = InputDataSet;
',
@input_data_1 =N'SELECT 1 AS Col1';

Machine Learning Services provides more natural communications between SQL and R/Python with an input data parameter that accepts any SQL query. The input parameter name is called “input_data_1”.
You can see in the python code that there are default variables defined to pass data between Python and SQL. The default variable names are “OutputDataSet” and “InputDataSet” You can change these default names like this example:

EXEC sp_execute_external_script  @language =N'Python', 
@script = N' 
MyOutput = MyInput;
',
@input_data_1_name = N'MyInput',
@input_data_1 =N'SELECT 1 AS foo',
@output_data_1_name =N'MyOutput';

As you executed these examples, you might have noticed that they each return a result with “(No column name)”? You can specify a name for the columns that are returned by adding the WITH RESULT SETS clause to the end of the statement which is a comma separated list of columns and their datatypes.

EXEC sp_execute_external_script  @language =N'Python', 
@script=N' 
MyOutput = MyInput;
',
@input_data_1_name = N'MyInput',
@input_data_1 =N'
SELECT 1 AS foo,
2 AS bar
',
@output_data_1_name =N'MyOutput'
WITH RESULT SETS ((MyColName int, MyColName2 int));

Input/Output Data Types

Alright, let’s discuss a little more about the input/output data types used between SQL and Python. Your input SQL SELECT statement passes a “Dataframe” to python relying on the Python Pandas package. Your output from Python back to SQL also needs to be in a Pandas Dataframe object. If you need to convert scalar values into a dataframe here is an example:

EXEC sp_execute_external_script  @language =N'Python', 
@script=N' 
import pandas as pd
c = 1/2
d = 1*2
s = pd.Series([c,d])
df = pd.DataFrame(s)
OutputDataSet = df
'

Variables c and d are both scalar values, which you can add to a pandas Series if you like, and then convert them to a pandas dataframe. This one shows a little bit more complicated example, go read up on the python pandas package documentation for more details and examples:

EXEC sp_execute_external_script  @language =N'Python', 
@script=N' 
import pandas as pd
s = {"col1": [1, 2], "col2": [3, 4]}
df = pd.DataFrame(s)
OutputDataSet = df
'

You now know the basics to execute Python in T-SQL!

Did you know you can also write your R and Python code in your favorite IDE like RStudio and Jupyter Notebooks and then remotely send the execution of that code to SQL Server? Check out these documentation links to learn more: https://aka.ms/R-RemoteSQLExecution https://aka.ms/PythonRemoteSQLExecution

Check out the SQL Server Machine Learning Services documentation page for more documentation, samples, and solutions. Check out these E2E tutorials on github as well.

Would love to hear from you! Leave a comment below to ask a question, or start a discussion!

OLAP Technology in Business Intelligence

Data in Business Intelligence
Business processes traditionally comprise three stages of data management: collecting, analyzing, and reporting. First, data should be gathered from all the sources through ETL tools (Extract, Transform, Load). After this, there are often issues occurring connected with data consistency hence the data should be cleaned and structured using the function of metadata. Once the data are provided to the end-user in a readable and transparent way it is ready to be analyzed. There are multiple applications ensuring data analysis including Data Mining, OLAP, BI. In order to carry out in-depth and coherent analysis, the best approach is to initially determine KPI as these are the criteria to assess the progress in relation to the goals set.

OLAP definition
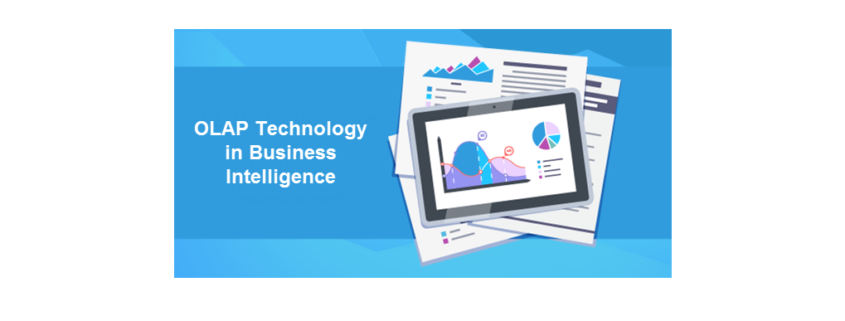
OLAP tool belongs to Business Intelligence concept intended for big data management and is short for Online Analytical Processing. OLAP conducts multidimensional data analysis and enables end-users to perform complicated calculations, trend analysis, ‘what-if’ scenarios and the like. Furthermore, owing to OLAP it’s possible to conduct planning and forecasting, budgeting and financial reporting, analysis, and data modeling which contributes to successful decision making in business.

OLAP Structure
An OLAP cube is composed of dimensions containing aggregated information referred to and measures which include numerical data. Dimensions are arranged in hierarchies which in their turn are indicators to determine the rate of granularity; the rate is called a level. The most common dimensions are location, product, and time. The lowest granularity level of a time dimension may be hours while the highest one can present years. This way when there is a query to be responded the measures contribute to filter out the data and select the right object inside the dimension. In the center of the cube there is a star or a snowflake schema which all the dimensions refer to.

OLAP main characteristics
Here are the main features characterizing the OLAP tool”:

– The data in OLAP is structured as a multidimensional cube.
– The cube structure allows users to see the information from various angles given location, products, demographics, time, etc.
– Rapid data access and analysis due to precalculated aggregations.
– Simple and intuitive interface.
– OLAP doesn’t require IT skills or SQL knowledge (as some other business intelligence software tools). Hence its operation eases the burden of IT department.
– The tool supports complex custom calculations
– The OLAP databases maintain historical data and are updated not constantly but regularly.
– The cube design and building process is the pivotal step on the way to successful data processing.

OLAP requirements
When the OLAP technology was invented there were twelve rules generated to follow so that it complies with the concept of online data processing:

Multidimensional
Not only the OLAP view has to be multidimensional but the data should as well be stored in this way of structure in order to provide the multidimensional analysis.

Transparent
The architecture has to be transparent to let the user see and understand the functionality and the client server of the application.

Accessible
The end user must have an opportunity to access the information in its consistent view without any issues related to the sources where the data come from or the way the data are maintained in OLAP.

Consistent Reporting
The data are regularly upgraded and its volume grows progressively although the user shouldn’t see problems changes in the process of scheduled reporting regarding that.

Client-Server
OLAP application has to manage client-server architecture as it manages vast volumes of data often requiring a core server for storage and maintenance.

Common Dimensionality
The main feature of the dimension structure in OLAP must be the same for all the dimensions to keep the data consistent, accurate, valid, complete, etc. Thus the dimensions have to possess common operation capabilities and be equal in structure.

Dynamic Sparse Matrix Handling
A usual OLAP application must manage to deal with sparse matrices and shouldn’t let the cube expand excessively as a usual OLAP cube is relatively sparse.

Multi-User
OLAP technology is originally supposed to provide an opportunity to access the data for multiple users simultaneously. The process of data management must at the same time be ensured with security and integrity.

Unrestricted Cross-dimensional Operations
A typical OLAP application is meant to handle all calculations and operations (such as slice-and-dice, drill up-down, drill through etc.) without the participation of the user. Commonly the tool delivers a language to exploit while requiring specified information.

Intuitive Data Manipulation
All OLAP operations which handle dimensions, measures, hierarchies, levels etc. have to be user-friendly and easily adopted without requiring additional technical skills. An average employee is considered to cope with the data navigation and management through clear displaying and handy operations.

Flexible Reporting
The main function – reporting must be flexible with a view to organizing all the rows, columns, and page setup containing a requisite number of dimensions and hierarchies from the data. As a result, the user has to gain a report comprising all the needed members and the relations between them.

Unlimited Dimensions and Aggregation Levels
When the technology was designed it was intended to be able to contain up to twenty dimensions in the cube. Each dimension had to provide as many aggregation levels inside a hierarchy as required. The idea was to manage great volumes of data keeping end-users absolutely aware of the performance of the organization.

Advantages of OLAP
Speed
Before OLAP was invented and introduced to the market there hadn’t been a tool to rapidly run the queries and it had taken long to retrieve the required information from the data. Thus the main advantage of the OLAP application is its speed gained due to precomputation of the data aggregations.

MDX designer and ad-hoc reports
MDX Designer is aimed at creating interactive ad-hoc reports. The reports provide a better understanding of the business processes and the organization’s performance in the market.

Visualization
OLAP provides its users with sophisticated data analytics allowing them to see data from different perspectives. There are numerous formats to visualize the requisite data: pie charts, graphs, heat maps, reports, pyramids, etc. Moreover, OLAP includes a number of operations to handle data: rotate, drill up and down, slice and dice, etc. Besides, there’s also an opportunity to apply a ‘what-if’ scenario due to a write-back option. All mentioned above can significantly contribute to decision-making process regarding the ongoing situation.

Flexibility
OLAP table displayed is flexible with column and row labels depending on the requirements of the user. Moreover, the reporting generated is available in multiple dimensions.

Success Criteria Process Mining

Process Mining is much more than the automatic drawing of process models.

Process mining is on the rise. By using Process mining, organizations can see how their processes really operate [1]. The results are amazing new insights about these processes that cannot be obtained in any other way. However, there are a few things that can go wrong. In this article, Frank van Geffen and Anne Rozinat give you tips about the pitfalls and advice that will help you to make your first process mining project as successful as it can be. Read more

Data Science on a large scale – can it be done?

Analytics drives business

In today’s digital world, data has become the crucial success factor for businesses as they seek to maintain a competitive advantage, and there are numerous examples of how companies have found smart ways of monetizing data and deriving value accordingly.

On the one hand, many companies use data analytics to streamline production lines, optimize marketing channels, minimize logistics costs and improve customer retention rates.  These use cases are often described under the umbrella term of operational BI, where decisions are based on data to improve a company’s internal operations, whether that be a company in the manufacturing industry or an e-commerce platform.

On the other hand, over the last few years, a whole range of new service-oriented companies have popped up whose revenue models wholly depend on data analytics.  These Data-Driven Businesses have contributed largely to the ongoing development of new technologies that make it possible to process and analyze large amounts of data to find the right insights.  The better these technologies are leveraged, the better their value-add and the better for their business success.  Indeed, without data and data analytics, they don’t have a business.

Data Science – hype or has it always been around?Druck

In my opinion, there is too much buzz around the new era of data scientists.  Ten years ago, people simply called it data mining, describing similar skills and methods.  What has actually changed is the fact that businesses are now confronted with new types of data sources such as mobile devices and data-driven applications rather than statistical methodologies.  I described that idea in detail in my recent post Let’s replace the Vs of Big Data with a single D.

But, of course, you cannot deny that the importance of these data crunchers has increased significantly. The art of mining data mountains (or perhaps I should say “diving through data lakes”) to find appropriate insights and models and then find the right answers to urgent, business-critical questions has become very popular these days.

The challenge: Data Science with large volumes?

Michael Stonebraker, winner of the Turing Award 2014, has been quoted as saying: “The change will come when business analysts who work with SQL on large amounts of data give way to data EXASOL Pipelinescientists, which will involve more sophisticated analysis, predictive modeling, regressions and Bayesian classification. That stuff at scale doesn’t work well on anyone’s engine right now. If you want to do complex analytics on big data, you have a big problem right now.”

And if you look at the limitations of existing statistical environments out there using R, Python, Java, Julia and other languages, I think he is absolutely right.  Once the data scientists have to handle larger volumes, the tools are just not powerful and scalable enough.  This results in data sampling or aggregation to make statistical algorithms applicable at all.

A new architecture for “Big Data Science”

We at EXASOL have worked hard to develop a smart solution to respond to this challenge.  Imagine that it is possible to use raw data and intelligent statistical models on very large data sets, directly at the place where the data is stored.  Where the data is processed in-memory to achieve optimal performance, all distributed across a powerful MPP cluster of servers, in an environment where you can now “install” the programming language of your choice.

Sounds far-fetched?  If you are not convinced, then I highly recommend you have a look at our brand-new in-database analytic programming platform, which is deeply integrated in our parallel in-memory engine and extensible through using nearly any programming language and statistical library.

For further information on our approach to big data science, go ahead and download a copy of our technical whitepaper:  Big Data Science – The future of analytics.