Tag Archive for: Business Analytics

Control the visibility of the PowerBI visuals based on condition

In PowerBI, there is no direct or functional mechanism to adjust the visibility (Show/Hide) of visualizations based on filter choices. There is, however, a workaround that enables us to show/hide visuals based on filter condition.

The fundamental concept behind this technique is to apply a mask to a visual and change its opacity based on a condition or filter selection.

Use Case:

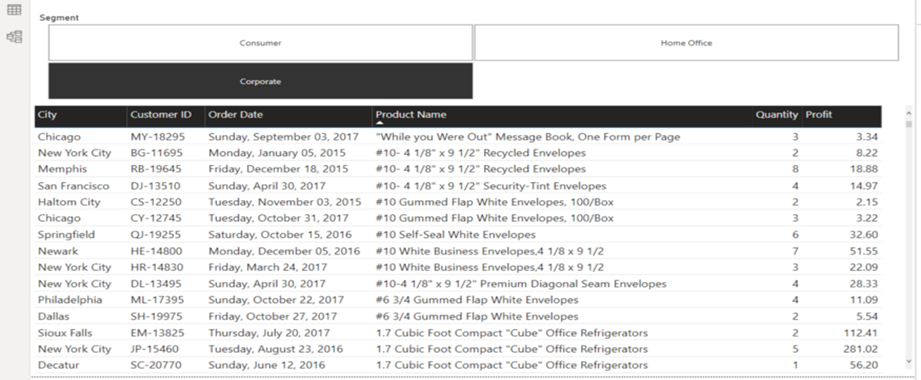
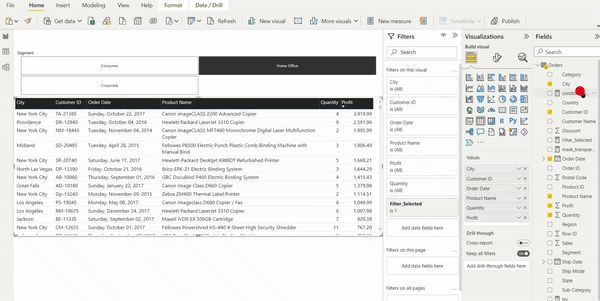
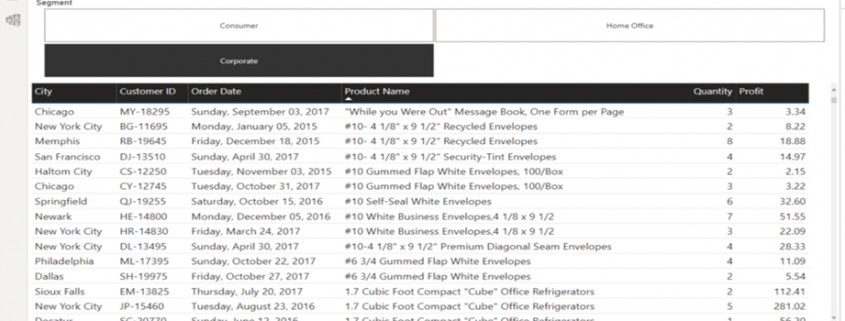
I have detail table of orders. These orders are divided into Consumer, Home Office, and Corporation categories. I use segment as a filter. One of the requirements is to present a table of detail if the overall profit for the selected segment is less than $100,000. To do this, this task will be divided into two major parts. First, we will display the table if the filter is selected. Next, we will add a condition to the table.

Step 1: Show table only filter is selected

  • Place filter (Slicer) and visual on the Report Pane.

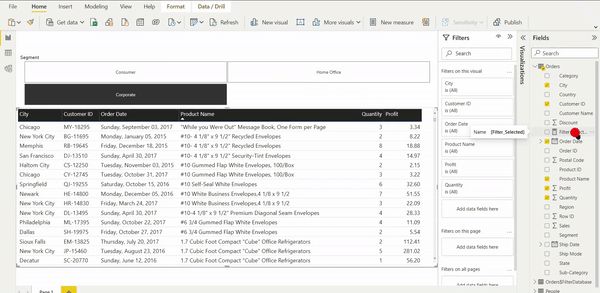
  • Create a measure that will determine if the filter is selected or not.

Filter_Selected = IF(ISFILTERED(Orders[Segment]),1,0)

  • Add this measure to the filter pane of the table visualization and select the show item when the value is 1 option. This will ensure that when no options are selected, only the header is displayed.

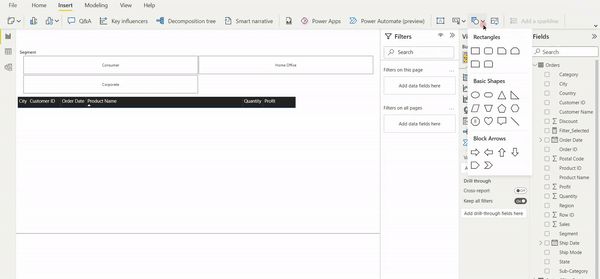
  • Set the mask down on the table. Make sure you only mask the table header with a border color that matches your background, or remove it entirely.

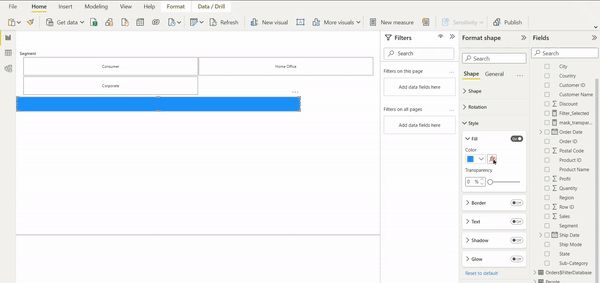
  • Create a measure to change the mask’s transparency. If two zeros are appended to the end of any HAX code, this represents complete transparency.

mask_transparency =IF([Filter_Selected],”#FFFFFF00″,”#FFFFFF”)

  • Keep this measure on the Fill of the mask and add conditional formatting to it.

If the mask transparency(measure) field is grayed out during the previous steps, you may need to modify the data type of mask transparency to text.

Step 2 : Add a condition to the solution

  • Create a new measure to determine if our condition is met.

condition_check = IF(CALCULATE(SUM(Orders[Profit]),filter(all(Orders), Orders[Segment] = SELECTEDVALUE(Orders[Segment]))) < 100000,1,0)

  • Now add this new measure to a table visual’s filter pane and pick the show item when the value is 1 option. This ensures that only if the condition meets the table will appear.

You can now display or hide visuals based on slicer selection and condition. If you know a better way to do this, please comment and let me know. For this article, I referred to this page.


Data Science in Engineering Process - Product Lifecycle Management

How to develop digital products and solutions for industrial environments?

The Data Science and Engineering Process in PLM.

Huge opportunities for digital products are accompanied by huge risks

Digitalization is about to profoundly change the way we live and work. The increasing availability of data combined with growing storage capacities and computing power make it possible to create data-based products, services, and customer specific solutions to create insight with value for the business. Successful implementation requires systematic procedures for managing and analyzing data, but today such procedures are not covered in the PLM processes.

From our experience in industrial settings, organizations start processing the data that happens to be available. This data often does not fully cover the situation of interest, typically has poor quality, and in turn the results of data analysis are misleading. In industrial environments, the reliability and accuracy of results are crucial. Therefore, an enormous responsibility comes with the development of digital products and solutions. Unless there are systematic procedures in place to guide data management and data analysis in the development lifecycle, many promising digital products will not meet expectations.

Various methodologies exist but no comprehensive framework

Over the last decades, various methodologies focusing on specific aspects of how to deal with data were promoted across industries and academia. Examples are Six Sigma, CRISP-DM, JDM standard, DMM model, and KDD process. These methodologies aim at introducing principles for systematic data management and data analysis. Each methodology makes an important contribution to the overall picture of how to deal with data, but none provides a comprehensive framework covering all the necessary tasks and activities for the development of digital products. We should take these approaches as valuable input and integrate their strengths into a comprehensive Data Science and Engineering framework.

In fact, we believe it is time to establish an independent discipline to address the specific challenges of developing digital products, services and customer specific solutions. We need the same kind of professionalism in dealing with data that has been achieved in the established branches of engineering.

Data Science and Engineering as new discipline

Whereas the implementation of software algorithms is adequately guided by software engineering practices, there is currently no established engineering discipline covering the important tasks that focus on the data and how to develop causal models that capture the real world. We believe the development of industrial grade digital products and services requires an additional process area comprising best practices for data management and data analysis. This process area addresses the specific roles, skills, tasks, methods, tools, and management that are needed to succeed.

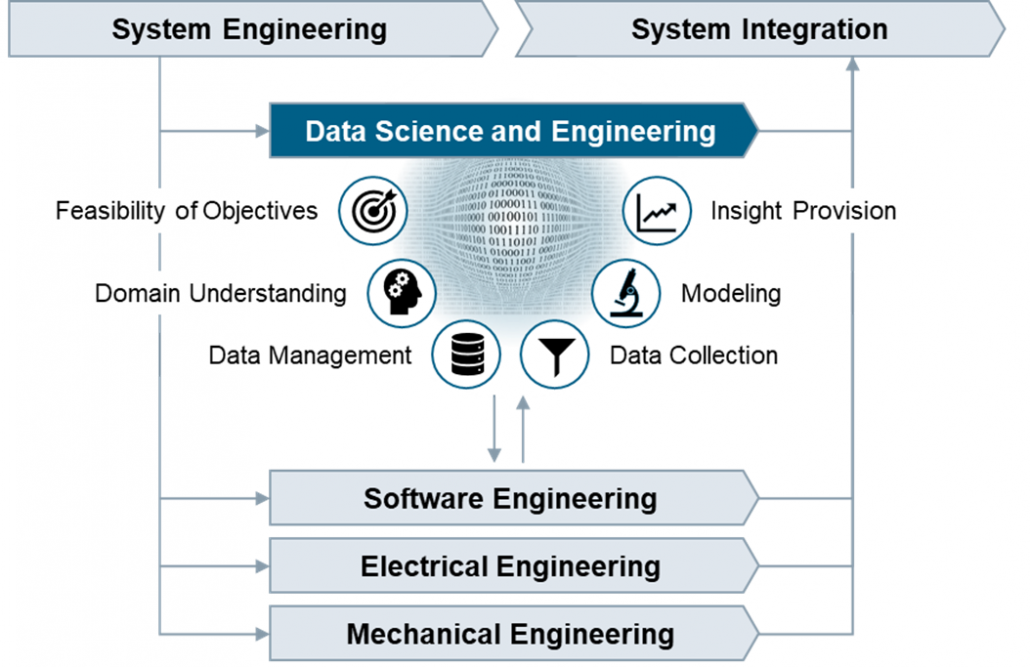
Figure: Data Science and Engineering as new engineering discipline

More than in other engineering disciplines, the outputs of Data Science and Engineering are created in repetitions of tasks in iterative cycles. The tasks are therefore organized into workflows with distinct objectives that clearly overlap along the phases of the PLM process.

Feasibility of Objectives
  Understand the business situation, confirm the feasibility of the product idea, clarify the data infrastructure needs, and create transparency on opportunities and risks related to the product idea from the data perspective.
Domain Understanding
  Establish an understanding of the causal context of the application domain, identify the influencing factors with impact on the outcomes in the operational scenarios where the digital product or service is going to be used.
Data Management
  Develop the data management strategy, define policies on data lifecycle management, design the specific solution architecture, and validate the technical solution after implementation.
Data Collection
  Define, implement and execute operational procedures for selecting, pre-processing, and transforming data as basis for further analysis. Ensure data quality by performing measurement system analysis and data integrity checks.
Modeling
  Select suitable modeling techniques and create a calibrated prediction model, which includes fitting the parameters or training the model and verifying the accuracy and precision of the prediction model.
Insight Provision
  Incorporate the prediction model into a digital product or solution, provide suitable visualizations to address the information needs, evaluate the accuracy of the prediction results, and establish feedback loops.

Real business value will be generated only if the prediction model at the core of the digital product reliably and accurately reflects the real world, and the results allow to derive not only correct but also helpful conclusions. Now is the time to embrace the unique chances by establishing professionalism in data science and engineering.

Authors

Peter Louis                               

Peter Louis is working at Siemens Advanta Consulting as Senior Key Expert. He has 25 years’ experience in Project Management, Quality Management, Software Engineering, Statistical Process Control, and various process frameworks (Lean, Agile, CMMI). He is an expert on SPC, KPI systems, data analytics, prediction modelling, and Six Sigma Black Belt.


Ralf Russ    

Ralf Russ works as a Principal Key Expert at Siemens Advanta Consulting. He has more than two decades experience rolling out frameworks for development of industrial-grade high quality products, services, and solutions. He is Six Sigma Master Black Belt and passionate about process transparency, optimization, anomaly detection, and prediction modelling using statistics and data analytics.4


Six properties of modern Business Intelligence

Regardless of the industry in which you operate, you need information systems that evaluate your business data in order to provide you with a basis for decision-making. These systems are commonly referred to as so-called business intelligence (BI). In fact, most BI systems suffer from deficiencies that can be eliminated. In addition, modern BI can partially automate decisions and enable comprehensive analyzes with a high degree of flexibility in use.


Read this article in German:
“Sechs Eigenschaften einer modernen Business Intelligence“


Let us discuss the six characteristics that distinguish modern business intelligence, which mean taking technical tricks into account in detail, but always in the context of a great vision for your own company BI:

1. Uniform database of high quality

Every managing director certainly knows the situation that his managers do not agree on how many costs and revenues actually arise in detail and what the margins per category look like. And if they do, this information is often only available months too late.

Every company has to make hundreds or even thousands of decisions at the operational level every day, which can be made much more well-founded if there is good information and thus increase sales and save costs. However, there are many source systems from the company’s internal IT system landscape as well as other external data sources. The gathering and consolidation of information often takes up entire groups of employees and offers plenty of room for human error.

A system that provides at least the most relevant data for business management at the right time and in good quality in a trusted data zone as a single source of truth (SPOT). SPOT is the core of modern business intelligence.

In addition, other data on BI may also be made available which can be useful for qualified analysts and data scientists. For all decision-makers, the particularly trustworthy zone is the one through which all decision-makers across the company can synchronize.

2. Flexible use by different stakeholders

Even if all employees across the company should be able to access central, trustworthy data, with a clever architecture this does not exclude that each department receives its own views of this data. Many BI systems fail due to company-wide inacceptance because certain departments or technically defined employee groups are largely excluded from BI.

Modern BI systems enable views and the necessary data integration for all stakeholders in the company who rely on information and benefit equally from the SPOT approach.

3. Efficient ways to expand (time to market)

The core users of a BI system are particularly dissatisfied when the expansion or partial redesign of the information system requires too much of patience. Historically grown, incorrectly designed and not particularly adaptable BI systems often employ a whole team of IT staff and tickets with requests for change requests.

Good BI is a service for stakeholders with a short time to market. The correct design, selection of software and the implementation of data flows / models ensures significantly shorter development and implementation times for improvements and new features.

Furthermore, it is not only the technology that is decisive, but also the choice of organizational form, including the design of roles and responsibilities – from the technical system connection to data preparation, pre-analysis and support for the end users.

4. Integrated skills for Data Science and AI

Business intelligence and data science are often viewed and managed separately from each other. Firstly, because data scientists are often unmotivated to work with – from their point of view – boring data models and prepared data. On the other hand, because BI is usually already established as a traditional system in the company, despite the many problems that BI still has today.

Data science, often referred to as advanced analytics, deals with deep immersion in data using exploratory statistics and methods of data mining (unsupervised machine learning) as well as predictive analytics (supervised machine learning). Deep learning is a sub-area of ​​machine learning and is used for data mining or predictive analytics. Machine learning is a sub-area of ​​artificial intelligence (AI).

In the future, BI and data science or AI will continue to grow together, because at the latest after going live, the prediction models flow back into business intelligence. BI will probably develop into ABI (Artificial Business Intelligence). However, many companies are already using data mining and predictive analytics in the company, using uniform or different platforms with or without BI integration.

Modern BI systems also offer data scientists a platform to access high-quality and more granular raw data.

5. Sufficiently high performance

Most readers of these six points will probably have had experience with slow BI before. It takes several minutes to load a daily report to be used in many classic BI systems. If loading a dashboard can be combined with a little coffee break, it may still be acceptable for certain reports from time to time. At the latest, however, with frequent use, long loading times and unreliable reports are no longer acceptable.

One reason for poor performance is the hardware, which can be almost linearly scaled to higher data volumes and more analysis complexity using cloud systems. The use of cloud also enables the modular separation of storage and computing power from data and applications and is therefore generally recommended, but not necessarily the right choice for all companies.

In fact, performance is not only dependent on the hardware, the right choice of software and the right choice of design for data models and data flows also play a crucial role. Because while hardware can be changed or upgraded relatively easily, changing the architecture is associated with much more effort and BI competence. Unsuitable data models or data flows will certainly bring the latest hardware to its knees in its maximum configuration.

6. Cost-effective use and conclusion

Professional cloud systems that can be used for BI systems offer total cost calculators, such as Microsoft Azure, Amazon Web Services and Google Cloud. With these computers – with instruction from an experienced BI expert – not only can costs for the use of hardware be estimated, but ideas for cost optimization can also be calculated. Nevertheless, the cloud is still not the right solution for every company and classic calculations for on-premise solutions are necessary.

Incidentally, cost efficiency can also be increased with a good selection of the right software. Because proprietary solutions are tied to different license models and can only be compared using application scenarios. Apart from that, there are also good open source solutions that can be used largely free of charge and can be used for many applications without compromises.

However, it is wrong to assess the cost of a BI only according to its hardware and software costs. A significant part of cost efficiency is complementary to the aspects for the performance of the BI system, because suboptimal architectures work wastefully and require more expensive hardware than neatly coordinated architectures. The production of the central data supply in adequate quality can save many unnecessary processes of data preparation and many flexible analysis options also make redundant systems unnecessary and lead to indirect savings.

In any case, a BI for companies with many operational processes is always cheaper than no BI. However, if you take a closer look with BI expertise, cost efficiency is often possible.

From BI to PI: The Next Step in the Evolution of Data-Driven Decisions

“Change is a constant.” “The pace of change is accelerating.” “The world is increasingly complex, and businesses have to keep up.” Organizations of all shapes and sizes have heard these ideas over and over—perhaps too often! However, the truth remains that adaptation is crucial to a successful business.


Read this article in German: Von der Datenanalyse zur Prozessverbesserung: So gelingt eine erfolgreiche Process-Mining-Initiative


Of course, the only way to ensure that the decisions you make are evolving in the right way is to understand the underlying building blocks of your organization. You can think of it as DNA; the business processes that underpin the way you work and combine to create a single unified whole. Knowing how those processes operate, and where the opportunities for improvement lie, can be the difference between success and failure.

Businesses with an eye on their growth understand this already. In the past, Business Intelligence was seen as the solution to this challenge. In more recent times, forward-thinking organizations see the need for monitoring solutions that can keep up with today’s rate of change, at the same time as they recognize that increasing complexity within business processes means traditional methods are no longer sufficient.

Adapting to a changing environment? The challenges of BI

Business Intelligence itself is not necessarily defunct or obsolete. However, the tools and solutions that enable Business Intelligence face a range of challenges in a fast-paced and constantly changing world. Some of these issues may include:

  • High data latency – Data latency refers to how long it takes for a business user to retrieve data from, for example, a business intelligence dashboard. In many cases, this can take more than 24 hours, a critical time period when businesses are attempting to take advantage of opportunities that may have a limited timeframe.
  • Incomplete data sets – The broad approach of Business Intelligence means investigations may run wide but not deep. This increases the chances that data will be missed, especially in instances where the tools themselves make the parameters for investigations difficult to change.
  • Discovery, not analysis – Business intelligence tools are primarily optimized for exploration, with a focus on actually finding data that may be useful to their users. Often, this is where the tools stop, offering no simple way for users to actually analyze the data, and therefore reducing the possibility of finding actionable insights.
  • Limited scalability – In general, Business Intelligence remains an arena for specialists and experts, leaving a gap in understanding for operational staff. Without a wide appreciation for processes and their analysis within an organization, the opportunities to increase the application of a particular Business Intelligence tool will be limited.
  • Unconnected metrics – Business Intelligence can be significantly restricted in its capacity to support positive change within a business through the use of metrics that are not connected to the business context. This makes it difficult for users to interpret and understand the results of an investigation, and apply these results to a useful purpose within their organization.

Process Intelligence: the next evolutionary step

To ensure companies can work efficiently and make the best decisions, a more effective method of process discovery is needed. Process Intelligence (PI) provides the critical background to answer questions that cannot be answered with Business Intelligence tools.

Process Intelligence offers visualization of end-to-end process sequences using raw data, and the right Process Intelligence tool means analysis of that raw data can be conducted straight away, so that processes are displayed accurately. The end-user is free to view and work with this accurate information as they please, without the need to do a preselection for the analysis.

By comparison, because Business Intelligence requires predefined analysis criteria, only once the criteria are defined can BI be truly useful. Organizations can avoid delayed analysis by using Process Intelligence to identify the root causes of process problems, then selecting the right criteria to determine the analysis framework.

Then, you can analyze your system processes and see the gaps and variants between the intended business process and what you actually have. And of course, the faster you discover what you have, the faster you can apply the changes that will make a difference in your business.

In short, Business Intelligence is suitable for gaining a broad understanding of the way a business usually functions. For some businesses, this will be sufficient. For others, an overview is not enough.

They understand that true insights lie in the detail, and are looking for a way of drilling down into exactly how each process within their organization actually works. Software that combines process discovery, process analysis, and conformance checking is the answer.

The right Process Intelligence tools means you will be able to automatically mine process models from the different IT systems operating within your business, as well as continuously monitor your end-to-end processes for insights into potential risks and ongoing improvement opportunities. All of this is in service of a collaborative approach to process improvement, which will lead to a game-changing understanding of how your business works, and how it can work better.

Early humans evolved from more primitive ancestors, and in the process, learned to use more and more sophisticated tools. For the modern human, working in a complex organization, the right tool is Process Intelligence.

Endless Potential with Signavio Process Intelligence

Signavio Process Intelligence allows you to unearth the truth about your processes and make better decisions based on true evidence found in your organization’s IT systems. Get a complete end-to-end perspective and understanding of exactly what is happening in your organization in a matter of weeks.

As part of Signavio Business Transformation Suite, Signavio Process Intelligence integrates perfectly with Signavio Process Manager and is accessible from the Signavio Collaboration Hub. As an entirely cloud-based process mining solution, the tool makes it easy to collaborate with colleagues from all over the world and harness the wisdom of the crowd.

Find out more about Signavio Process Intelligence, and see how it can help your organization generate more ideas, save time and money, and optimize processes.