Geschriebene Artikel über Big Data Analytics

How Healthcare Is Cracking Down on Data Privacy

The COVID-19 pandemic emerged more than a year ago, and come March, the United States will also pass the one-year anniversary of the novel coronavirus’ arrival in our nation. Hospitals have become overrun with patients, having to adjust for space even when they’re at full capacity. The colder months are bringing on more infections as well.

With such high demands on health care providers, technology has been an area of assistance through it all. Telehealth in particular allows patients to stay at home and receive care without putting themselves at risk. However, security and privacy concerns accompany this reliance on technology.

The digital world can be dangerous. Hacks and breaches can occur at any time. The novel coronavirus pandemic has accelerated these attacks. Through August 2020 alone, 305 healthcare data breaches occurred — which is up from 2019’s 136 breaches in the same time frame. These vulnerabilities cannot continue to occur, since health care facilities hold vital patient information like Social Security numbers, medical records and financial information.

The industry is resilient, though. Adapting to new norms and protocols is part of the healthcare field. With the new focus on technology to connect patients and providers through the ongoing pandemic, practices have been cracking down on keeping data safe and secure.

Health Care Industry Adapts

Data presents itself in the health care industry in several ways. Standard patient data includes personal information about health history, relationships and private matters. Other forms of data may include connections from medical devices that use the internet — something like a digital blood pressure monitor may transmit data. Then, providers must store and send this data at various times.

The Health Insurance Portability and Accountability Act sets forth two main regulations facilities must follow. The security rule mandates that the use of all electronic personal health data must be stable in any form or use. The privacy rule indicates that all medical records, insurance information and private data must have the best protection.

In 2017, 477 breaches affected about 5.6 million patient records, breaching what should have been secure HIPAA data. To uphold HIPAA regulations and prevent breaches like these from happening, health care providers have taken several steps.

First, education is crucial. Bringing all staff in on up-to-date privacy protocols will go a long way. For instance, using encryption on mobile devices, backing up all data, creating strong passwords and consistently patching and updating the systems and firewalls are critical for staff to understand.

Access is another form of protection. Multi-factor authentication, like passwords, keys, PINs and biometrics, will keep systems secure and only give access to those who need it the most. Then, facilities can monitor data at all times — unauthorized access, emails and transfers. If something suspicious happens, IT departments can see it in real time and flag it or stop it.

Last, consistent evaluations are more necessary than ever. Health care facilities will want to make sure they comply with industry and privacy requirements, and that staff members know the protocols to follow. Then, data privacy remains a top priority.

The Lasting Impact

Vaccines are slowly rolling out and becoming more available to residents across the world. However, even with a vaccine, global spread will slow gradually, especially in areas where cases are high and rising. For instance, the United States cases are still rising and breaking records daily.

Data will continue to be a central focus throughout the pandemic and afterward. Right now, specifically, with big tech companies facing scrutiny and investigations for privacy faults, data is at the forefront of Americans’ minds. Health care companies must excel in ways that big tech has not.

One sign of progress is new mental health startups popping up that focus on virtual dynamics. With services like Real Therapy or Two Chairs, you can make a virtual appointment. Since privacy is already an inherent part of therapy, data privacy will be critical to integrate into these business models.

Getting Ahead of the Curve

While the pandemic may seem uncontrollable at times, health care facilities have more agency. They can smooth relationships with patients and operate more efficiently with stricter data privacy protocols in place. In an uncertain time, ensuring data security is one of the best things health care providers can do.

Turbocharge Business Analytics With In-memory Computing

One of the customer traits that’s been gradually diminishing through the years is patience; if a customer-facing website or application doesn’t deliver real-time or near-instant results, it can be a reason for a customer to look elsewhere. This trend has pushed companies to turn to in-memory computing to get the speed needed to address customer demands in real-time. It simplifies access to multiple data sources to provide super-fast performance that’s thousands of times faster than disk-based storage systems. By storing data in RAM and processing in parallel against the full dataset, in-memory computing solutions allow for real-time insights that lead to informed business decisions and improved performance.

The in-memory computing solutions market has been on the rise in recent years because it has been heralded as the platform that will accelerate IT modernization. In-memory data grids, in particular, show great promise because it addresses the main limitation of an in-memory relational database. While the latter is designed to scale up, the former is designed to scale out. This scalability is one of the main draws of an in-memory data grid, since a scale-up architecture is not sustainable in the long term and will always have a breaking point. In-memory data grids on the other hand, benefit from horizontal scalability and computing elasticity. Scaling an in-memory data grid is as simple as adding nodes to a cluster and removing it when it’s no longer needed. This is especially useful for businesses that demand speed in the management of hundreds of terabytes of data across multiple networked computers in geographically distributed data centers.

Since big data is complex and fast-moving, keeping data synchronized across data centers is vital to preserve data integrity. Keeping data in memory removes the bottleneck caused by constant access to disk -based storage and allows applications and their data to collocate in the same memory space. This allows for optimization that allows the amount of data to exceed the amount of available memory. Speed and efficiency is also improved by keeping frequently accessed data in memory and the rest on disk, consequently allowing data to reside both in memory and on disk.

Future-proofing Businesses With In-memory Computing

Data analytics is as much a part of every business as other marketing and business intelligence tools. Because data constantly grows at an exponential rate, in-memory computing serves as the enabler of data analytics because it provides speed, high availability, and straightforward scalability. Speeds more than 100 times faster than other solutions enable in-memory computing solutions to provide real-time insights that are applicable in a host of industries and use cases.

Location-based Marketing

A report from 2019 shows that location-based marketing helped 89% of marketers increase sales, 86% grow their customer base, and 84% improve customer engagement. Location data can be leveraged to identify patterns of behavior by analyzing frequently visited locations. By understanding why certain customers frequent specific locations and knowing when they are there, you can better target your marketing messages and make more strategic customer acquisitions. Location data can also be used as a demographic identifier to help you segment your customers and tailor your offers and messaging accordingly.

Fraud Detection

In-memory computing helps improve operational intelligence by detecting anomalies in transaction data immediately. Through high-speed analysis of large amounts of data, potential risks are detected early on and addressed as soon as possible. Transaction data is fast-moving and changes frequently, and in-memory computing is equipped to handle data as it changes. This is why it’s an ideal platform for payment processing; it helps make comparisons of current transactions with the history of all transactions on record in a matter of seconds. Companies typically have several fraud detection measures in place, and in-memory computing allows running these algorithms concurrently without compromising overall system performance. This ensures responsiveness of systems despite peak volume levels and avoids interruptions to customer service.

Tailored Customer Experiences

The real-time insights delivered by in-memory computing helps personalize experiences based on customer data. Because customer experiences are time-sensitive, processing and analyzing data at super-fast speeds is vital in capturing real-time event data that can be used to craft the best experience possible for each customer. Without in-memory computing, getting real-time data and other necessary information that ensures a seamless customer experience would have been near impossible.

Real-time data analytics helps provide personalized recommendations based on both existing and new customer data. By looking at historical data like previously visited pages and comparing them with newer data from the stream, businesses can craft the proper messaging and plan the next course of action. The anticipation and forecasting of customers’ future actions and behavior is the key to improving conversion rates and customer satisfaction—ultimately leading to higher revenues and more loyal customers.

Conclusion

Big data is the future, and companies that don’t use it to their advantage would find it hard to compete in this ever-connected world that demands results in an instant. Processing and analyzing data can only become more complex and challenging through time, and for this reason, in-memory computing should be a solution that companies should consider. Aside from improving their business from within, it will also help drive customer acquisition and revenue, while also providing a viable low-latency, high throughput platform for high-speed data analytics.

Web Scraping Using R..!

In this blog, I’ll show you, How to Web Scrape using R..?

What is R..?

R is a programming language and its environment built for statistical analysis, graphical representation & reporting. R programming is mostly preferred by statisticians, data miners, and software programmers who want to develop statistical software.

R is also available as Free Software under the terms of the Free Software Foundation’s GNU General Public License in source code form.

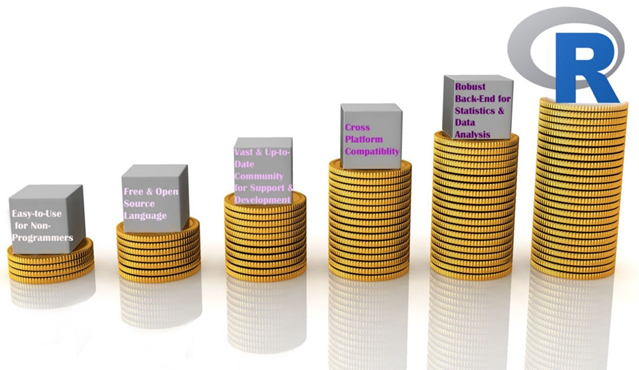
Reasons to choose R

Reasons to choose R

Let’s begin our topic of Web Scraping using R.

Step 1- Select the website & the data you want to scrape.

I picked this website “https://www.alexa.com/topsites/countries/IN” and want to scrape data of Top 50 sites in India.

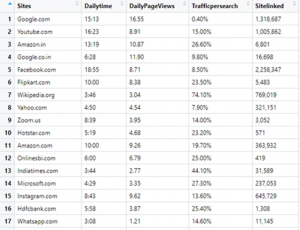
Data we want to scrape

Data we want to scrape

Step 2- Get to know the HTML tags using SelectorGadget.

In my previous blog, I already discussed how to inspect & find the proper HTML tags. So, now I’ll explain an easier way to get the HTML tags.

You have to go to Google chrome extension (chrome://extensions) & search SelectorGadget. Add it to your browser, it’s a quite good CSS selector.

Step 3- R Code

Evoking Important Libraries or Packages

I’m using RVEST package to scrape the data from the webpage; it is inspired by libraries like Beautiful Soup. If you didn’t install the package yet, then follow the code in the snippet below.

Step 4- Set the url of the website

Step 5- Find the HTML tags using SelectorGadget

It’s quite easy to find the proper HTML tags in which your data is present.

Firstly, I have to click on data using SelectorGadget which I want to scrape, it automatically selects the data which are similar to selected HTML tags. Before going forward, cross-check the selected values, are they correct or some junk data is also gets selected..? If you noticed our page has only 50 values, but you can see 156 values are selected.

Selection by SelectorGadget

Selection by SelectorGadget

So I need to remove unwanted values who get selected, once you click on them to deselect it, it turns red and others will turn yellow except our primary selection which turn to green. Now you can see only 50 values are selected as per our primary requirement but it’s not enough. I have to again cross-check that some required values are not exchanged with junk values.

If we satisfy with our selection then copy the HTML tag & include it into the code, else repeat this exercise.

Modified Selection by SelectorGadget

Step 6- Include the tag in our Code

After including the tags, our code is like this.

Code Snippet

If I run the code, values in each list object will be 50.

Data Stored in List Objects

Step 7- Creating DataFrame

Now, we create a dataframe with our list-objects. So for creating a dataframe, we always need to remember one thumb rule that is the number of rows (length of all the lists) should be equal, else we get an error.

Error appears when number of rows differs

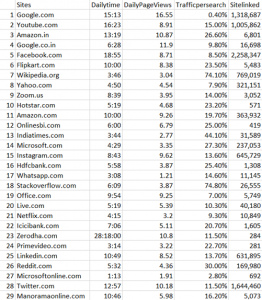
Finally, Our DataFrame will look like this:

Our Final Data

Step 8- Writing our DataFrame to CSV file

We need our scraped data to be available locally for further analysis & model building or other purposes.

Our final piece of code to write it in CSV file is:

Writing to CSV file

Step 9- Check the CSV file

Data written in CSV file

Conclusion-

I tried to explain Web Scraping using R in a simple way, Hope this will help you in understanding it better.

Find full code on

https://github.com/vgyaan/Alexa/blob/master/webscrap.R

If you have any questions about the code or web scraping in general, reach out to me on LinkedIn!

Okay, we will meet again with the new exposer.

Till then,

Happy Coding..!

Determining Your Data Pipeline Architecture and Its Efficacy

Data analytics has become a central part of how many businesses operate. If you hope to stay competitive in today’s market, you need to take advantage of all your available data. For that, you’ll need an efficient data pipeline, which is often easier said than done.

If your pipeline is too slow, your data will be all but useless by the time it’s usable. Successful analytics require an optimized pipeline, and that looks different for every company. No matter your specific circumstances, though, a traditional approach will result in inefficiencies.

Creating the most efficient pipeline architecture will require you to change how you look at the process. By understanding each stage’s role and how they serve your goals, you can optimize your data analytics.

Understanding Your Data Needs

You can’t build an optimal data pipeline if you don’t know what you need from your data. If you spend too much time collecting and organizing information you won’t use, you’ll take time away from what you need. Similarly, if you only work to meet one team’s needs, you’ll have to go back and start over to help others.

Data analytics involves multiple stakeholders, all with individual needs and expectations that you should consider. Your data engineers need your pipeline to be accessible and scalable, while analysts require visual, relevant datasets. If you consider these aspects from the beginning, you can build a pipeline that works for everyone.

Start at the earliest stage — collection. You may be collecting data from every channel you can, which could result in an information overload. Focus instead on gathering things from the most relevant sources. At the same time, ensure you can add more channels if necessary in the future.

As you reorganize your pipeline, remember that analytics are only as good as your datasets. If you put more effort into organizing and scrubbing data, helpful analytics will follow. Focus on preparing data well, and the last few stages will be smoother.

Creating a Collaborative Pipeline

When structuring your pipeline, it’s easy to focus too much on the individual stages. While seeing things as rigid steps can help you visualize them, you need something more fluid in practice. If you want the process to run as smoothly as possible, it needs to be collaborative.

Look at the software development practice of DevOps, which doubles a team’s likelihood of exceeding productivity goals. This strategy focuses on collaboration across separate teams instead of passing things back and forth between them. You can do the same thing with your data pipeline.

Instead of dividing steps between engineers and analysts, make it a single, cohesive process. Teams will still focus on different areas according to their expertise, but they’ll reduce disruption by working together instead of independently. If workers can collaborate along every step, they don’t have to go back and forth.

Simultaneously, everyone should have clearly defined responsibilities. Collaboration doesn’t mean overstepping your areas of expertise. The goal here isn’t to make everyone handle everything but to ensure they understand each other’s needs.

Eliminating the time between steps also applies to your platform. Look for or build software that integrates both refinement and data preparation. If you have to export data to various programs, it will cause unnecessary bottlenecks.

Enabling Continuous Improvement

Finally, understand that restructuring your data pipeline isn’t a one-and-done job. Another principle you can adopt from DevOps is continuous development across all sides of the process. Your engineers should keep looking for better ways to structure data as your analysts search for new applications for this information.

Make sure you always measure your throughput and efficiency. If you tweak something and you notice the process starts to slow, revert to the older method. If your changes improve the pipeline, try something similar in another area.

Optimize Your Data Pipeline

Remember to start slow when optimizing your data pipeline. Changing too much at once can cause more disruptions than it avoids, so start small with an emphasis on scalability.

The specifics of your pipeline will vary depending on your needs and circumstances. No matter what these are, though, you can benefit from collaboration and continuous development. When you start breaking down barriers between different steps and teams, you unclog your pipeline.

Bias and Variance in Machine Learning

Machine learning continues to be an ever more vital component of our lives and ecosystem, whether we’re applying the techniques to answer research or business problems or in some cases even predicting the future. Machine learning models need to give accurate predictions in order to create real value for a given industry or domain.

While training a model is one of the key steps in the Data Science Project Life Cycle, how the model generalizes on unseen data is an equally important aspect that should be considered in every Data Science Project Life Cycle. We need to know whether it works and, consequently, if we can trust its predictions. Could the model be merely memorizing the data it is fed with, and therefore unable to make good predictions on future samples, or samples that it hasn’t seen before?

Let’s know the importance of evaluation with a simple example, There are two student’s Ramesh and Suresh preparing for the CAT exam to get into top IIMs (Indian Institute of Management). They both are quite good friends and stayed in the room during preparation and put an equal amount of hard work while solving numerical problems.

They both prepared for almost the same number of hours for the entire year and appeared in the final CAT exam. Surprisingly, Ramesh cleared, but Suresh did not. When asked, we got to know that there was one difference in their strategy of preparation between them, Ramesh had joined a Test Series course where he used to test his knowledge and understanding by giving mock exams and then further evaluating on which portions he is lagging and making necessary adjustments to he is preparation cycle in order to do well in those areas. But Suresh was confident, and he just kept training himself without testing on the preparation he had done.

Like the above situation we can train a Machine Learning Algorithm extensively with many parameters and new techniques, but if you are skipping its evaluation step, you cannot trust your model to perform well on the unseen data. In this article, we explain the importance of Bias, Variance and the trade-off between them in order to know how well a machine learning model generalizes to new, previously unseen data.

Training of Supervised Machine Learning

Bias

Bias is the difference between the Predicted Value and the Expected Value or how far are the predicted values from the actual values. During the training process the model makes certain assumptions on the training data provided. After Training, when it is introduced to the testing/validation data or unseen data, these assumptions may not always be correct.

If we use a large number of nearest neighbors in the K-Nearest Neighbors Algorithm, the model can totally decide that some parameters are not important at all for the modelling.  For example, it can just consider that only two predictor variables are enough to classify the data point though we have more than 10 variables.

This type of model will make very strong assumptions about the other parameters not affecting the outcome at all. You can take it as a model predicting or understanding only the simple relationship when the data points clearly indicate a more complex relationship.

When the model has high bias error, it results in a very simplistic model that does not consider the complexity of the data very well leading to Underfitting.

Variance

Variance occurs when the model performs well on the trained dataset but does not do well on an unseen data set, it is when the model considers the fluctuations or i.e. the noise as in the data as well. The model will still consider the variance as something to learn from because it learns too much from the noise inside the trained data set that it fails to perform as expected on the unseen data.

Based on the above example from Bias, if the model learns that all the ten predictor variables are important to classify a given data point then it tends to have high variance. You can take it as the model is trying to understand every minute detail making it more complex and failing to perform well on the unseen data.

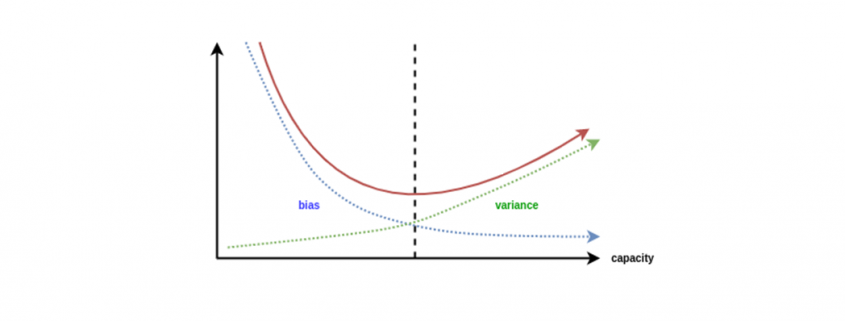
When a model has High Bias error, it underfits the data and makes very simplistic assumptions on it. When a model has High Variance error, it overfits the data and learns too much from it. When a model has balanced Bias and Variance errors, it performs well on the unseen data.

Bias-Variance Trade-off

Based on the definitions of bias and variance, there is clear trade-off between bias and variance when it comes to the performance of the model. A model will have a high error if it has very high bias and low variance and have a high error if it has high variance and low bias.

A model that strikes a balance between the bias and variance can minimize the error better than those that live on extreme ends.

We can find whether the model has High Bias using the below steps:

  1. We tend to get high training errors.
  2. The validation error or test error will be similar to the training error.

We can find whether the model has High Bias using the below steps:

  1. We tend to get low training error
  2. The validation error or test error will be very high.

We can fix the High Bias using below steps:

  1. We need to gather more input features or can even try to create few using the feature engineering techniques.
  2. We can even add few polynomial features in order to increase the complexity.
  3. If we are using any regularization terms in our model, we can try to minimize it.

We can fix the High Variance using below steps:

  1. We can gather more training data so that the model can learn more on the patterns rather than the noise.
  2. We can even try to reduce the input features or do feature selection.
  3.  If we are using any regularization terms in our model we can try to maximize it.

Conclusion

In this article, we got to know the importance of the evaluation step in the Data Science Project Life Cycle, definitions of Bias and Variance, the trade-off between them and the steps we can take to fix the Underfitting and Overfitting of a Machine Learning Model.

Rethinking linear algebra: visualizing linear transformations and eigen vectors

In terms of calculation processes of Principal Component Analysis (PCA) or Linear Discriminant Analysis (LDA), which are the dimension reduction techniques I am going to explain in the following articles, diagonalization is what they are all about. Throughout this article, I would like you to have richer insight into diagonalization in order to prepare for understanding those basic dimension reduction techniques.

When our professor started a lecture on the last chapter of our textbook on linear algebra, he said “It is no exaggeration to say that everything we have studied is for this ‘diagonalization.'” Until then we had to write tons of numerical matrices and vectors all over our notebooks, calculating those products, adding their rows or columns to other rows or columns, sometimes transposing the matrices, calculating their determinants.

It was like the scene in “The Karate Kid,” where the protagonist finally understood the profound meaning behind the prolonged and boring “wax on, wax off” training given by Miyagi (or “jacket on, jacket off” training given by Jackie Chan). We had finally understood why we had been doing those seemingly endless calculations.

Source: http://thinkbedoleadership.com/secret-success-wax-wax-off/

But usually you can do those calculations easily with functions in the Numpy library. Unlike Japanese college freshmen, I bet you are too busy to reopen textbooks on linear algebra to refresh your mathematics. Thus I am going to provide less mathematical and more intuitive explanation of diagonalization in this article.

1, The mainstream ways of explaining diagonalization.

*The statements below are very rough for mathematical topics, but I am going to give priority to offering more visual understanding on linear algebra in this article. For further understanding, please refer to textbooks on linear algebra. If you would like to have minimum understandings on linear algebra needed for machine learning, I recommend the Appendix C of Pattern Recognition and Machine Learning by C. M. Bishop.

In most textbooks on linear algebra, the explanations on dioagonalization is like this (if you are not sure what diagonalization is or if you are allergic to mathematics, you do not have to read this seriously):

Let V (dimV = D)be a vector space and let  T_A : V \rightarrow V be a mapping of V into itself,  defined as T_A(v) = A \cdot \boldsymbol{v}, where A is a D\times D matrix and \boldsymbol{v} is D dimensional vector. An element \boldsymbol{v} \in V is called an eigen vector if there exists a number \lambda such that A \cdot \boldsymbol{v}= \lambda \cdot \boldsymbol{v} and \boldsymbol{v} \neq \boldsymbol{0}. In this case \lambda is uniquely determined and is called an eigen value of A belonging to the eigen vector \boldsymbol{v}.

Any matrix A has D eigen values \lambda_{i}, belonging to \boldsymbol{v}_{i} (i=1, 2, …., D). If \boldsymbol{v}_{i} is basis of the vector space V, then A is diagonalizable.

When A is diagonalizable, with D \times D matrices P = (\boldsymbol{v}_{1}, \dots, \boldsymbol{v}_{D}) , whose column vectors are eigen vectors \boldsymbol{v}_{i} (i=1, 2, …., D), the following equation holds: P^{-1}AP = \Lambda, where \Lambda = diag(\lambda_{1}, \dots, \lambda_{D})= \begin{pmatrix} \lambda_{1} & 0& \ldots &0\\ 0 & \lambda_{2} & \ldots & 0 \\ \vdots & \vdots & \ddots & \vdots \\ 0 & 0 & \ldots & \lambda_{D} \end{pmatrix}.

And when A is diagonalizable, you can diagonalize A as below.

Most textbooks keep explaining these type of stuff, but I have to say they lack efforts to make it understandable to readers with low mathematical literacy like me. Especially if you have to apply the idea to data science field, I believe you need more visual understanding of diagonalization. Therefore instead of just explaining the definitions and theorems, I would like to take a different approach. But in order to understand them in more intuitive ways, we first have to rethink waht linear transformation T_A means in more visible ways.

2, Linear transformations

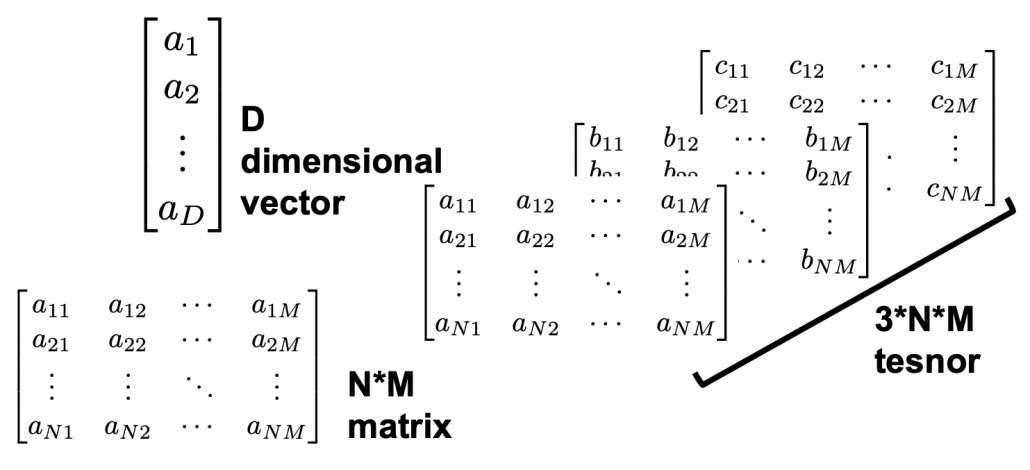
Even though I did my best to make this article understandable to as little prerequisite knowledge, you at least have to understand linear transformation of numerical vectors and with matrices. Linear transformation is nothing difficult, and in this article I am going to use only 2 or 3 dimensional numerical vectors or square matrices. You can calculate linear transformation of \boldsymbol{v} by A as equations in the figure. In other words, \boldsymbol{u} is a vector transformed by A.

*I am not going to use the term “linear transformation” in a precise way in the context of linear algebra. In this article or in the context of data science or machine learning, “linear transformation” for the most part means products of matrices or vectors. 

*Forward/back propagation of deep learning is mainly composed of this linear transformation. You keep linearly transforming input vectors, frequently transforming them with activation functions, which are for the most part not linear transformation.

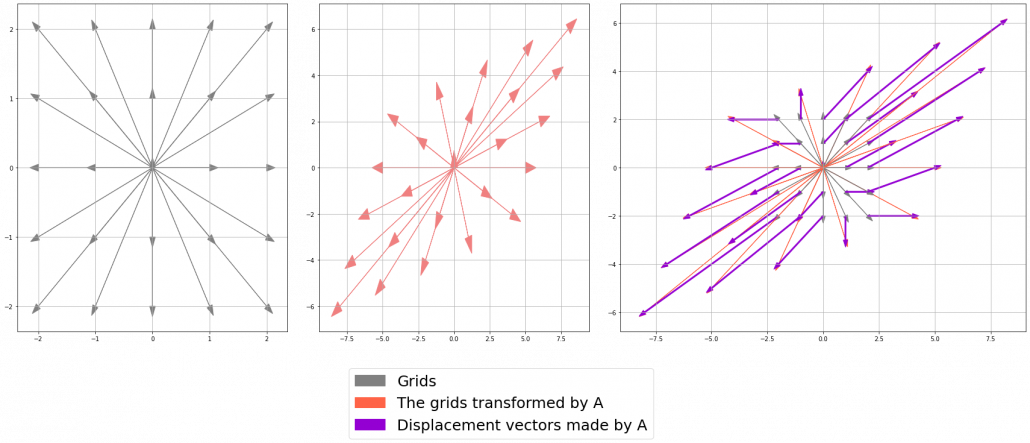
As you can see in the equations above, linear transformation with A transforms a vector to another vector. Assume that you have an original vector \boldsymbol{v} in grey and that the vector \boldsymbol{u} in pink is the transformed \boldsymbol{v} by A is. If you subtract \boldsymbol{v} from \boldsymbol{u}, you can get a displacement vector, which I displayed in purple. A displacement vector means the transition from a vector to another vector.
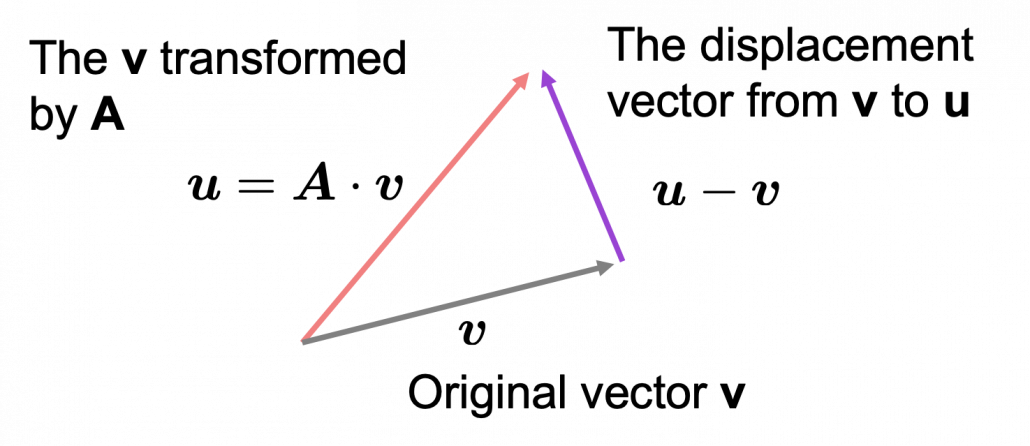
Let’s calculate the displacement vector with more vectors \boldsymbol{v}. Assume that A =\begin{pmatrix} 3 & 1 \\ 1 & 2 \end{pmatrix}, and I prepared several grid vectors \boldsymbol{v} in grey as you can see in the figure below. If you transform those grey grid points with A, they are mapped into the vectors \boldsymbol{u} in pink. With those vectors in grey or pink, you can calculate the their displacement vectors \boldsymbol{u} = \boldsymbol{v} in purple.

I think you noticed that the displacement vectors in the figure above have some tendencies. In order to see that more clearly, let’s calculate displacement vectors with several matrices A and more grid points. Assume that you have three 2 \times 2 square matrices A_1 =\begin{pmatrix} 3 & 1 \\ 1 & 2 \end{pmatrix}, A_2 =\begin{pmatrix} 3 & 1 \\ -1 & 1 \end{pmatrix}, A_3 =\begin{pmatrix} 1 & -1 \\ 1 & 1 \end{pmatrix}, and I plotted displace vectors made by the matrices respectively in the figure below.
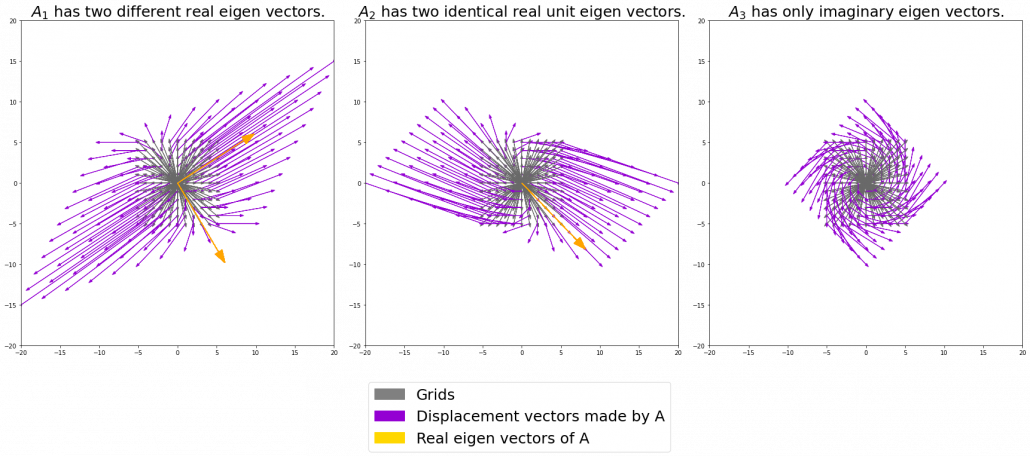
I think you noticed some characteristics of the displacement vectors made by those linear transformations: the vectors are swirling and many of them seem to be oriented in certain directions. To be exact, some displacement vectors have extend in the same directions as some of original vectors in grey. That means  linear transformation by A did not change the direction of the original vector \boldsymbol{v}, and the unchanged vectors are called eigen vectors. Real eigen vectors of each A are displayed as arrows in yellow in the figure above. But when it comes to A_3, the matrix does not have any real eigan values.

In linear algebra, depending on the type matrices A, you have consider various cases such as whether the matrices have real or imaginary eigen values, whether the matrices are diagonalizable, whether the eigen vectors are orthogonal, or whether they are unit vectors. But those topics are out of the scope of this article series, so please refer to textbooks on linear algebra if you are interested.

Luckily, however, in terms of PCA or LDA, you only have to consider a type of matrices named positive semidefinite matrices, which A_1 is classified to, and I am going to explain positive semidefinite matrices in the fourth section.

3, Eigen vectors as coordinate system

Source: Ian Stewart, “Professor Stewart’s Cabinet of Mathematical Curiosities,” (2008), Basic Books

Let me take Fibonacci numbers as an example to briefly see why diagonalization is useful. Fibonacci is sequence is quite simple and it is often explained using an example of pairs of rabbits increasing generation by generation. Let a_n (n=0, 1, 2, …) be the number of pairs of grown up rabbits in the n^{th} generation. One pair of grown up rabbits produce one pair of young rabbit The concrete values of a_n are a_0 = 0, a_1 = 1, a_2=1, a_3=2, a_4=3, a_5=5, a_6=8, a_7=13, \dots. Assume that A =\begin{pmatrix} 1 & 1 \\ 1 & 0 \end{pmatrix} and that \begin{pmatrix} a_1 \\ a_0  \end{pmatrix} =\begin{pmatrix} 1 \\ 0  \end{pmatrix}, then you can calculate the number of the pairs of grown up rabbits in the next generation with the following recurrence relation. \begin{pmatrix} a_{n+1} \\ a_{n}  \end{pmatrix}=\begin{pmatrix} 1 & 1 \\ 1 & 0 \end{pmatrix} \cdot \begin{pmatrix} a_{n+1} \\ a_{n}  \end{pmatrix}.Let \boldsymbol{a}_n be \begin{pmatrix} a_{n+1} \\ a_{n}  \end{pmatrix}, then the recurrence relation can be written as \boldsymbol{a}_{n+1} = A \boldsymbol{a}_n, and the transition of \boldsymbol{a}_n are like purple arrows in the figure below. It seems that the changes of the purple arrows are irregular if you look at the plots in normal coordinate.
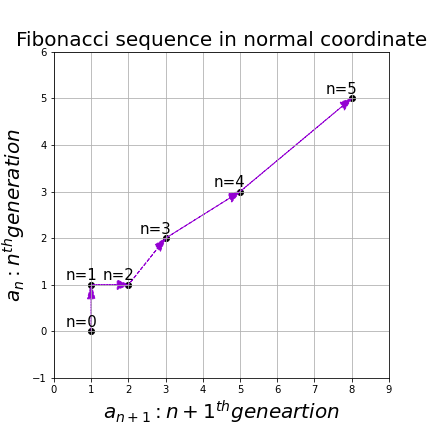
Assume that \lambda _1, \lambda_2 (\lambda _1< \lambda_2) are eigen values of A, and \boldsymbol{v}_1, \boldsymbol{v}_2 are eigen vectors belonging to them respectively. Also let \alpha, \beta scalars such that \begin{pmatrix} a_{1} \\ a_{0}  \end{pmatrix} = \begin{pmatrix} 1 \\ 0  \end{pmatrix} = \alpha \boldsymbol{v}_1 + \beta \boldsymbol{v}_2. According to the definition of eigen values and eigen vectors belonging to them, the following two equations hold: A\boldsymbol{v}_1 = \lambda_1 \boldsymbol{v}_1, A\boldsymbol{v}_2 = \lambda_2 \boldsymbol{v}_2. If you calculate \boldsymbol{a}_1 is, using eigen vectors of A, \boldsymbol{a}_1  = A\boldsymbol{a}_0 = A (\alpha \boldsymbol{v}_1 + \beta \boldsymbol{v}_2) = \alpha\lambda _1 \boldsymbol{v}_1 + \beta \lambda_2 \boldsymbol{v}_2. In the same way, \boldsymbol{a}_2 = A\boldsymbol{a}_1 = A (\alpha\lambda _1 \boldsymbol{v}_1 + \beta \lambda_2 \boldsymbol{v}_2) = \alpha\lambda _{1}^{2} \boldsymbol{v}_1 + \beta \lambda_{2}^{2} \boldsymbol{v}_2, and \boldsymbol{a}_3 = A\boldsymbol{a}_2 = A (\alpha\lambda _{1}^{2} \boldsymbol{v}_1 + \beta \lambda_{2}^{2} \boldsymbol{v}_2) = \alpha\lambda _{1}^{3} \boldsymbol{v}_1 + \beta \lambda_{2}^{3} \boldsymbol{v}_2. These equations show that in coordinate system made by eigen vectors of A, linear transformation by A is easily done by just multiplying eigen values with each eigen vector. Compared to the graph of Fibonacci numbers above, in the figure below you can see that in coordinate system made by eigen vectors the plots changes more systematically generation by generation.
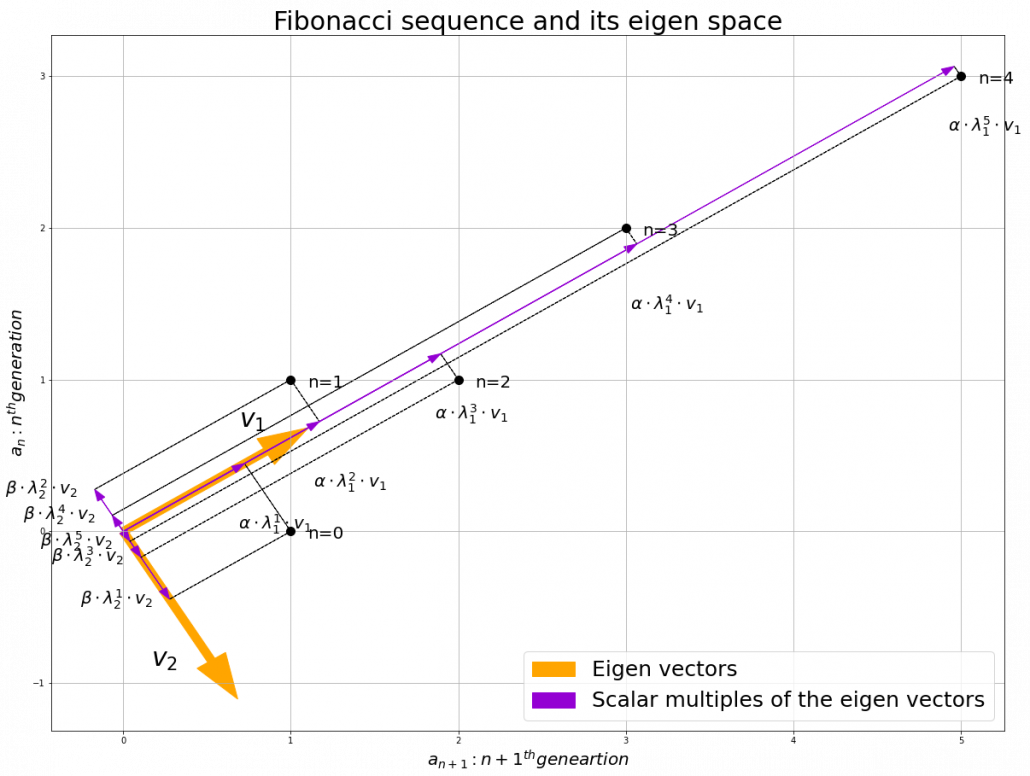
 

In coordinate system made by eigen vectors of square matrices, the linear transformations by the matrices can be much more straightforward, and this is one powerful strength of eigen vectors.

*I do not major in mathematics, so I am not 100% sure, but vectors in linear algebra have more abstract meanings and various things in mathematics can be vectors, even though in machine learning or data science we  mainly use numerical vectors with more concrete elements. We can also say that matrices are a kind of maps. That is just like, at leas in my impression, even though a real town is composed of various components such as houses, smooth or bumpy roads, you can simplify its structure with simple orthogonal lines, like the map of Manhattan. But if you know what the town actually looks like, you do not have to follow the zigzag path on the map.

4, Eigen vectors of positive semidefinite matrices

In the second section of this article I told you that, even though you have to consider various elements when you discuss general diagonalization, in terms of PCA and LDA we mainly use only a type of matrices named positive semidefinite matrices. Let A be a D \times D square matrix. If \boldsymbol{x}^T A \boldsymbol{x} \geq 0 for all values of the vector \boldsymbol{x}, the A is said to be a positive semidefinite matrix. And also it is known that A being a semidefinite matrix is equivalent to \lambda _{i} \geq 0 for all the eigen values \lambda_i (i=1, \dots , D).

*I think most people first learn a type of matrices called positive definite matrices. Let A be aD \times D square matrix. If \boldsymbol{x}^T A \boldsymbol{x} > 0 for all values of the vector \boldsymbol{x}, the A is said to be a positive definite matrix. You have to keep it in mind that even if all the elements of A are positive, A is not necessarly positive definite/semidefinite.

Just as we did in the second section of this article, let’s visualize displacement vectors made by linear transformation with a 3 \times 3 square positive semidefinite matrix A.

*In fact A_1 =\begin{pmatrix} 3 & 1 \\ 1 & 2 \end{pmatrix}, whose linear transformation I visualized the second section, is also positive semidefinite.

Let’s visualize linear transformations by a positive definite matrix A = \frac{1}{50} \begin{pmatrix} 60.45 &  33.63 & 46.29 \\33.63 & 68.49 & 50.93 \\ 46.29 & 50.93 & 53.61 \end{pmatrix}. I visualized the displacement vectors made by the A just as the same way as in the second section of this article. The result is as below, and you can see that, as well as the displacement vectors made by A_1, the three dimensional displacement vectors below are swirling and extending in three directions, in the directions of the three orthogonal eigen vectors \boldsymbol{v}_1, \boldsymbol{v}_2, and \boldsymbol{v}_3.

*It might seem like a weird choice of a matrix, but you are going to see why in the next article.
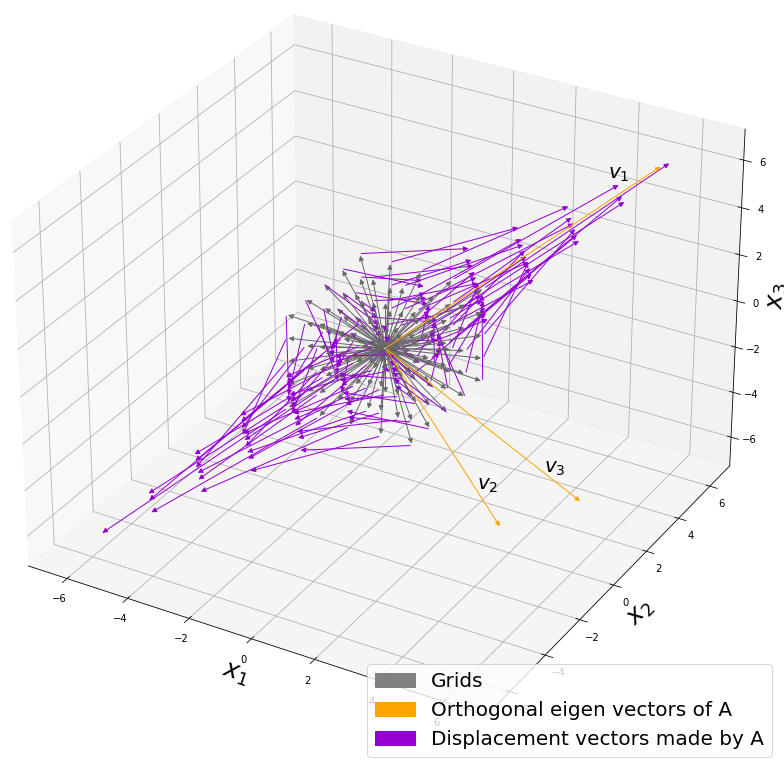
You might have already noticed A_1 =\begin{pmatrix} 3 & 1 \\ 1 & 2 \end{pmatrix} and A = \frac{1}{50} \begin{pmatrix} 60.45 &  33.63 & 46.29 \\33.63 & 68.49 & 50.93 \\ 46.29 & 50.93 & 53.61 \end{pmatrix} are both symmetric matrices and that their elements are all real values, and that their diagonal elements are all positive values. Super importantly, when all the elements of a D \times D symmetric matrix A are real values and its eigen values are \lambda_{i} (i=1, \dots , D), there exist orthonormal matrices U such that U^{-1}AU = \Lambda, where \Lambda = diag(\lambda_{1}, \dots , \lambda_{D}).

*The title of this section might be misleading, but please keep it in mind that positive definite/semidefinite matrices are not necessarily real symmetric matrices. And real symmetric vectors are not necessarily positive definite/semidefinite matrices.

5, Orthonormal matrices and rotation of vectors

In this section I am gong to explain orthonormal matrices, as known as rotation matrices. If a D\times D matrix U is an orthonormal matrix, column vectors of U are orthonormal, which means U = (\boldsymbol{u}_1 \dots \boldsymbol{u}_D), where \begin{cases} \boldsymbol{u}_{i}^{T}\boldsymbol{u}_{j} = 1 \quad (i = j) \\ \boldsymbol{u}_{i}^{T}\boldsymbol{u}_{j} = 0 \quad (i\neq j) \end{cases}. In other words column vectors \boldsymbol{u}_{i} form an orthonormal coordinate system.

Orthonormal matrices U have several important matrices, and one of them is U^{-1} = U^{T}. Combining this fact with what I have told you so far, you we can reach one conclusion that you can orthogonalize a real symmetric matrix A as U^{T}AU = \Lambda. This is known as spectral decomposition or singular value decomposition.

Another important property of U is that U^{T} is also orthonormal. In other words, assume U is orthonormal and that U = (\boldsymbol{u}_1 \dots \boldsymbol{u}_D) = \begin{pmatrix} -\boldsymbol{v_1}^{T}- \\ \vdots \\ -\boldsymbol{v_D}^{T}- \end{pmatrix}, (\boldsymbol{v}_1 \dots \boldsymbol{v}_D) also forms a orthonormal coordinate system.

…It seems things are getting too mathematical and abstract (for me), thus for now I am going to wrap up what I have explained in this article .

We have seen

  • Numerical matrices linearly transform vectors.
  • Certain linear transformations do not change the direction of vectors in certain directions, which are called eigen vectors.
  • Making use of eigen vectors, you can form new coordinate system which can describe the linear transformations in a more straightforward way.
  • You can diagonalize a real symmetric matrix A with an orthonormal matrix U.

Of our current interest is what kind of linear transformation the real symmetric positive definite matrix enables. I am going to explain why the purple vectors in the figure above is swirling like that in the upcoming articles. Before that, however, we are going to  see one application of what we have seen in this article, on dimension reduction. To be concrete the next article is going to be about principal component analysis (PCA), which is very important in many fields.

*In short, the orthonormal matrix U I mentioned above enables rotation of matrix, and the diagonal matrix diag(\lambda_1, \dots, \lambda_D) expands or contracts vectors along each axis. I am going to explain that more precisely in the upcoming articles.

* I make study materials on machine learning, sponsored by DATANOMIQ. I do my best to make my content as straightforward but as precise as possible. I include all of my reference sources. If you notice any mistakes in my materials, including grammatical errors, please let me know (email: yasuto.tamura@datanomiq.de). And if you have any advice for making my materials more understandable to learners, I would appreciate hearing it.

*I attatched the codes I used to make the figures in this article. You can just copy, paste, and run, sometimes installing necessary libraries.

import matplotlib.pyplot as plt 
import numpy as np
import matplotlib.patches as mpatches

T_A = np.array([[1, 1], 
                [1, 0]])

total_step = 5
x = np.zeros((total_step, 2))

x[0]  = np.array([1, 0])

for i in range(total_step - 1):
    x[i + 1] = np.dot(T_A, x[i])

eigen_values, eigen_vectors = np.linalg.eig(T_A)
idx = eigen_values.argsort()[::-1]   
eigen_values = eigen_values[idx]
eigen_vectors = eigen_vectors[:,idx]
for i in range(len(eigen_vectors)):
    if(eigen_vectors.T[i][0] < 0):
        eigen_vectors.T[i] = - eigen_vectors.T[i]   

v_initial = x[0]
v_coefficients = np.zeros((total_step , 2))
v_coefficients[0] = np.dot(v_initial ,  np.linalg.inv(eigen_vectors.T)) 

for i in range(total_step-1):
    v_coefficients[i + 1] = v_coefficients[i] * eigen_values 

for i in range(total_step):
    v_1_list[i+1] = v_coefficients.T[0][i]*eigen_vectors.T[0]
    v_2_list[i+1] = v_coefficients.T[1][i]*eigen_vectors.T[1]

plt.figure(figsize=(20, 15))
fontsize = 20
small_shift = 0.2

plt.plot(x[:, 0], x[:, 1], marker='o', linestyle='none', markersize=10, color='black')

plt.arrow(0, 0, eigen_vectors.T[0][0], eigen_vectors.T[0][1], width=0.05, head_width=0.2, color='orange')
plt.arrow(0, 0, eigen_vectors.T[1][0], eigen_vectors.T[1][1], width=0.05, head_width=0.2, color='orange')

plt.text(eigen_vectors.T[0][0], eigen_vectors.T[0][1]+small_shift, r'v_{1}', va='center',ha='right', fontsize=fontsize + 10)
plt.text(eigen_vectors.T[1][0] - small_shift, eigen_vectors.T[1][1],r'v_{2}', va='center',ha='right', fontsize=fontsize + 10)

for i in range(total_step): 
    
    plt.arrow(0, 0, v_1_list[i+1][0], v_1_list[i+1][1], head_width=0.05, color='darkviolet', length_includes_head=True)
    plt.arrow(0, 0, v_2_list[i+1][0], v_2_list[i+1][1], head_width=0.05, color='darkviolet', length_includes_head=True)
    
    plt.text(v_1_list[i+1][0] + 2*small_shift , v_1_list[i+1][1]-2*small_shift,r'\alpha \cdot \lambda_{0} ^{1} \cdot v_{2}'.format(1,i+1, 1),va='center',ha='right', fontsize=fontsize)
    plt.text(v_2_list[i+1][0]-0.1, v_2_list[i+1][1],r'\beta \cdot \lambda_{0} ^{1} \cdot v_{2}'.format(2, i+1, 2),va='center',ha='right', fontsize=fontsize)

    plt.arrow(v_1_list[i+1][0], v_1_list[i+1][1], v_2_list[i+1][0], v_2_list[i+1][1], head_width=0, color='black', linestyle='--', length_includes_head=True)
    plt.arrow(v_2_list[i+1][0], v_2_list[i+1][1], v_1_list[i+1][0], v_1_list[i+1][1], head_width=0, color='black', linestyle='--', length_includes_head=True)
    
orange_patch = mpatches.Patch(color='orange', label='Eigen vectors')
purple_patch = mpatches.Patch(color='darkviolet', label='Scalar multiples of the eigen vectors')
plt.legend(handles=[orange_patch, purple_patch], fontsize=25, loc='lower right')

for i in range(total_step):
    plt.text(x[i][0]+0.1, x[i][1]-0.05, r'n={0}'.format(i), fontsize=20)

plt.grid(True)
plt.ylabel("a_{n}: n^{th} generation", fontsize=20)
plt.xlabel("a_{n+1}: n+1 ^{th} geneartion", fontsize=20)
plt.title("Fibonacci sequence and its eigen space", fontsize=30)
#plt.savefig("Fibonacci_eigen_space.png")
plt.show()
import matplotlib.pyplot as plt 
import numpy as np 
import matplotlib.patches as mpatches

const_range = 10

X = np.arange(-const_range, const_range + 1, 1)
Y = np.arange(-const_range, const_range + 1, 1)
U_x, U_y = np.meshgrid(X, Y)

T_A_0 = np.array([[3, 1], 
                [1, 2]])

T_A_1 = np.array([[3, 1],
                [-1, 1]])

T_A_2 = np.array([[1, -1], 
                [1, 1]])

T_A_list = np.array((T_A_0, T_A_1, T_A_2))

const_range = 5
plt.figure(figsize=(30, 10))
plt.subplots_adjust(wspace=0.1)
labels = ["Grids", "Displacement vectors made by A", "Real eigen vectors of A"]  
title_list = [r"A_1 has two different real eigen vectors.", r"A_2 has two identical real unit eigen vectors.",  r"A_3 has only imaginary eigen vectors."]
for idx in range(len(T_A_list)): 
    
    eigen_values, eigen_vectors = np.linalg.eig(T_A_list[idx])
    sorted_idx = eigen_values.argsort()[::-1]   
    eigen_values = eigen_values[sorted_idx]
    eigen_vectors = eigen_vectors[:,sorted_idx]
    eigen_vectors = eigen_vectors.astype(float)
        
    for i in range(len(eigen_vectors)):
        if(eigen_vectors.T[i][0] < 0):
            eigen_vectors.T[i] = - eigen_vectors.T[i]
        

    X = np.arange(-const_range, const_range + 1, 1)
    Y = np.arange(-const_range, const_range + 1, 1)
    U_x, U_y = np.meshgrid(X, Y)

    V_x = np.zeros((len(U_x), len(U_y)))
    V_y = np.zeros((len(U_x), len(U_y)))

    temp_vec = np.zeros((1, 2))

    W_x = np.zeros((len(U_x), len(U_y)))
    W_y = np.zeros((len(U_x), len(U_y)))

    plt.subplot(1, 3, idx + 1)


    for i in range(len(U_x)):
        for j in range(len(U_y)):
            temp_vec[0][0] = U_x[i][j]
            temp_vec[0][1] = U_y[i][j]
        
            temp_vec[0] = np.dot(T_A_list[idx], temp_vec[0])
        
            V_x[i][j] = temp_vec[0][0]
            V_y[i][j] = temp_vec[0][1]
        
            W_x[i][j] = V_x[i][j] - U_x[i][j]
            W_y[i][j] = V_y[i][j] - U_y[i][j]
            #plt.arrow(0, 0, V_x[i][j], V_y[i][j], head_width=0.1, color='red')
            plt.arrow(0, 0, U_x[i][j], U_y[i][j], head_width=0.3, color='dimgrey', label=labels[0])
            plt.arrow(U_x[i][j], U_y[i][j], W_x[i][j], W_y[i][j], head_width=0.3, color='darkviolet', label=labels[1])
            
            range_const = 20
            plt.xlim([-range_const, range_const])
            plt.ylim([-range_const, range_const])
            plt.title(title_list[idx], fontsize=25)
            
            if idx==2:
                continue
 
            plt.arrow(0, 0, eigen_vectors.T[0][0]*10, eigen_vectors.T[0][1]*10, head_width=1, color='orange', label=labels[2])
            plt.arrow(0, 0, eigen_vectors.T[1][0]*10, eigen_vectors.T[1][1]*10, head_width=1, color='orange', label=labels[2])

grey_patch = mpatches.Patch(color='grey', label='Grids')
purple_patch = mpatches.Patch(color='darkviolet', label='Displacement vectors made by A')
yellow_patch = mpatches.Patch(color='gold', label='Real eigen vectors of A')
plt.legend(handles=[grey_patch, purple_patch, yellow_patch], fontsize=25, loc='lower right', bbox_to_anchor=(-0.1, -.35))
#plt.savefig("linear_transformation.png")
plt.show()
import numpy as np 
import matplotlib.pyplot as plt
from mpl_toolkits.mplot3d.proj3d import proj_transform
from mpl_toolkits.mplot3d.axes3d import Axes3D
from matplotlib.text import Annotation
from matplotlib.patches import FancyArrowPatch
import matplotlib.patches as mpatches

class Annotation3D(Annotation):
    def __init__(self, text, xyz, *args, **kwargs):
        super().__init__(text, xy=(0,0), *args, **kwargs)
        self._xyz = xyz

    def draw(self, renderer):
        x2, y2, z2 = proj_transform(*self._xyz, renderer.M)
        self.xy=(x2,y2)
        super().draw(renderer)

def _annotate3D(ax,text, xyz, *args, **kwargs):
    '''Add anotation `text` to an `Axes3d` instance.'''

    annotation= Annotation3D(text, xyz, *args, **kwargs)
    ax.add_artist(annotation)

setattr(Axes3D,'annotate3D',_annotate3D)

class Arrow3D(FancyArrowPatch):
    def __init__(self, x, y, z, dx, dy, dz, *args, **kwargs):
        super().__init__((0,0), (0,0), *args, **kwargs)
        self._xyz = (x,y,z)
        self._dxdydz = (dx,dy,dz)

    def draw(self, renderer):
        x1,y1,z1 = self._xyz
        dx,dy,dz = self._dxdydz
        x2,y2,z2 = (x1+dx,y1+dy,z1+dz)

        xs, ys, zs = proj_transform((x1,x2),(y1,y2),(z1,z2), renderer.M)
        self.set_positions((xs[0],ys[0]),(xs[1],ys[1]))
        super().draw(renderer)

def _arrow3D(ax, x, y, z, dx, dy, dz, *args, **kwargs):
    '''Add an 3d arrow to an `Axes3D` instance.'''

    arrow = Arrow3D(x, y, z, dx, dy, dz, *args, **kwargs)
    ax.add_artist(arrow)

setattr(Axes3D,'arrow3D',_arrow3D)

T_A = np.array([[60.45, 33.63, 46.29], 
                [33.63, 68.49, 50.93], 
                [46.29, 50.93, 53.61]])

T_A = T_A/50
const_range = 2


X = np.arange(-const_range, const_range + 1, 1)
Y = np.arange(-const_range, const_range + 1, 1)
Z = np.arange(-const_range, const_range + 1, 1)

U_x, U_y, U_z = np.meshgrid(X, Y, Z)

V_x = np.zeros((len(U_x), len(U_y), len(U_z)))
V_y = np.zeros((len(U_x), len(U_y), len(U_z)))
V_z = np.zeros((len(U_x), len(U_y), len(U_z)))

temp_vec = np.zeros((1, 3))

W_x = np.zeros((len(U_x), len(U_y), len(U_z)))
W_y = np.zeros((len(U_x), len(U_y), len(U_z)))
W_z = np.zeros((len(U_x), len(U_y), len(U_z)))

eigen_values, eigen_vectors = np.linalg.eig(T_A)
sorted_idx = eigen_values.argsort()[::-1]   
eigen_values = eigen_values[sorted_idx]
eigen_vectors = eigen_vectors[:,sorted_idx]
eigen_vectors = eigen_vectors.astype(float)

fig = plt.figure(figsize=(15, 15))
ax = fig.add_subplot(111, projection='3d')
grid_range = const_range + 5
ax.set_xlim(-grid_range, grid_range)
ax.set_ylim(-grid_range, grid_range)
ax.set_zlim(-grid_range, grid_range)

eigen_values, eigen_vectors = np.linalg.eig(T_A)
sorted_idx = eigen_values.argsort()[::-1]   
eigen_values = eigen_values[sorted_idx]
eigen_vectors = eigen_vectors[:,sorted_idx]
eigen_vectors = eigen_vectors.astype(float)
     
    
for i in range(len(eigen_vectors)):
    if(eigen_vectors.T[i][0] < 0):
        eigen_vectors.T[i] = - eigen_vectors.T[i]

for i in range(len(U_x)):
    for j in range(len(U_x)):
        for k in range(len(U_x)):
            temp_vec[0][0] = U_x[i][j][k]
            temp_vec[0][1] = U_y[i][j][k]
            temp_vec[0][2] = U_z[i][j][k]
        
            temp_vec[0] = np.dot(T_A, temp_vec[0])
        
            V_x[i][j][k] = temp_vec[0][0]
            V_y[i][j][k] = temp_vec[0][1]
            V_z[i][j][k] = temp_vec[0][2]
        
            W_x[i][j][k] = V_x[i][j][k] - U_x[i][j][k]
            W_y[i][j][k] = V_y[i][j][k] - U_y[i][j][k]
            W_z[i][j][k] = V_z[i][j][k] - U_z[i][j][k]
            ax.arrow3D(0, 0, 0, 
                       U_x[i][j][k], U_y[i][j][k], U_z[i][j][k], 
                       mutation_scale=10, arrowstyle="-|>", fc='dimgrey', ec='dimgrey')
            #ax.arrow3D(0, 0, 0, 
            #          V_x[i][j][k], V_y[i][j][k], V_z[i][j][k], 
            #           mutation_scale=10, arrowstyle="-|>", fc='red', ec='red')
            ax.arrow3D(U_x[i][j][k], U_y[i][j][k], U_z[i][j][k], 
                       W_x[i][j][k], W_y[i][j][k], W_z[i][j][k],
                       mutation_scale=10, arrowstyle="-|>", fc='darkviolet', ec='darkviolet')
            
ax.arrow3D(0, 0, 0, eigen_vectors.T[0][0]*10, eigen_vectors.T[0][1]*10, eigen_vectors.T[0][2]*10,
                       mutation_scale=10,  arrowstyle="-|>", fc='orange', ec='orange')
ax.arrow3D(0, 0, 0, eigen_vectors.T[1][0]*10, eigen_vectors.T[1][1]*10, eigen_vectors.T[1][2]*10,
                       mutation_scale=10, arrowstyle="-|>", fc='orange', ec='orange')
ax.arrow3D(0, 0, 0, eigen_vectors.T[2][0]*10, eigen_vectors.T[2][1]*10, eigen_vectors.T[2][2]*10,
                       mutation_scale=10, arrowstyle="-|>", fc='orange', ec='orange')

ax.text(eigen_vectors.T[0][0]*8 , eigen_vectors.T[0][1]*8, eigen_vectors.T[0][2]*8+1, r'v_1', fontsize=20)
ax.text(eigen_vectors.T[1][0]*8 , eigen_vectors.T[1][1]*8, eigen_vectors.T[1][2]*8, r'v_2', fontsize=20)
ax.text(eigen_vectors.T[2][0]*8 , eigen_vectors.T[2][1]*8, eigen_vectors.T[2][2]*8, r'v_3', fontsize=20)


grey_patch = mpatches.Patch(color='grey', label='Grids')
orange_patch = mpatches.Patch(color='orange', label='Orthogonal eigen vectors of A')
purple_patch = mpatches.Patch(color='darkviolet', label='Displacement vectors made by A')
plt.legend(handles=[grey_patch, orange_patch, purple_patch], fontsize=20, loc='lower right')

ax.set_xlabel(r'x_1', fontsize=25)
ax.set_ylabel(r'x_2', fontsize=25)
ax.set_zlabel(r'x_3', fontsize=25)
#plt.savefig("symmetric_positive_definite_visualizaiton.png")
plt.show()


K Nearest Neighbour For Supervised Learning

K-Nearest Neighbour (KNN) Algorithms is an easy-to-implement & advanced level supervised machine learning algorithm used for both – classification as well as regression problems. However, you can see a wide of its applications in classification problems across various industries.

If you’ve been shopping a lot in e-commerce sites like Amazon, Flipkart, Myntra, or love watching web series over Netflix and Amazon Prime, one common thing you’ve always noticed, and that is recommendations.

Are you wondering how they recommend you following your choice? They use KNN Supervised Learning to find out what you may need the next when you’re buying and recommend you with a few more products.

Imagine you’re looking for an iPhone to purchase. When you scroll down a little, you see some iPhone cases, tempered glasses – saying, “People who purchased an iPhone have also purchased these items. The same applies to Netflix and Amazon Prime. When you finished a show or a series, they give you recommendations of the same genre. And do it all using KNN supervised learning and classify the items for the best user experience.

Advantages Of KNN

  • Quickest Calculation Time
  • Simple Algorithms
  • High Accuracy
  • Versatile – best use for Regression and Classification.
  • Doesn’t make any assumptions about data.

Where KNN Are Mostly Used

  • Simple Recommendation Models
  • Image Recognition Technology
  • Decision-Making Models
  • Calculating Credit Rating

Choosing The Right Value For K

 To choose the right value of K, you have to run KNN algorithms several times with different values of K and select the value of K, which reduces the number of errors you’ve come across and come out as the most stable value for K.

Your Step-By-Step Guide For Choosing The Value Of K

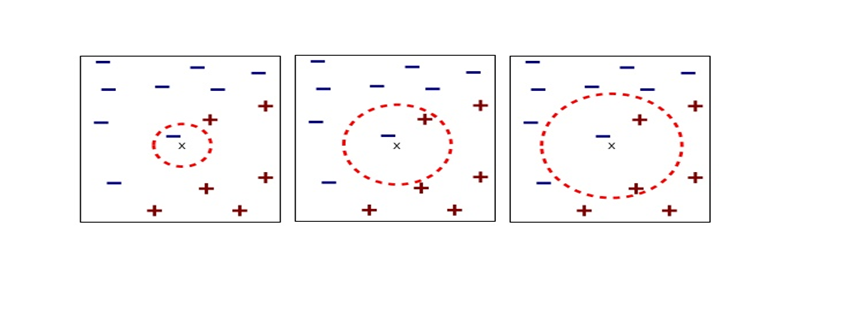
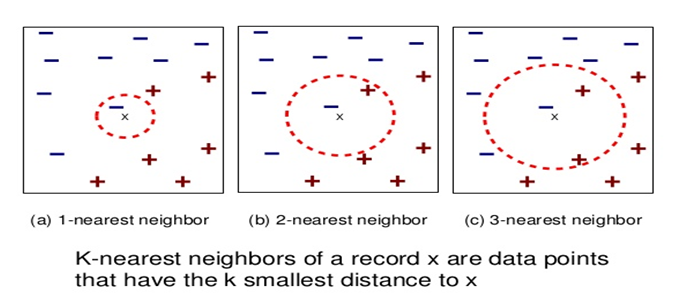
  • As you decrease the value of K to 1 (K = 1), you’ll reach a query point, where you get to see many elements from class A (-) and class B (+) where (-) is the only nearest neighbor. Reasonably, you would think about the query point to be most likely the red one. As K =1, which has a blue color, KNN incorrectly predicts the wrong color blue.
  • As you increase the value of K to 2 (K=2), you get to see two elements, (-) and (+) are the only nearest neighbor. As you have two values, which are of Class A and Class B, KNN incorrectly predicts the wrong values (Blue and Red).
  • As you increase the value of K to 3 (K=3), you get to see three elements (-) and (+), (+) are the only nearest neighbor. And this time, you got three values, one from blue and two from red. As your assumption is red, KNN correctly predicts the right value (Blue and Red, Red). Your answer is more stable this time compared to previous ones.

Conclusion

KNN works by finding the nearest distance between a query and all the elements in the database. By choosing the value for K, we get the closest to the query. And then, KNN algorithms look for the most frequent labels in classification and averages of labels in regression.

Spiky cubes, Pac-Man walking, empty M&M’s chocolate: curse of dimensionality

This is the first article of the article series Illustrative introductions on dimension reduction.

“Curse of dimensionality” means the difficulties of machine learning which arise when the dimension of data is higher. In short if the data have too many features like “weight,” “height,” “width,” “strength,” “temperature”…., that can undermine the performances of machine learning. The fact might be contrary to your image which you get from the terms “big” data or “deep” learning. You might assume that the more hints you have, the better the performances of machine learning are. There are some reasons for curse of dimensionality, and in this article I am going to introduce two major reasons below.

  1. High dimensional data usually have rich expressiveness, but usually training data are too poor for that.
  2. The behaviors of data points in high dimensional space are totally different from our common sense.

Through these topics, you will see that you always have to think about which features to use considering the number of data points.

*From now on I am going to talk about only Euclidean distance. If you are not sure what Euclidean distance means, please just keep it in mind that it is the type of distance most people wold have learnt in normal compulsory education.

1. Number of samples and degree of dimension

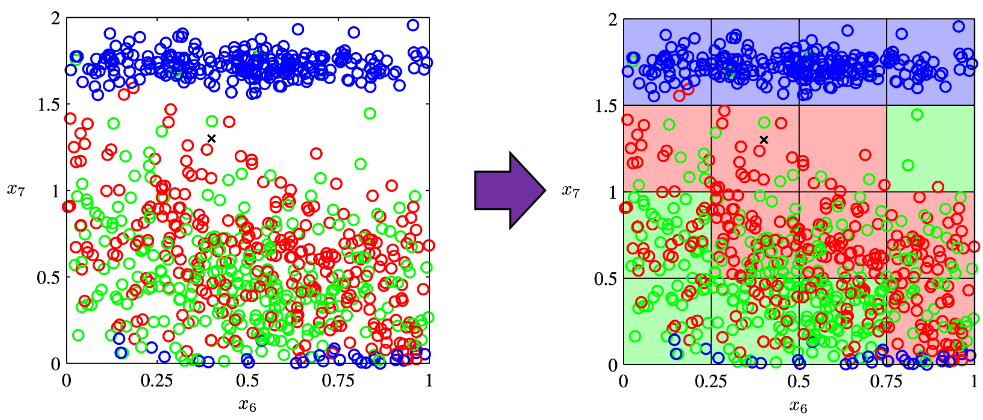
The most straightforward demerit of adding many features, or increasing dimensions of data, is the growth of computational costs. More importantly, however, you always have to think about the degree of dimensions in relation of the number of data points you have. Let me take a simple example in a book “Pattern Recognition and Machine Learning” by C. M. Bishop (PRML). This is an example of measurements of a pipeline. The figure below shows a comparison plot of 3 classes (red, green and blue), with parameter x_7 plotted against parameter x_6 out of 12 parameters.

* The meaning of data is not important in this article. If you are interested please refer to the appendix in PRML.

Assume that we are interested in classifying the cross in black into one of the three classes. One of the most naive ideas of this classification is dividing the graph into grids and labeling each grid depending on the number of samples in the classes (which are colored at the right side of the figure). And you can classify the test sample, the cross in black, into the class of the grid where the test sample is in. Thereby the cross is classified to the class in red.

Source: C.M. Bishop, “Pattern Recognition and Machine Learning,” (2006), Springer, pp. 34-35

As I mentioned in the figure above, we used only two features out of 12 features in total. When the total number of data points is fixed and you add remaining ten axes/features one after another, what would happen? Let’s see what “adding axes/features” means. If you are talking about 1, 2, or 3 dimensional grids, you can visualize them. And as you can see from the figure below, if you make each 10^1, 10^2, 100^3 grids respectively in 1, 2, 3 dimensional spaces, the number of the small regions in the grids are respectively 10, 100, 1000. Even though you cannot visualize it anymore, you can make grids for more than 3 dimensional data. If you continue increasing the degree of dimension, the number of grids increases exponentially, and that can soon surpass the number of training data points. That means there would be a lot of empty spaces in such high dimensional grids. And the classifying method above: coloring each grid and classifying unknown samples depending on the colors of the grids, does not work out anymore because there would be a lot of empty grids.

* If you are still puzzled by the idea of “more than 3 dimensional grids,” you should not think too much about that now. It is enough if you can get some understandings on high dimensional data after reading the whole article of this.

Source: Goodfellow and Yoshua Bengio and Aaron Courville, Deep Learning, (2016), MIT Press, p. 153

I said the method above is the most naive way, but other classical classification methods , for example k-nearest neighbors algorithm, are more or less base on a similar idea. Many of classical machine learning algorithms are based on the idea of smoothness prior, or local constancy prior. In short in classical ways, you  do not expect data to change so much in a small region, so you can expect unknown samples to be similar to data in vicinity. But that soon turns out to be problematic when the dimension of data is bigger because training data would be sparse because the area of multidimensional space grows exponentially as I mentioned above. And sometimes you would not be able to find training data around test data. Plus, in high dimensional data, you cannot treat distance in the same as you do in lower dimensional space. The ideas of “close,” “nearby,” or “vicinity” get more obscure in high dimensional data. That point is related to the next topic: the intuition have cultivated in normal life is not applicable to higher dimensional data.

2. Bizarre characteristics of high dimensional data

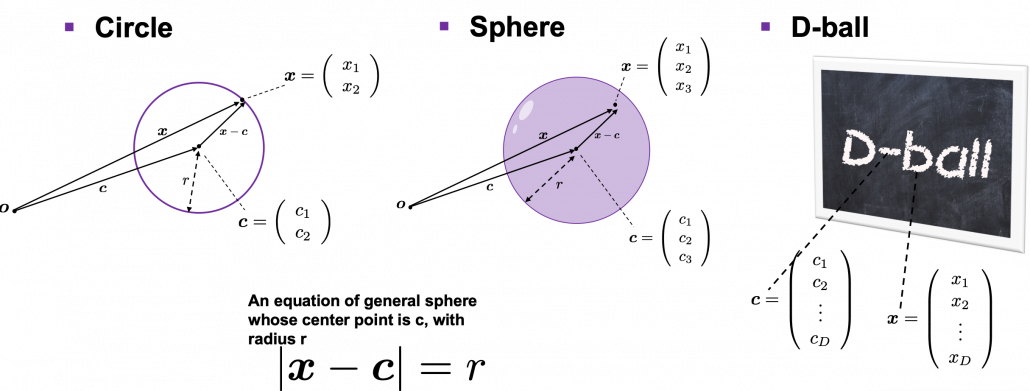
We form our sense of recognition in 3-dimensional ways in our normal life. Even though we can visualize only 1, 2, or 3 dimensional data, we can actually generalize the ideas in 1, 2, or 3 dimensional ideas to higher dimensions. For example 4 dimensional cubes, 100 dimensional spheres, or orthogonality in 255 dimensional space. Again, you cannot exactly visualize those ideas, and for many people, such high dimensional phenomenon are just imaginary matters on blackboards. Those high dimensional ideas are designed to retain some conditions just as well as 1, 2, or 3 dimensional space. Let’s take an example of spheres in several dimensional spaces. General spheres in any D-dimensional space can be defined as a set of any \boldsymbol{x}, such that |\boldsymbol{x} - \boldsymbol{c}| = r, where \boldsymbol{c} is the center point and r is length of radius. When \boldsymbol{x} is 2-dimensional, the spheres are called “circles.” When \boldsymbol{x} is 3-dimensional, the spheres are called “spheres” in our normal life, unless it is used in a conversation in a college cafeteria, by some students in mathematics department. And when \boldsymbol{x} is D-dimensional, they are called D-ball, and again, this is just a imaginary phenomenon on blackboard.

* Vectors and points are almost the same because all the vectors are denoted as “arrows” from the an origin point to sample data points.  The only difference is that when you use vectors, you have to consider their directions.

* “D-ball” is usually called “n-ball,” and in such context it is a sphere in a n-dimensional space. But please let me use the term “D-ball” in this article.

Not only spheres, but only many other ideas have been generalized to D-dimensional space, and many of them are indispensable also for data science. But there is one severe problem: the behaviors of data in high dimensional field is quite different from those in two or three dimensional space. To be concrete, in high dimensional field, cubes are spiky, you have to move like Pac-Man, and M & M’s Chocolate looks empty inside but tastes normal.

2.1: spiky cubes
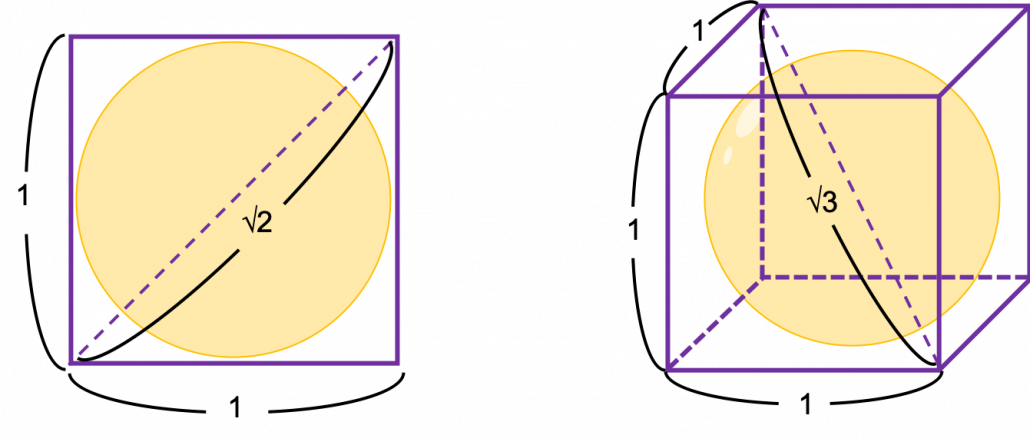
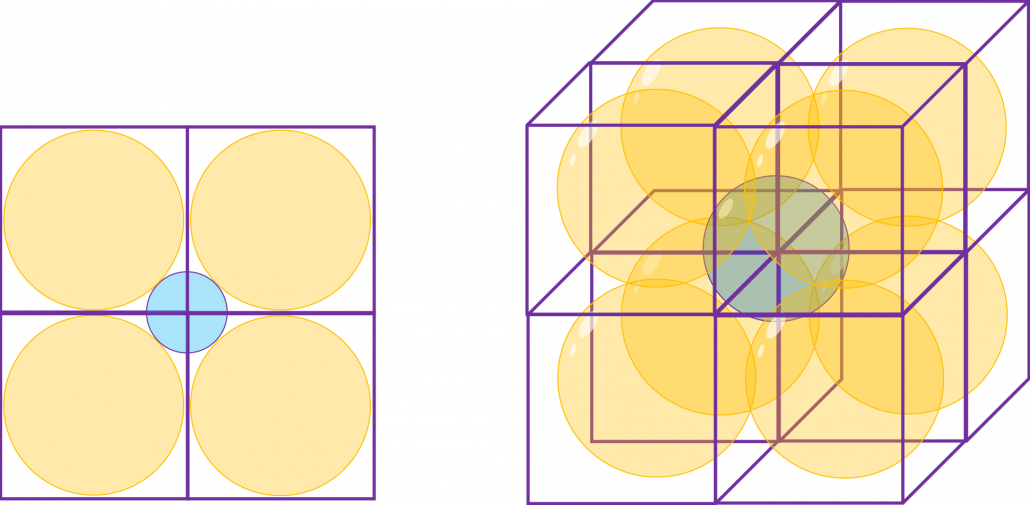
Let’s take a look at an elementary-school-level example of geometry first. Assume that you have several unit squares or unit cubes like below. In each of them a circle or sphere with diameter 1 is inscribed. The length of a diagonal line in each square is \sqrt{2}, and that in each cube is \sqrt{3}.

If you stack the squares or cubes as below, what are the length of diameters of the blue circle or sphere, circumscribing all the 4 orange circles or the 8 orange spheres?

The answers are, the diameter of the blue circle is \sqrt{2} - 1, and the diameter of the blue sphere is \sqrt{3} - 1.

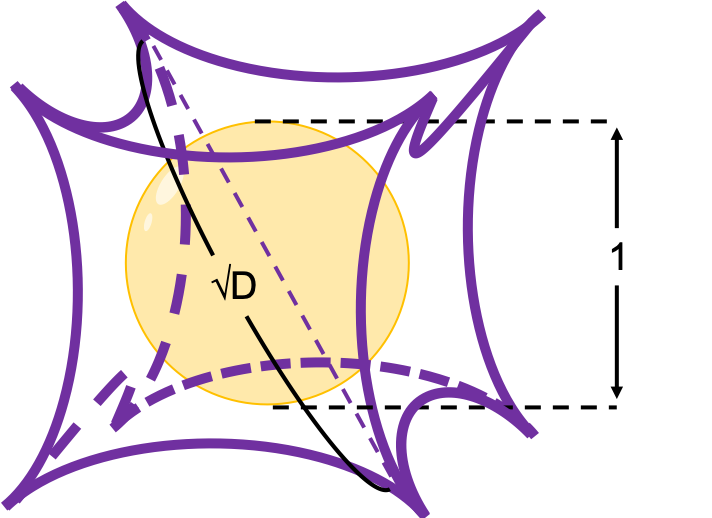
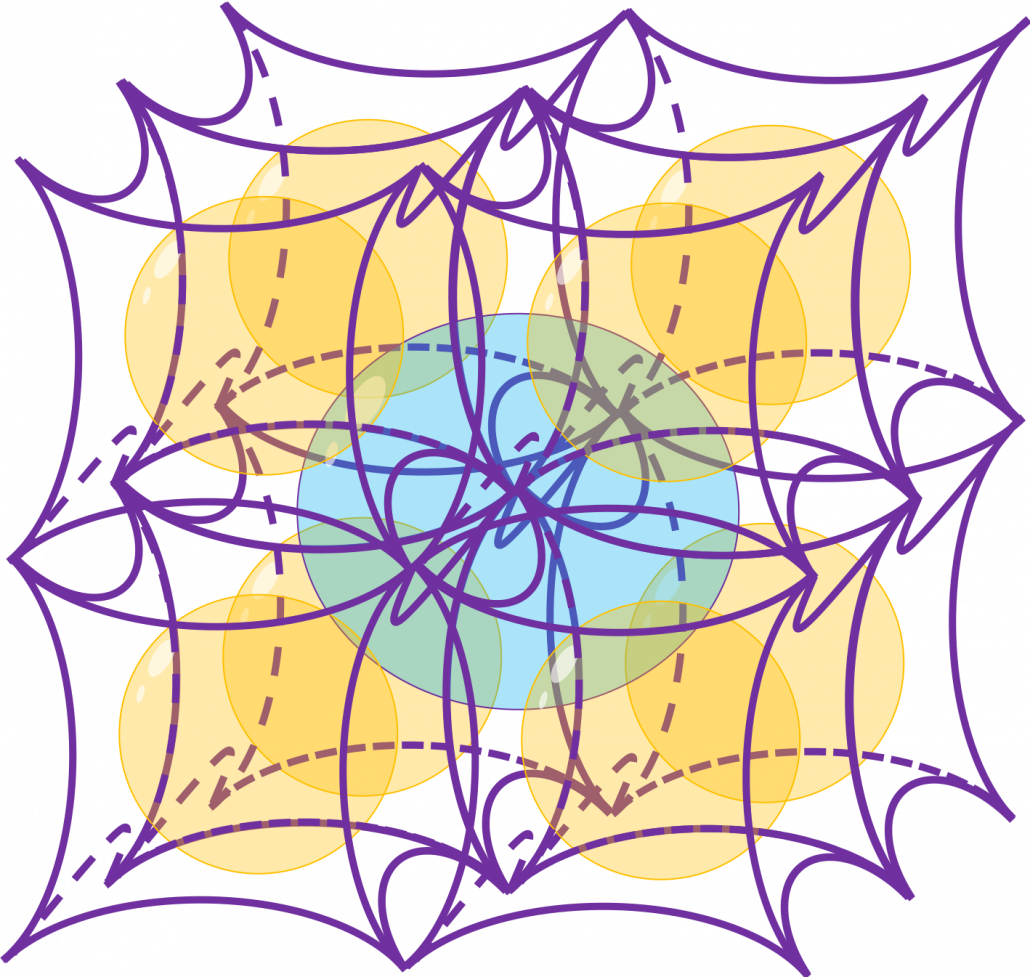
Next let’s think about the same situation in higher dimensional space. Assume that there are some unit D-dimensional hypercubes stacked, in each of which a D-ball with diameter 1 is inscribed, touching all the surfaces inside. Then what is the length of the diameter of  a D-ball circumscribing all the unit D-ball in the hypercubes ? Given the results above, it ca be predicted that its diameter is \sqrt{D}  -1. If that is true, there is one strange point: \sqrt{D} - 1 can soon surpass 2: that means in the chart above the blue sphere will stick out of the stacked cubes. That sounds like a paradox, but with one hypothesis, the phenomenon makes sense: cubes become more spiky as the degree of dimension grows. This hypothesis is a natural deduction because diagonal lines of hyper cubes get longer, and the the center of each surface of hypercubes still touches the unit D-ball with diameter 1, inscribing inscribing inside each unit hypercube.

If you stack 4 hypercubes, the blue sphere circumscribing them will not stick out of the stacked hypercubes anymore like the figure below.

*Of course you cannot visualize what is going on in D-dimensional space, so the figure below is just a pseudo simulation of D-dimensional space in our 3-dimensional sense. I guess you have to stack more than four hyper cubes in higher dimensional data, but you cannot easily imagine what will go on in such space anymore.


*You can confirm the fact that hypercube gets more spiky as the degree of dimension growth, by comparing the volume of the hypercube and the volume of the D-ball inscribed inside the hypercube. Thereby you can prove that the volume of hypercube concentrates on the corners of the hypercube. Plus, as I mentioned the longest diagonal distance of hypercube gets longer as dimension degree increases. That is why hypercube is said to be spiky. For mathematical proof, please check the Exercise 1.19 of PRML.

2.2: Pac-Man walking

Next intriguing phenomenon in high dimensional field is that most of pairs of vectors in high dimensional space are orthogonal. In other words, if you select two random vectors in high dimensional space, the angle between them are mostly close to 90^\circ. Let’s see the general meaning of angle between two vectors in any dimensional spaces. Assume that the angle between two vectors \boldsymbol{u}, and \boldsymbol{v} is \theta, then cos\theta is calculated as cos\theta = \frac{<\boldsymbol{u}, \boldsymbol{v}>}{|\boldsymbol{u}||\boldsymbol{v}|}. In 1, 2, or 3 dimensional space, you can actually see the angle, but again you can define higher dimensional angle, which you cannot visualize anymore. And angles are sometimes used as similarity of two vectors.

* <\boldsymbol{u}, \boldsymbol{v}> is the inner product of \boldsymbol{u}, and \boldsymbol{v}.

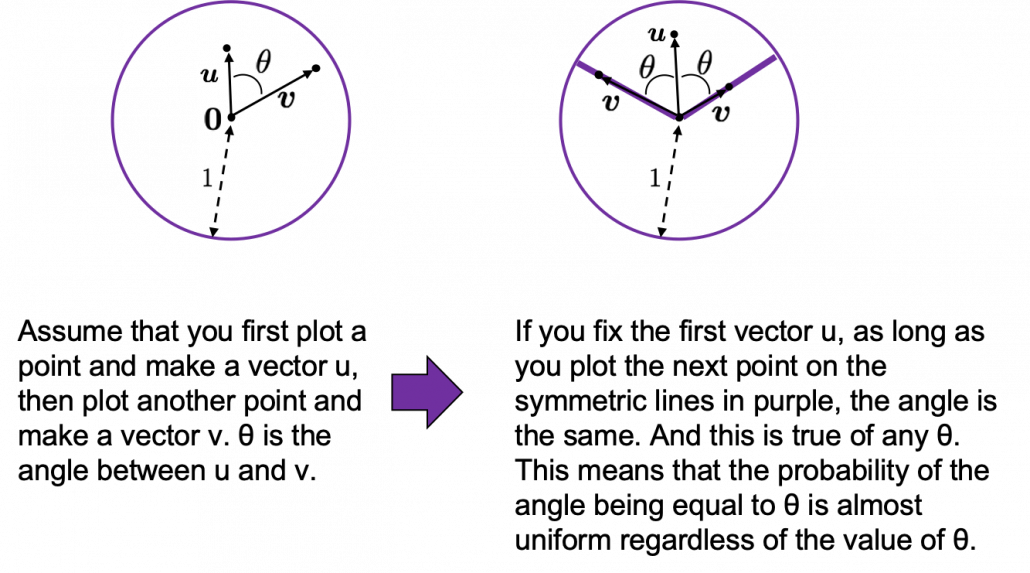
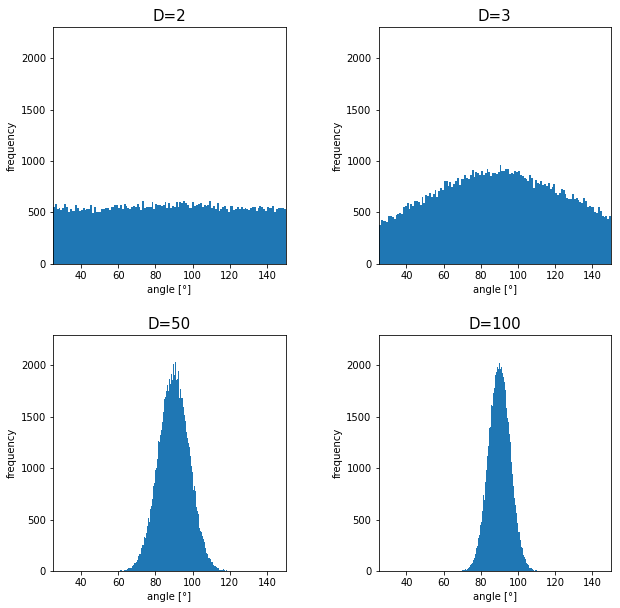
Assume that you generate a pair of two points inside a D-dimensional unit sphere and make two vectors \boldsymbol{u}, and \boldsymbol{v} by connecting the origin point and those two points respectively. When D is 2, I mean spheres are circles in this case, any \theta are equally generated as in the chart below. The fact might be the same as your intuition.   How about in 3-dimensional space? In fact the distribution of \theta is not uniform. \theta = 90^\circ is the most likely to be generated. As I explain in the figure below, if you compare the area of cross section of a hemisphere and the area of a cone whose vertex is the center point of the sphere, you can see why.
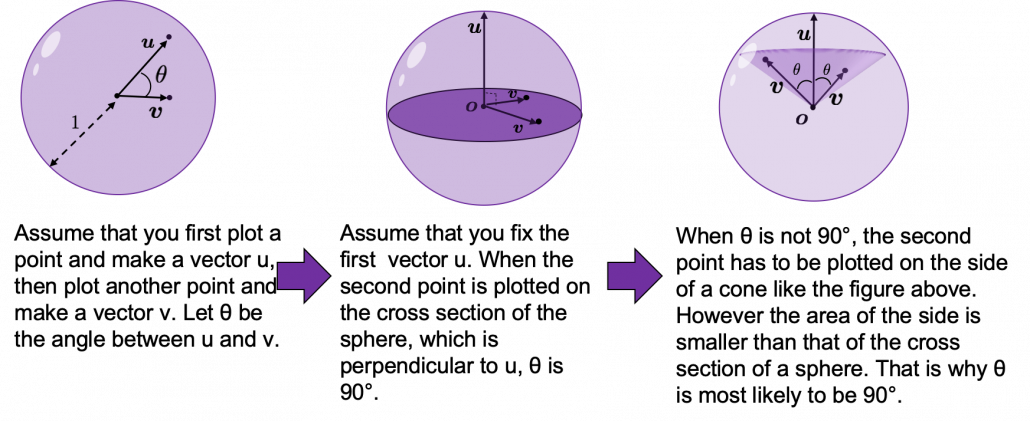
I generated 10000 random pairs of points in side a D-dimensional unit sphere, and calculated the angle between them. In other words I just randomly generated two D-dimensional vectors \boldsymbol{u} and \boldsymbol{v}, whose elements are randomly generated values between -1 and 1, and calculated the angle between them, repeating this process 10000 times. The chart below are the histograms of angle between pairs of generated vectors in respectively 2, 3, 50, and 100 dimensional space.

As I explained above, in 2-dimensional space, the distribution of \theta is almost uniform. However the distribution concentrates a little around 90^\circ in 3-dimensional space. You can see that the bigger the degree of dimension is, the more the angles of generated vectors concentrate around 90^\circ. That means most pairs of vectors in high dimensional space are close to orthogonal. Movements are also sequence of vectors, so when most pairs of movement vectors are orthogonal, that means you can only move like Pac-Man in such space.

Source: https://edition.cnn.com/style/article/pac-man-40-anniversary-history/index.html

* Of course I am talking about arcade Mac-Man game. Not Pac-Man in Super Smash Bros.  Retro RPG video games might have more similar playability, but in high dimensional space it is also difficult to turn back. At any rate, I think you have understood it is even difficult to move smoothly in high dimensional space, just like the first notorious Resident Evil on the first PS console also had terrible playability .

2.3: empty M & M’s chocolate

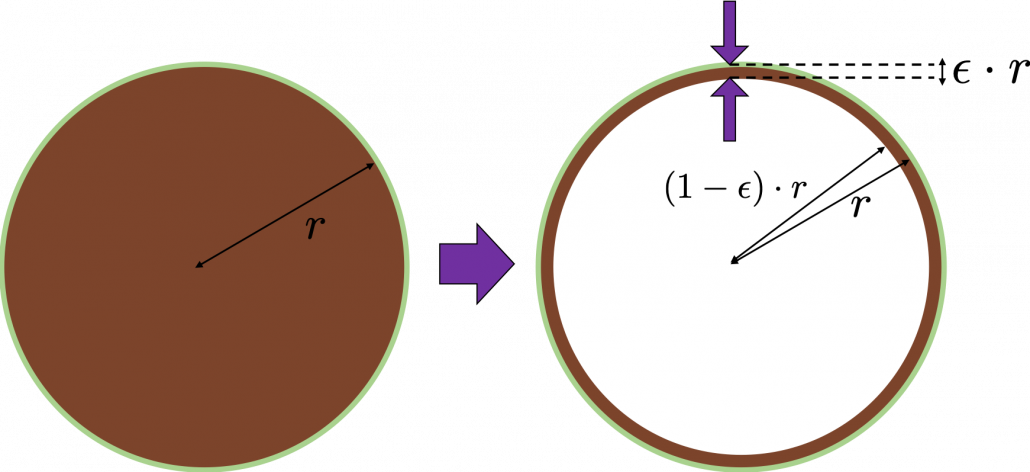
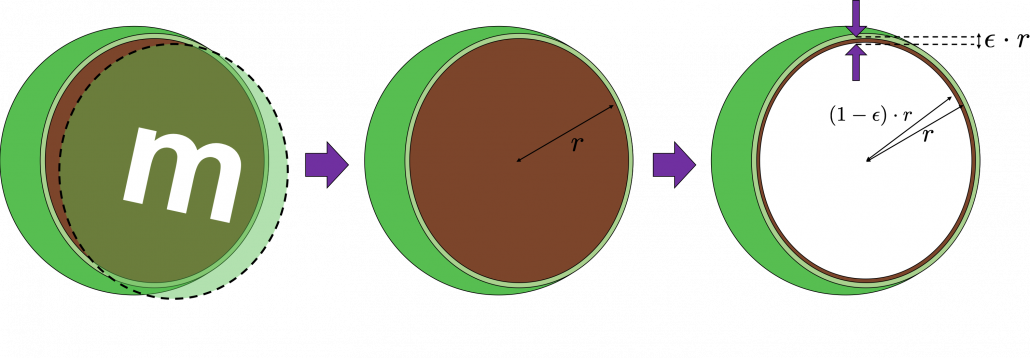
Let’s think about the proportion of the volume of the outermost \epsilon surface of general spheres with radius r. First, in 2 two dimensional space, spheres are circles. The area of the brown part of the circle below is \pi r^2. In order calculate the are of \epsilon \cdot r thick surface of the circle, you have only to subtract the area of \pi \{ (1 - \epsilon)\cdot r\} ^2. When \epsilon = 0.01, the area of outer most surface is \pi r^2 - \pi (0.99\cdot r)^2, and its proportion to the area of the whole circle is \frac{\pi r^2 - \pi (0.99\cdot r)^2}{\pi r^2} = 0.0199.

In case of 3-dimensional space, the value of a sphere with radius r is \frac{4}{3} \pi r^2, so the proportion of the \epsilon surface is calculated in the same way: \frac{\frac{4}{3} \pi r^3 -\frac{4}{3} \pi (0.99\cdot r)^2}{\frac{4}{3}\pi r^2} = 0.0297. Compared to the case in 2 dimensional space, the proportion is a little bigger.

How about in D-dimensional space? We have seen that even in  D-dimensional space the surface of a sphere, I mean D-ball, can be defined as a set of any points whose distance from the center point is all r. And it is known that the volume of D-ball is defined as below.

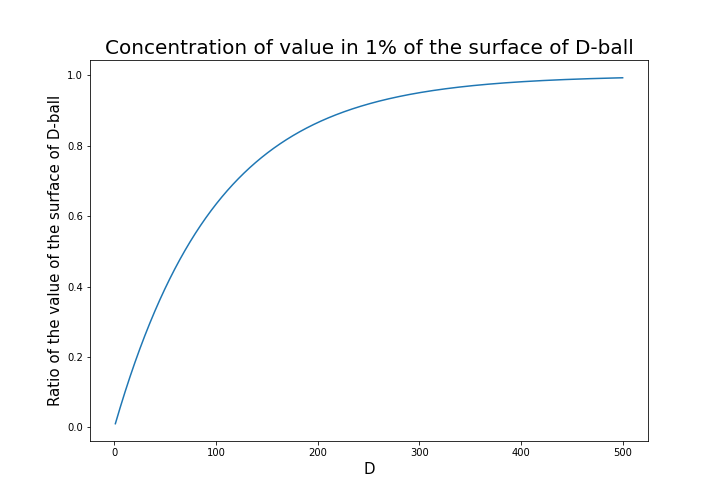
\Gamma () is called gamma function, but in this article it is not so important. The most important point now is, if you discuss any D-ball, their volume only depends on their radius r. That meas the proportion of outer \epsilon surface of D-ball is calculated as \frac{\pi r^2 - \pi \{ (1 - \epsilon)\cdot r\} ^2}{\pi r^2}. When \epsilon is 0.01, the proportion of the 1% surface of D-ball changes like in the chart below.

* And of course when D is 2,  \frac{\pi ^{(\frac{D}{2})}}{\Gamma (\frac{D}{2} + 1)} = \pi, and when D is 3 ,  \frac{\pi ^{(\frac{D}{2})}}{\Gamma (\frac{D}{2} + 1)} = \frac{4}{3} \pi

You can see that when D is over 400, around 90% of volume is concentrated in the very thin 1% surface of D-ball. That is why, in high dimensional space, M & M’s chocolate look empty but tastes normal: all the chocolate are concentrated beneath the sugar coating.

More interestingly, even if you choose any points as a central point of a sphere with radius r, the other points are squashed to the surface of the sphere, even if all the data points are uniformly distributed. This situation is problematic for classical machine learning algorithms, which are often based on the Euclidean distances between pairs of two sample data points: if you go from the central point to another sample point, the possibility of finding the point within (1 - \epsilon)\cdot r radius of the center is almost zero. But if you reach the outermost \epsilon part of the surface of the sphere, most data points are there. However, for one of the data points in the surface, any other data points are distant in the same way.

Inside M & M’s chocolate is a mysterious world.

Source: https://hipwallpaper.com/mms-wallpapers/

You have seen that using high dimensional data can be problematic in many ways. Data science and machine learning are largely based on one idea: you can find a lower dimensional meaningful and easier structure in data. In the next articles I am going to introduce some famous dimension reduction algorithms. And hopefully I would like to give some deeper insights in to these algorithms, in straightforward ways.

* I could not explain the relationships of variance and bias of data. This is also a very important factor when you think about dimensionality of data. I hope I can write about this topic someday. You can also look it up if you are interested.

* I make study materials on machine learning, sponsored by DATANOMIQ. I do my best to make my content as straightforward but as precise as possible. I include all of my reference sources. If you notice any mistakes in my materials, including grammatical errors, please let me know (email: yasuto.tamura@datanomiq.de). And if you have any advice for making my materials more understandable to learners, I would appreciate hearing it.

Illustrative introductions on dimension reduction

“What is your image on dimensions?”

….That might be a cheesy question to ask to reader of Data Science Blog, but most people, with no scientific background, would answer “One dimension is a line, and two dimension is a plain, and we live in three-dimensional world.” After that if you ask “How about the fourth dimension?” many people would answer “Time?”

You can find books or writings about dimensions in various field. And you can use the word “dimension” in normal conversations, in many contexts.

*In Japanese, if you say “He likes two dimension.” that means he prefers anime characters to real women, as is often the case with Japanese computer science students.

The meanings of “dimensions” depend on the context, but in data science dimension is usually the number of rows of your Excel data.

When you study data science or machine learning, usually you should start with understanding the algorithms with 2 or 3 dimensional data, and you can apply those ideas to any D dimensional data. But of course you cannot visualize D dimensional data anymore, and you always have to be careful of what happens if you expand degree of dimension.

Conversely it is also important to reduce dimension to understand abstract high dimensional stuff in 2 or 3 dimensional space, which are close to our everyday sense. That means dimension reduction is one powerful way of data visualization.

In this blog series I am going to explain meanings of dimension itself in machine learning context and algorithms for dimension reductions, such as PCA, LDA, and t-SNE, with 2 or 3 dimensional visible data. Along with that, I am going to delve into the meaning of calculations so that you can understand them in more like everyday-life sense.

This article series is going to be roughly divided into the contents below.

  1. Curse of Dimensionality
  2. PCA, LDA (to be published soon)
  3. Rethinking eigen vectors (to be published soon)
  4. KL expansion and subspace method (to be published soon)
  5. Autoencoder as dimension reduction (to be published soon)
  6. t-SNE (to be published soon)

I hope you could see that reducing dimension is one of the fundamental approaches in data science or machine learning.

How the Pandemic is Changing the Data Analytics Outsourcing Industry

While media pundits have largely focused on the impact of COVID-19 as far as human health is concerned, it hasn’t been particularly good for the health of automated systems either. As cybersecurity budgets plummet in the face of dwindling finances, computer criminals have taken the opportunity to increase attacks against high value targets.

In June, an online antique store suffered a data breach that contained over 3 million records, and it’s likely that a number of similar attacks have simply gone unpublished. Fortunately, data scientists are hard at work developing new methods of fighting back against these kinds of breaches. Budget constraints and a lack of personnel as a result of the pandemic continues to be a problem, but automation has helped to assuage the issue to some degree.

AI-Driven Data Storage Systems

Big data experts have long promoted the cloud as an ideal metaphor for the way that data is stored remotely, but as a result few people today consider the physical locations that this information is stored at. All data has to be located on some sort of physical storage device. Even so-called serverless apps have to be distributed from a server unless they’re fully deployed using P2P services.

Since software can never truly replace hardware, researchers are looking at refining the various abstraction layers that exist between servers and the clients who access them. Data warehousing software has enabled computer scientists to construct centralized data storage solutions that look like traditional disk locations. This gives users the ability to securely interact with resources that are encrypted automatically.

Background services based on artificial intelligence monitor virtual data warehouse locations, which gives specialists the freedom to conduct whatever analytics they deem necessary. In some cases, a data warehouse can even anonymize information as it’s stored, which can streamline workflows involved with the analysis process.

While this level of automation has proven useful, it’s still subject to some of the problems that have occurred as a result of the pandemic. Traditional supply chains are in shambles and a large percentage of technical workers are now telecommuting. If there’s a problem with any existing big data plans, then there’s often nobody around to do any work in person.

Living with Shifting Digital Priorities

Many businesses were in the process of outsourcing their data operations even before the pandemic, and the current situation is speeding this up considerably. Initial industry estimates had projected steady growth numbers for the data analytics sector through 2025. While the current figures might not be quite as bullish, it’s likely that sales of outsourcing contracts will remain high.

That being said, firms are also shifting a large percentage of their IT spending dollars into cybersecurity projects. A recent survey found that 37 percent of business leaders said they were already going to cut their IT department budgets. The same study found that 28 percent of businesses are going to move at least some part of their data analytics programs abroad.

Those companies that can’t find an attractive outsourcing contract might start to patch their remote systems over a virtual private network. Unfortunately, this kind of technology has been strained to some degree in recent months. The virtual servers that power VPNs are flooded with requests, which in turn has brought them down in some instances. Neural networks, which utilize deep learning technology to improve themselves as time goes on, have proven more than capable of predicting when these problems are most likely to arise.

That being said, firms that deploy this kind of technology might find that it still costs more to work with automated technology on-premise compared to simply investing in an outsourcing program that works with these kinds of algorithms at an outside location.

Saving Money in the Time of Corona

Experts from Think Big Analytics pointed out how specialist organizations can deal with a much wider array of technologies than a small business ever could. Since these companies specialize in providing support for other organizations, they have a tendency to offer support for a large number of platforms.

These representatives recently opined that they could provide support for NoSQL, Presto, Apache Spark and several other emerging platforms at the same time. Perhaps most importantly, these organizations can work with Hadoop and other traditional data analysis languages.

Staffers working on data mining operations have long relied on languages like Hadoop and R to write scripts that they later use to automate the process of collecting and analyzing data. By working with an organization that already supports a language that companies rely on, they can avoid the need of changing up their existing operations.

This can help to drastically reduce the cost of migration, which is extremely important since many of the firms that need to migrate to a remote system are already suffering from budget problems. Assuming that some issues related to the pandemic continue to plague businesses for some time, it’s likely that these budget constraints will force IT departments to consider a migration even if they would have otherwise relied solely on a traditional colocation arrangement.

IT department staffers were already moving away from many rare platforms even before the COVID-19 pandemic hit, however, so this shouldn’t be as much of a herculean task as it sounds. For instance, the KNIME Analytics Platform has increased in popularity exponentially since it’s release in 2006. The fact that it supports over 1,000 plug-in modules has made it easy for smaller businesses to move toward the platform.

The road ahead isn’t going to be all that pleasant, however. COBOL and other antiquated languages still rule the roost at many governmental big data processing centers. At the same time, some small businesses have never even been able to put a big data plan into play in the first place. As the pandemic continues to wreak havoc on the world’s economy, however, it’s likely that there will be no shortage of organizations continuing to migrate to more secure third-party platforms backed by outsourcing contracts.