Geschriebene Artikel über Big Data Analytics

How AI Has Enhanced Cloud Computing

AI is here and is not going away. The value of the AI market is only set to increase, with it estimated to surpass a value of $89 billion a year by 2025, and an important part of this market will be AI that powers cloud computing. AI and cloud computing are already impacting our lives, with the prevalence of digital assistants like Alexa, Google Home, and Siri, and cloud computing is not only a cost-effective data storage and processes solution but a vital part of the adoption of AI.

Combining AI with cloud computing is bringing about a revolution in cloud computing systems, enabling massive networks of supporting data which can learn and improve all the time. For businesses, this means an organization can become more insight-focused, strategic, and efficiently managed. The cloud brings agility, greater storage, and cost reduction; AI brings speedier data management and smoother workflows.

AI infrastructures, combined with public cloud, private cloud & hybrid cloud, bring about numerous benefits, including:

  • Cost-effective functions
  • Improved data management
  • Rise in productivity
  • Intelligent automation
  • Insights that go deeper
  • Enhanced security
  • Reliability and flexibility

And here are five additional ways in which AI has a positive impact on cloud computing:

  1. AI means a cloud can be self-managed with all routine activities automated and monitored, making overall functions more sophisticated and accountable. More data can be fed into the cloud computing system with AI, and predictions can be far more accurate, too. “The name of the game, fundamentally, is advancement, power and support,” says Justin Leigh, a tech writer at Research papers UK and Writinity. “The integration of AI will lead exponentially to better outcomes.”
  2. AI enhances all aspects of data management, boosting query accuracy of databases, improving performance, and saving on resources. Plus, AI means businesses can cope with far larger volumes of data, as it can help organize digital data and streamline its storage. Real-time monitoring and accounting will be strengthened, and risks and malware can be quickly identified and dealt with.
  3. Both AI and SaaS (Software-as-a-Service) improve productivity, especially when it comes to businesses’ performance in personalization, security, and customer service, adding value to their enterprise and for their clients. Consumer behavior can be tracked along with fluctuating, real-time demand. Using the Saas model, the ability to host data and accommodate complex software requirements is not only easier, but having vast amounts of valuable data on cloud, with greater access, is truly seismic.
  4. AI brings down costs and lessens the chance of errors. Because AI minimizes human action and influence, there is less risk of error with an AI cloud computing model. The system becomes self-learning, meaning an upsweep in quicker decision making, with less people having to be involved. Of course, this will lower costs and increase efficiency. “We will always need people, but an AI integrated cloud module affords a business the best assistance in service and value,” says Bob Carol, a blogger at Draft beyond. “This highly effective model can do it all – analyze both demand and available resources and identify a business’s competition & associated trends in the market, all without the risk of user error.”
  5. AI provides more security. The AI and cloud computing combined model will automatically improve the security of both resources and data. Not only does it dispense with the need for human interference, but it can also immediately detect any suspicious events or cyber interference and block them. A business’s exposure is thereby automatically reduced as they will have a system in place to do everything for them.

AI and cloud computing have the power to revolutionize businesses at each and every tier, with limitless potential in an ever-expanding technological landscape. Key processes, deep learning, scaling a business at every level and every function, and integrating all data seamlessly and swiftly will only serve as a positive impact on businesses in these exciting times for growth and innovation.

How to tackle lack of data: an overview on transfer learning

1, Data is the new oil, but labeled data might be closer to it

Even though we have been in the 3rd AI boom and machine learning is showing concrete effectiveness at a commercial level, after the first two AI booms we are facing a problem: lack of labeled data or data themselves. The increasing number of papers on deep learning demonstrate that researches on AI have developed rapidly recently. If architectures of neural networks and supervised learning are all you know about deep learning, you will be overwhelmed by complications of topics studied these days, for example generative models, making more compact neural net models by for example knowledge distillation, and explainable AI (XAI). Those researches are often conducted on easily available benchmark datasets which you can easily download, often with corresponding ground truth data (label data) necessary for training. However once you try to apply the techniques to more specific data, you usually cannot prepare enough label data which theoretical researches assume. Thus among fascinating deep learning topics, in this article I am going to pick up how to tackle lack of label or data themselves, and transfer learning. Transfer learning is a technique of machine learning to take advantages of knowledge learned in one dataset to deal with a task in another dataset. Presumably due to this fact, Andrew Ng, in his presentation in NeurIPS 2016, gave a rough and abstract predictions of how transfer learning in machine learning would make commercial success like white lines in the figure below. The explanation is straightforward, and given the trends in topics of researches on machine learning these days, this prediction is actually right. But at the same time, in my opinion supervised learning, transfer learning, and unsupervised learning cannot be clearly separated like the graph originally suggested by Andrew Ng. Those fields complement each other, and one can easily shift to another.
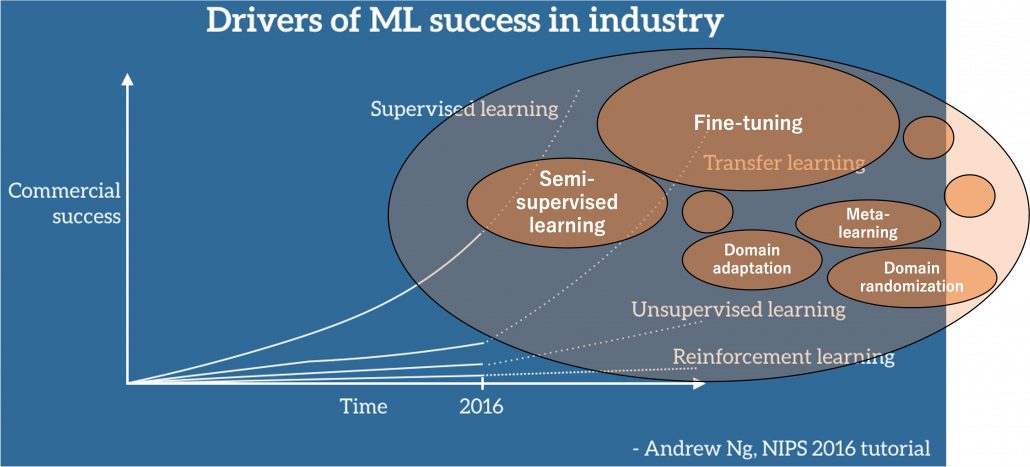
Source: https://ruder.io/transfer-learning/ The lines and texts in white are based on explanations by Andrew Ng. The orange cells are placed at random, so not that they represent commercial success of each field.

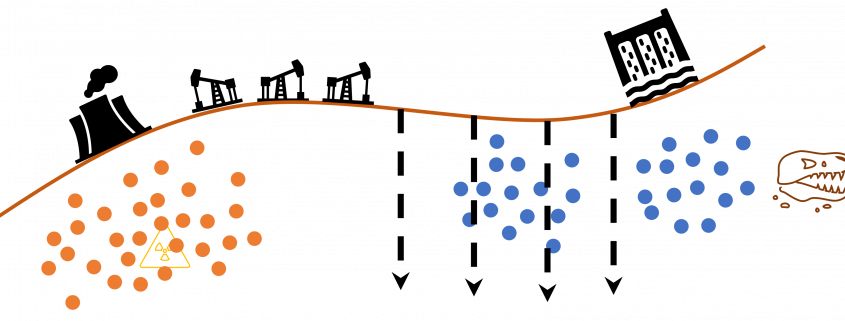
Along with the rapid progress of deep learning mentioned above, a lot of hypes and catchphrases regarding big data and machine learning were made, and an interesting one is “Data is the new oil.” That might have been said only because big data is sources of various industries. But I would say, the characteristic is more striking in training data for machine learning. Distributions of training data for machine learning are more complicated like various energy resources besides oil in the world. Labeled data might be also like uranium. Just as uranium-235 accounting for only less than one percent of uranium in the world can be used to generate energy, only a part of massive data in the world is labeled such that they can be used for supervised machine learning. And as uranium-235 is used effectively jointly with less active uranium-238, labeled data show greater potentials with unlabeled data. And training data for machine learning have another unpleasant analogy to energy resources. Like most mainstream energy resources, only limited companies or institutions would be able to mine and refine huge labeled datasets with gigantic computation resources, and most people more or less need to rely on that for their business. Even though alternative renewable energy resources are proposed, principal energy resources are indispensable for making industries stable. As well, even though a lot of techniques actually have been proposed to lack of data, it often turns out just fine-tuning pre-trained models is the most practical, which need huge datasets and rich computational resources. And I think recent success in for example BERT or GPT made this trend more visible.

*I am sorry in a case I am mistaken about energy resources. I just wanted to come up with some cool metaphors.

But I still think knowing about transfer learning more comprehensively would be effective. That is partly because I have been working on relatively unique data which are hard to even label. As I was studying computer vision (CV) in plant science field, I frequently saw relatively unique data obtained with special apparatuses. Such data are for the most part look far from very general dataset, which huge pre-trained models are trained on. At the same time such plant data have very complicated structures and hard to label. And also in my work, have to detect certain values in various formats in very specific documents, in German. Such data are far from general datasets, and even labeling is hard in that case. We have to carefully tackle lack of data every time on each type of data in that case.

In this article I would first like to explain in the first place what it is like to lack data and next introduce representative techniques to tackle lack of labeled data. Many of them are classified to transfer learning, but other techniques like unsupervised learning or self-supervised learning are used in them or share a lot in their ideas. Thus my main purpose of writing this article is to let you have a richer view on transfer learning. And you would see “transfer learning” these days are mainly about fine-tuning of pre-trained models. Also how to tackle lack of data or labels is in other words how to efficiently achieve good performance in machine learning. Thus even if tons of high quality labeled data are at your disposal, learning those ideas would be still effective to you. I hope you could find some hints of machine learning through my articles.

2, What does lack of data or labels mean in the first place?

We need to first consider what lack of labels or data means, and my answer to the title of this section is “It depends.” The more data you have, the better performances you get. And the bigger machine learning models are, the more data they usually need for training. I assume that people reading this article more or less understand neural networks and how they are trained with back propagation. But let’s review the process here. Most machine learning frameworks are more or less expressed like the figure below unless reinforcement learning is considered. The ultimate purpose of machine learning is to train a model f(\boldsymbol{x}_n;\boldsymbol{\theta}) by adjusting parameters \boldsymbol{\theta}. And the parameters \boldsymbol{\theta} are optimized so that a loss function L is minimized. If it is a supervised learning, the a value of a loss function is denoted L(f(\boldsymbol{x}_n, \boldsymbol{\theta}), \boldsymbol{y}_n) =L(\hat{\boldsymbol{y}}_n, \boldsymbol{y}_n), and it gets smaller as f(\boldsymbol{x}_n, \boldsymbol{\theta}) gets closer to \boldsymbol{y}_n. That is, \boldsymbol{y}_n is giving supervision to adjust f(\boldsymbol{\theta}) via L(\hat{\boldsymbol{y}}_n, \boldsymbol{y}_n). And in a case of unsupervised learning, a loss function is L(\hat{\boldsymbol{y}}_n), which is often heuristically handcrafted.

The very first problem from lacking training data you would learn is overfitting. That is, a machine learning model can be specialized too much for a training dataset, and it loses generalization to other data from the same dataset. It is like students with little imaginations and flexibility gradually memorizing all the answers in a textbook and failing to answer new questions they have not encountered yet. Overfitting is judged by relations of training and validation loss like in the graph below. Training loss in blue indicates how the students adjust to the textbook. The smaller the training loss is, the more they memorizes from the textbook and the less flexible they are. The orange line indicates their performance in newly appeared questions in tests. The smaller the validation loss is, the better the students perform on tests. Thus the students should stop learning with the textbook when the validation loss is about to increase. This is called early stopping in machine learning. And if you increase training data, the orange graph usually shifts to the right side, usually providing smaller validation loss, namely better performance. An important point is, this ideal relations of training and validation losses will not appear if sizes or expressivity of a model is not enough. Thus the more training data you use, the more parameters you need for the model to enhance its expressivity.
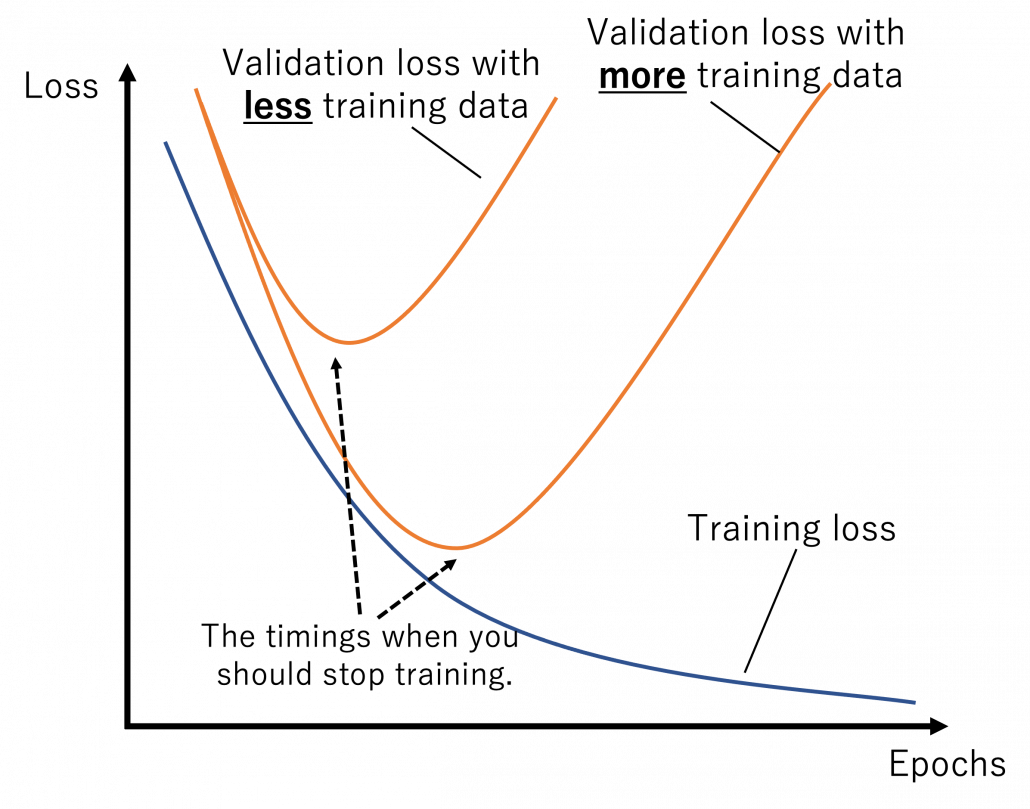
 

*Depending on sizes of training data, the curve of training loss also changes, so please bear it in mind that this graph is not correct and is very simplified.

What I said so far might sound too elementary. My point is, the more data you have, and the bigger computation resource you have, the better performance you get. In other words, machine learning has scalability with data and parameters. This characteristic is clearly observed in models in natural language processing (NLP) and computer vision (CV) like in the graphs below. When I read some papers,often I am very fascinated by their performances. But sometimes it turns out that the methods are mainly creatively in terms of how they increase training data, which is personally boring. And even if performance of GPT looks astonishing, I cannot really like them because of this simple fact.
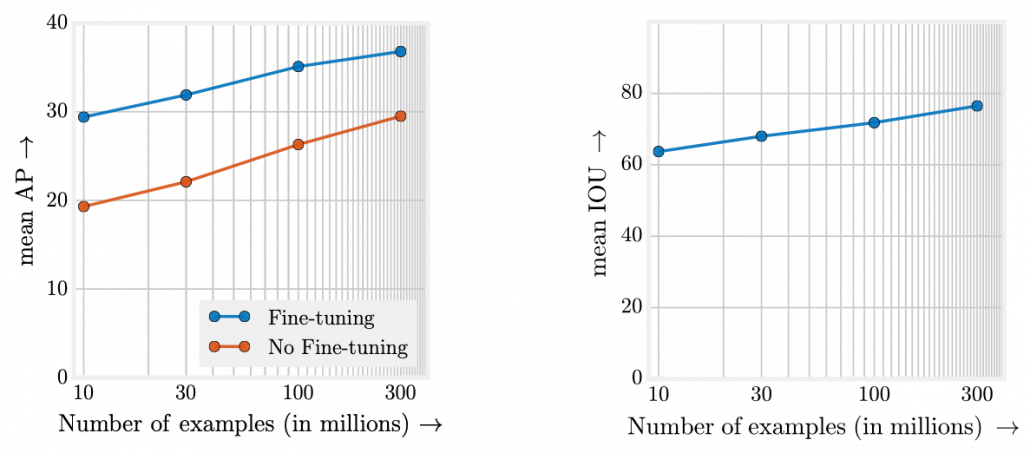
However another important point is, conversely you don’t need to increase training data or parameters of a model once it achieves an ideal score in metrics. When you make a toy model with small training data, as long as your clients or co-researchers are already happy, that is enough. Therefore lack of data or labels has to be discussed depending on sizes of machine learning and their performances you expect. Given those points mentioned so far, my answer to the question “What does lack of data or labels mean?” would rephrased like “If your model is properly designed to reach the performance you expect and it starts overfitting, you are facing lack of data.” And such decisions basically has to be made based on experiments.

3, Types of lack of data

Even though I explained lack of labels or data is a contextual matter, the problems actually exist at any case. That is, you often fail to achieve ideas accuracy partly due to lack of training data. I would like to classify types of situations of data of label shortage as below.

We should first think about the case where lack of labels does not matter in the first place. If you can analyze data with statistical knowledge or unsupervised machine learning, just extracting data without labeling would be enough. And sometimes ad hoc analysis with simple data visualization will help your decision makings. And some dashboards made from those unlabeled data will already give you some insights into data.

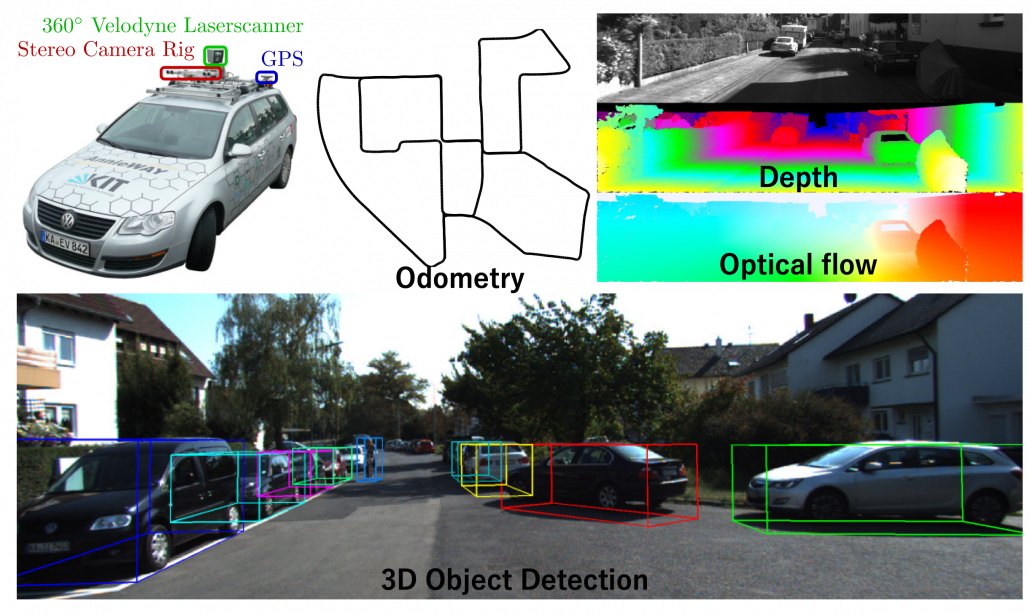
The next case is that, popular machine learning fields with enough investments usually have huge datasets that huge academic institutes or companies have been preparing.  For example KITTI dataset, which include labels like trajectories and depth data, is by Karlsruhe Institute of Technology and Toyota Technological Institute. Such datasets are useful for self-driving-related researches, and many types of ground truth data are provided such as odometry, depth, opticla flow, detection. This kind of data might be considered “enough” only because they are enough for training machine learning models and quantitatively evaluating them in papers, regardless of practical usefulness at a commercial level. But at any rate, popular fields with large benchmark datasets are likely to get investments for commercial uses.
Next let’s see cases of data shortage. You should also keep it in mind that there are also several types of situations of data shortage. In fact there are cases where certain labels are supposed to be scarce such as classifications of imbalanced data, for example anomaly detection, judging spam mails,  or medical examination. In those problems only some percent of data are classified as “errors,” “spam,” or “disease,” and others are classified as “normal.” Just keeping classifying data into “normal” would give maybe more than 95% accuracy. But finding the rest some percent accurately is much more important. In this case model performances need to be evaluated with ROC curves, namely relations of true positives and false positives.

The next type is more related to cases assumed in transfer learning. Some data are in the first place very expensive to obtain. For example CT images have to be stored by special medical apparatuses as you know. And even if a lot of CT images are already obtained, annotating the images often needs professional skills, thus its annotations cost is high. Another case of high annotation cost is for example detection or segmentation of objects in images. Even if you can collect numerous images on the Internet, annotating bounding boxes or pixel-wise segments require a lot of time. Annotating around 1000 images  for classification might be ok, but annotating them at a pixel level is really time consuming. If you have a tablet, I would like you to paint each segment of objects in a picture with different colors. And you should multiply the time spent by 80,000, as many as the training images needed for Mask R-CNN, a popular model for instance segmentation. As you can imagine, it is a huge tediou work. Even preparing some 50 labeled images for fine-tuning is paiful, and even annotations for computer vision tasks itself is also a field of deep learning.

*I would say medical image processing is a relatively popular field in CV with deep learning, and there are several famous datasets on this field.

4, An overview on ways for dealing with lack of labeled data

I am going to first roughly introduce what kind of approaches can be taken to deal with lack of labeled data or data itself, but you should also keep it in mind that they are not clearly separated. Just as I am going to explain, one type of techniques can easily shift to another type. You should flexibly switch among them depending on your situations. And also please keep it in mind that these are well-studied areas, and tons of ingenious papers are announced one after another, usually giving slight changes in their performances. Problems I point out about each technique might not be a problem anymore with recently published researches on researches currently peer-read. It is hard to prove that something does not exist. Given those points, I think it is convenient to classify technique of dealing with label or data shortage as below.

Through this article, ideas of domains are important. A domain simply means a combination of a dataset and a task with it. Transfer learning is a family of machine learning techniques to make uses of knowledge learned in a domain to another domain, and the former is called a source domain, the latter a target domain. And discrepancies between a source domain and a target domain is called a domain shift. The figure below abstractly visualize examples of domains and domain shifts. Intuitively it is easy to imagine that face a CV task and an NLP task have bigger domain shifts than domains of leaf images taken from different angles, but quantitatively evaluating domain shifts is in practice hard, and I am not going to introduce the topic because that will need a lot of mathematics.

Instead of formulating transfer learning, I would like to take learning languages as an intuitive example of transfer learning. Most people master at least one native language before learning another one. Baby brains are a kind of fantastic machine learning models, and after overcoming many obstacles they master native languages. And people take advantages of their mother tongues to learn another language. Usually they learn foreign languages by comparing structures of translated sentences. And naturally, if both a foreign language and your language have analogies like grammatical cases or genders in common, language learning would be easy. In other words, proficiency in one language is helpful in leaning some language. But it is also possible that your native language badly affects learning the second language, due to grammatical structures, pronunciations. The case of a source domain deteriorating performances in a target domain is called negative transfer and contexts of transfer learning.

*I know similarities languages are not the sole and definite barometers of effectiveness in learning foreign languages. Sizes of economy or markets in a country would also affects English language acquisition of people there. But at least it is unfair to compare for example German or Dutch people learning English with Japanese, Chinese people learning it. Unlike Eastern Asian people who have to learn thousands of characters to at least read decent texts or who use very different grammars, European people obviously can use “transfer learning” to learn English.

5, Increasing training data

When you lack data or labels, the most straightforward and often quick solution is to just increase data. The two topics I will cover in this section are mainly conducted in one domain.

Data augmentation

Data augmentation is one of the first techniques you would learn to mitigate overfitting of machine learning, which is in short caused by lack of data. The idea is very simple and it is implemented well in deep learning libraries, so I would only briefly talk about it here. The idea of data augmentation is simply transforming input data by for example flipping, rotating, zooming, changing colors. By doing so for example an input image \boldsymbol{x}_n of a butterfly below with a label of \boldsymbol{y}_n = \text{Butterfly} can be converted to more than 6 images. This corresponds to getting a converted \boldsymbol{x}'_n= g(\boldsymbol{x}_n) in the machine learning outline in the last section. And this process is the same as increasing the size of a dataet \mathcal {D}. And one point you have to be careful is, you must not change \boldsymbol{x}_n too much to change corresponding \boldsymbol{y}_n. For example if \boldsymbol{x}_n is distorted too much, it cannot be recognized as \boldsymbol{y}_n anymore even by humans. Or if you rotate an image of a digit 6 180 degrees, its becomes 9. Recent researches focus on automatically find what kind of data augmentation is effective by using for example reinforcement learning.

Here let me take an example of data augmentation technique that would be contrary to your intuition. A technique named mixup literally mix up data with different classes and their labels. In classification problems, labels are expressed as one-hot vectors, that is only an element corresponding to a correct element is 1 and the others are 0. In a case of binary dog-or-cat classification, each label is \boldsymbol{y}_n = (1, 0)^T or \boldsymbol{y}_n = (0, 1)^T, respectively. In data augmentation, distorting data too much is a taboo because label data is contaminated, but in mixup you literally mix up labels. Randomly choosing a two inputs \boldsymbol{x}_n , \boldsymbol{x}_{n'} and a  number \lambda \in [0,1], you prepare a input and label pair (\lambda \boldsymbol{x}_n + (1 - \lambda) \boldsymbol{x}_{n'},  \lambda \boldsymbol{y}_n + (1 - \lambda) \boldsymbol{y}_{n'}). The figure below is an example of a mixing up a cat input and a dog input, and corresponding labels. It is known augmenting training data like this improves classification performances. It is said this is partly due to machine learning models effectively learning decision boundaries. In classification ambiguous inputs are bottlenecks, so learning to giving ambiguous outputs to ambiguous inputs can enhance classification abilities.
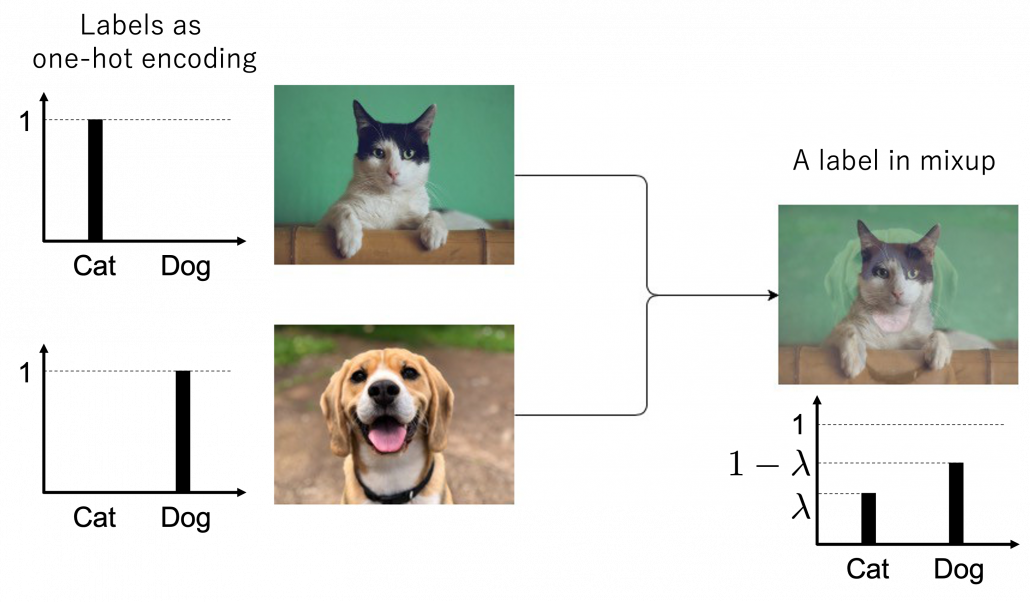
*One-hot-encoded labels are called hard labels, and otherwise soft labels. Recent topics in deep learning, such as lottery hypothesis, knowledge distillation, imply that whether supervising labels are hard or not is important in deep learning. Hopefully I would like to explain why little by little in my articles.

6, Active learning

Active learning is about how to annotate data and get labeled data efficiently. Labels of data do not equally contribute to enhancing machine learning models, and labels actually have qualities. Even if you give apparently similar images with the same label to machine learning models during training, the models cannot learn so much from the pair of data. You need to efficiently dig data to know its distribution by giving labels to samples. I think a good metaphor is geological survey by excavating with some boring. In order to know substances or features of ground, some earth need to be sampled with boring. But you cannot freely penetrate everywhere mainly due to costs. They need to be sampled one by one due to uncertainty about the ground.
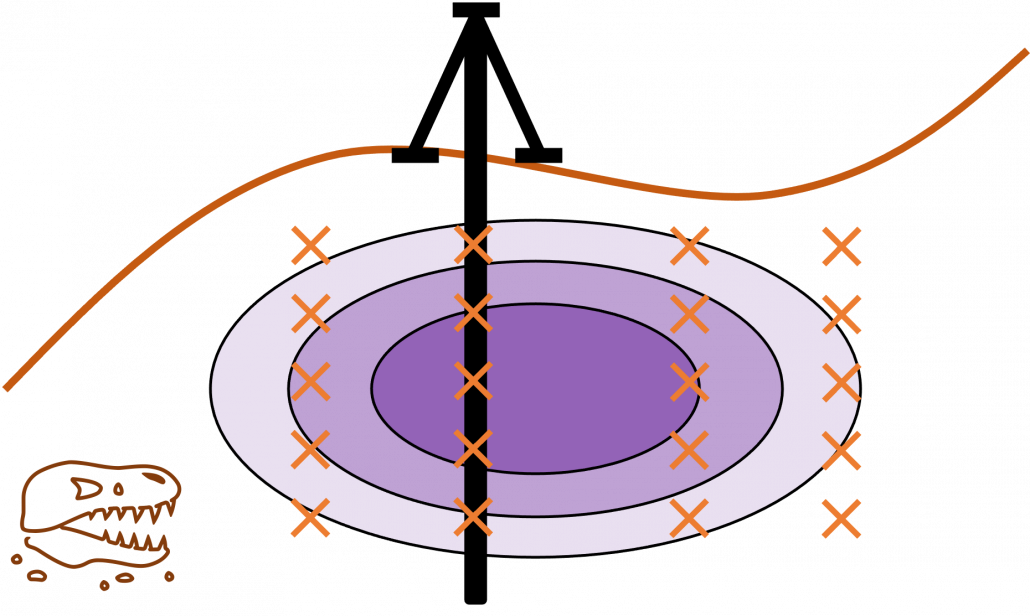
 

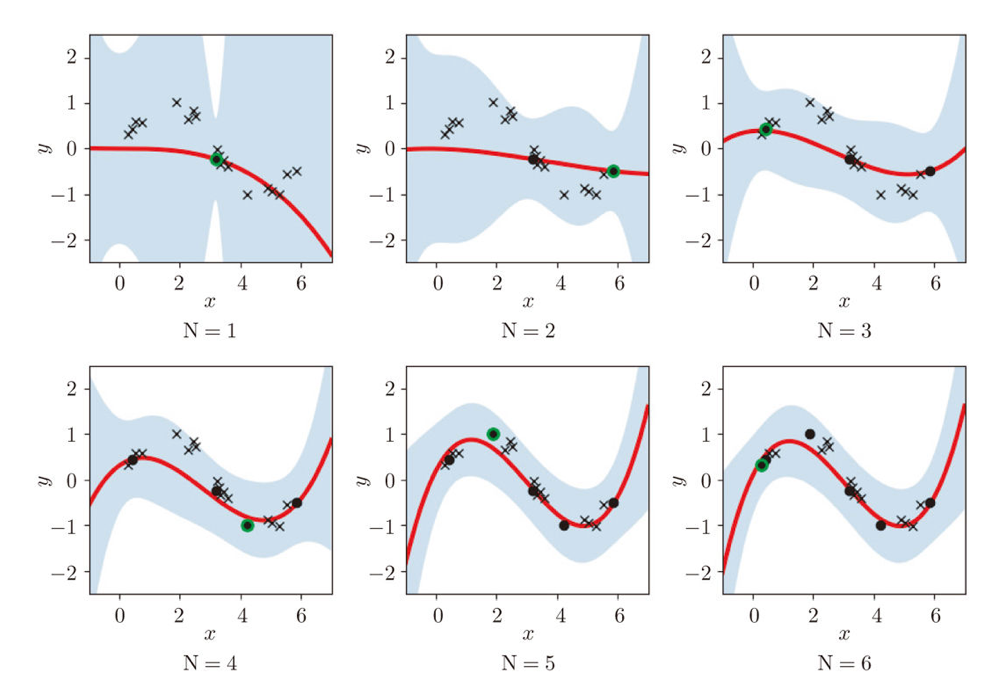
Similar approaches are often taken in machine learning or statistics, that is estimating distributions of data with a small size of samples is an important idea. A basic idea for doing that is you sample or annotate data which decreases uncertainty of your model the most. The figure simply exhibits the idea. We want to regress a data distribution with the red curve, and the cross marks can be sampled from the distribution. And the part filled with light blue shows uncertainty of the model to predict a value of y for a x. When you want to regress the data with as few samples as possible, data points should be sampled from the parts with great uncertainties. And by doing so, you can see that the data is regressed efficiently with few samples.
We have seen that modeling uncertainty is the key to active learning, and that can be applied to annotations of data in deep learning. An example of the process is displayed below, and in this case a deep neural network model (DNN model) is trained with some labeled data, and you give some signals for data annotations based on uncertainty of outputs of DNN models. And human annotators prioritize giving labels to the data. Such uncertainly can be estimated by using entropy of outputs or modeling data distributions.
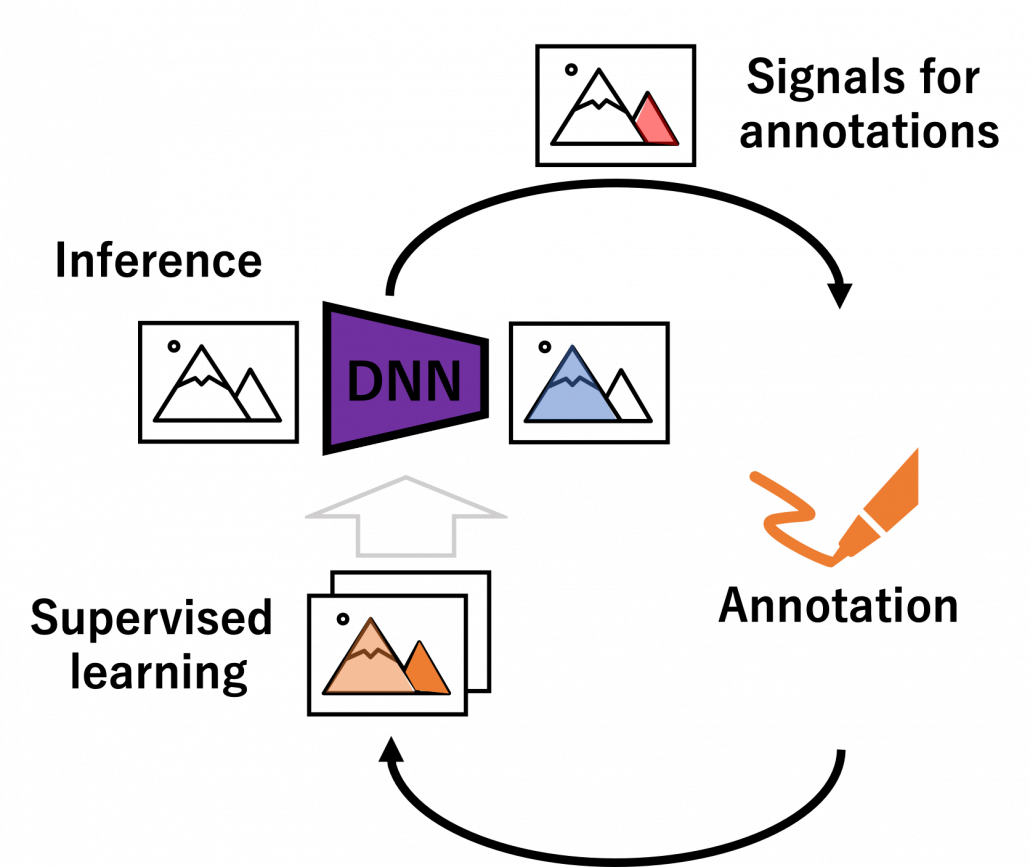
 

But when you get a certain amount of labels, the situation will be the same as semi-supervised learning, which I will explain next. That is, you might be already able to make the most of the labels so far with the help of unlabeled data. You should consider stopping labeling and start labeling depending on situations. And importantly, starting naively annotating data might become a quick solution rather than thinking about how to make uses of limited labels if extracting data itself is easy and does not cost so much. “Shut up and annotate!” could be often the best practice in practice. And annotations would be an effective way for exploratory data analysis (EDA), so I recommend you to immediately start annotating about 10 random samples at any rate.

7, Dealing with lack of labels in a single domain

In many cases, data themselves are easily available, and only annotations costs matter. The following two topics consider such cases, and again only one domain is considered. But by the end of this article you would see that other techniques covered in this article have a lot of analogies with topics introduced here.

Semi-supervised learning

Semi-supervised learning is a type of supervised learning where only limited labels are available in one domain. This is important in because many of other techniques in this article can be seen as semi-supervised learning from certain points of views. The figure below shows an intuition on semi-supervised learning in a case of classification task. In this case, original data distribution have two clusters of circles and triangles and a clear border can be drawn between them. But only with limited labeled data, decision boundaries would be ambiguous. However in fact, with a help of unlabeled data in dotted lines, machine learning model might be able to recognize two clusters with a help of unlabeled data. In other words, unlabeled data help models learn distribution of data. this might be natural as clusters of data can be estimated with unsupervised learning.
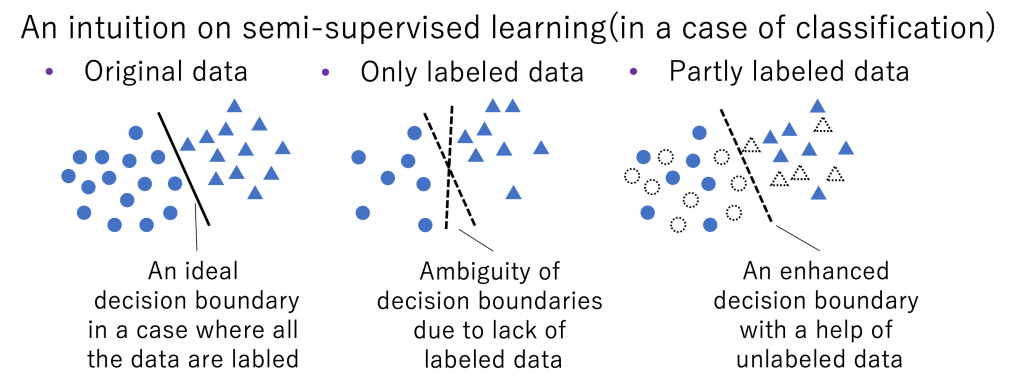
*As I have already mentioned, active learning could soon shift to semi-supervised learning, and it might be worth trying it before finishing labeling. But suspending labeling and resuming it later might not be efficient. At any rate you need to be flexible depending on situations.

Semi-supervised learning is applicable to several tasks, not only classification. I explained that normal supervised learning is adjusting parameters \boldsymbol{\theta} of a model f(\boldsymbol{\theta}) so that it minimize loss function L(\boldsymbol{\theta}, \mathcal{D}_{\text{L}}) for a labeled dataset \mathcal{D}_{\text{L}}. In semi-supervised learning, we assume that usually a bigger unsupervised dataset \mathcal{D}_{\text{UL}} is available in the same domain. And semi-supervised learning optimize \boldsymbol{\theta} by jointly minimizing L(\boldsymbol{\theta}, \mathcal{D}_{\text{L}}) + L'(\boldsymbol{\theta}, \mathcal{D}_{\text{UL}}) after designing a loss function L'(\boldsymbol{\theta}, \mathcal{D}_{\text{UL}}) for the unlabeled dataset. There are following 3 major ways of semi-supervised learning depending on how you design a L'(\boldsymbol{\theta}, \mathcal{D}_{\text{UL}}).

  • Consistency regularization: adding slight changes to data \boldsymbol{x}_{\text{UL}} in \mathcal{D}_{\text{UL}} and get \boldsymbol{x}'_{\text{UL}}. And training f(\boldsymbol{\theta}) so that f(\boldsymbol{\theta}, \boldsymbol{x}_{\text{UL}}) and f(\boldsymbol{\theta}, \boldsymbol{x}'_{\text{UL}}) give out a consistent output.
  • Pseudo label: after training f(\boldsymbol{\theta}) with \mathcal{D}_{\text{L}}, using some estimations f(\boldsymbol{\theta}, \boldsymbol{x}_{\text{UL}}) as labels of \mathcal{D}_{\text{UL}} .
  • Entropy minimization: encouraging outputs f(\boldsymbol{\theta}, \boldsymbol{x}_{\text{UL}}) to have smaller entropy.

More or less similar ideas show up in different transfer learning techniques, so it would be effective to learn the three semi-supervised learning ideas above.

Self-supervised learning

Self-supervised learning is often counted as unsupervised learning. Both unsupervised and self-supervised learning do not need label data, but especially when labels generated by processing themselves, that is often called self-supervised learning. A representative case of using self-supervised learning is auto-encoder. Simpler labels can be generated from input data themselves with elementary data processing. For example in a case of image processing, by rotating an input image 0, 90, 180, 270 degrees respectively, a classification task of estimating rotation degrees can be made. Another case is estimating the original input image after some simple image processing (for example colorization).  These simple tasks generated solely from an input is called pretext task. And in a case of image processing, deep learning models can be prompted to learn image features .

Source: https://atcold.github.io/pytorch-Deep-Learning/en/week10/10-1/

Pretext tasks are applicable also to other fields for example NLP. A very simple task is hiding a part of an input sentence, and let neural networks estimate the blank word. And this is a basic idea of how to train BERTs, famous pre-trained NLP models. BERT models are trained this way with a huge and very general corpus without any specific topics. By doing so BERT model can already learn to detect some clusters of meanings in texts, as I visualize in the next section. But if you fine-tune BERT models with labeled texts with very specific topics, that often fails to achieve satisfying performance. In that case, the BERT models have to “get used to” the new dataset. In that case, BERT can “get used to” the new dataset by applying self-supervised learning on the new dataset. This tutorial of Huggingface demonstrates this with an example of adjusting a BERT model trained with Wikipedia to the IMDb dataset.

In the case above, the BERT model is fine-tuned with relatively lots of unlabeled data and after that trained with fewer labels. As a whole this can be seen as semi-supervised learning ,with fewer labels of the IMBb dataset and more unlabeled data. Also the ideas of pretext tasks, which prompt models to give consistent outputs given preprocessed inputs, have some analogies with consistency regularization in semi-supervised learning.

*The Huggingface tutorial says, they fine-tune a pre-trained BERT model trained in a self-supervised way to adjus it, and they call it “domain adaptation.” As you can see from the statement, distinctions of topics covered in this article can be just ambiguous.

8, Dealing with lack of data or labels over several domains

Another approach for tackling label or data shortage is taking advantages of other domains, which are usually larger and have enough labels. And such techniques is called transfer learning as I mentioned. It seems like transfer learning in business refers to “fine-tuning” explained below, but in academic contexts it is often also said transfer learning is almost synonym to “domain adaptation.” At any rate, my point is it would be more important to have comprehensive view on the techniques rather than clearly distinguishing them.

Fine tuning

Fine tuning would be the easiest way of transfer learning, and at the same time it is very powerful. Even though I am going to introduce other technique of transfer learning, more often than not it turns out that fine tuning can compensate them. Here I will only explain what it is like to use fine-tuning. I would say using fine-tuning is easy like using instant coffee. Conventionally you needed to train your original model with your own data, and that is very affected by sizes of data you have. I would say, that was like making coffee or coffee cakes from coffee you made from beans. But by using pre-trained models already trained somewhere with huge datasets, you can use models which can already more or less recognize data. The idea was very normal already in the field of CV, and NLP got the same idea with the advent of BERT, or already with word embeddings. That is like people learned to use instant coffee instead of roasting and brewing coffee every time.
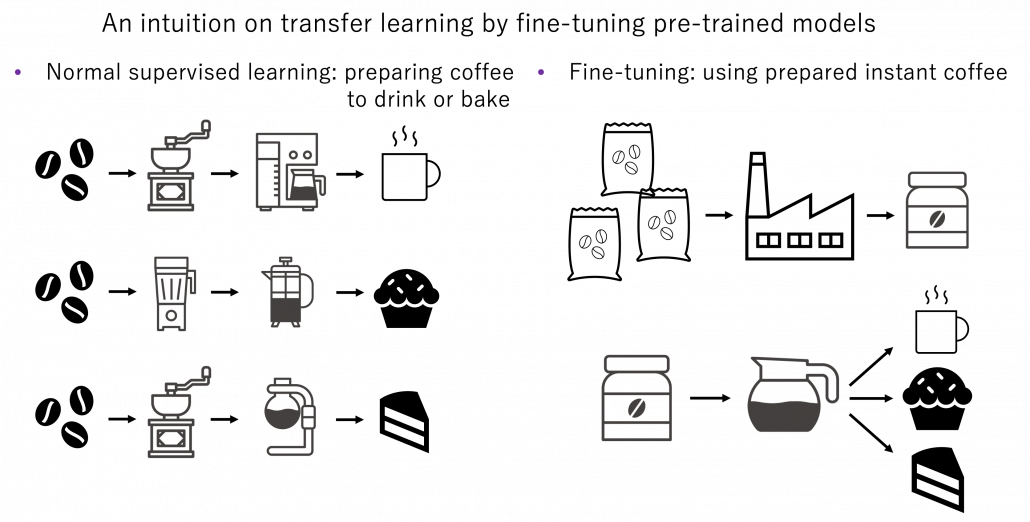
How such instant coffee is made depends on which type of deep learning is used on a huge dataset. Backbone CNN is usually trained on ImageNet dataset with supervised learning of a classification task. In case of BERT, it is trained with a huge corpus with a pretext task of estimating blank words of input sentences, which is classified to self-supervised learning. Let me more practically what the “coffee syrup” means. Machine learning is at any rate just mapping of tensors or vectors. In CV, an input images as a tensor is converted into a a vector or a tensor, and tasks like image classification are conducted with the converted tensor or vector. In case of an NLP task, usually a sequence of vectors is converted to a vector or another sequence of vectors. And these resulting tensors of vectors from models are the very “coffee syrup” I am talking about. An important point is, fine-tuning also considers transfer learning between different tasks. Backbone CNNs are usually trained with classification, BERT with self-supervised learning, but the there are a variety of final tasks. They are called downstream tasks. In other words, you don’t necessarily drink instant coffee as coffee.
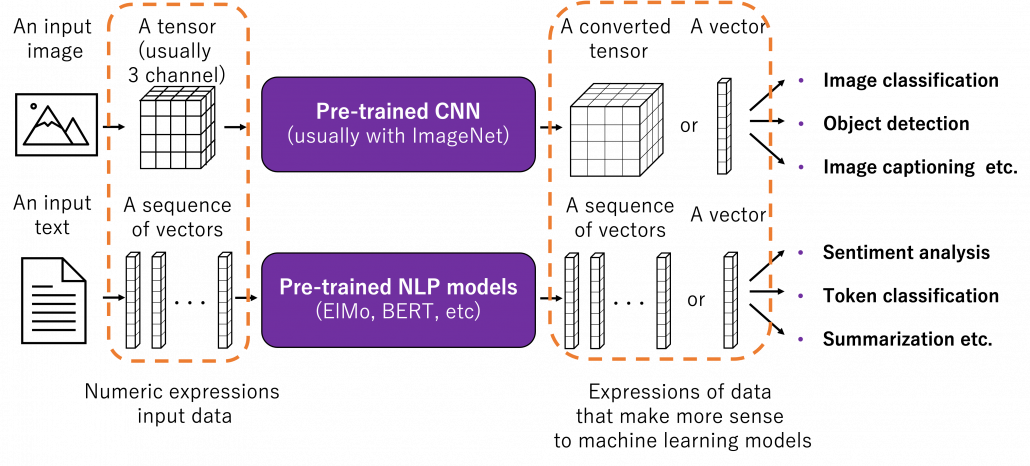
 

The two figures below are visualizations what the “instant coffee syrup” means. I processed random N images in a dataset with a pre-trained backbone CNN, and I got corresponding D dimensional vectors, that is a N\times D tensor. And I applied t-SNE to reduce its dimension from D to 2 and got a N\times 2 tensor.  The figure below shows arrangements of input images in the 2 dimensional space. As you can see, semantically similar images get closer.

Just as well, if you process random texts with BERT and apply a dimension reduction, you get a visualization like below. As well as the figure above, texts in similar topic get closer.
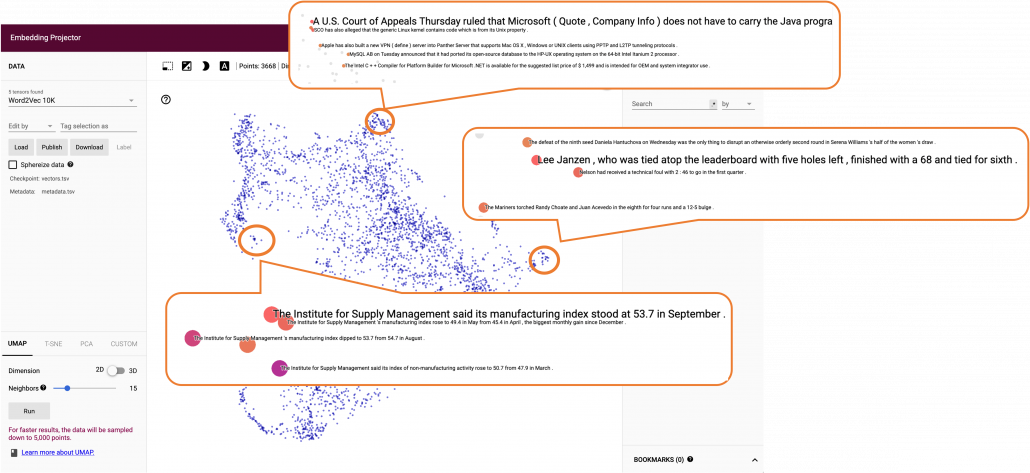
To make it catchy I expressed them as “coffee syrup” but this is a kind of how so-called AI sees data. Images and texts are just vectors or tensors on computer, and AI process another set of tensors of vectors in spaces which make sense to them.

Fine-tuning is quite easy. You have only to train a pre-trained model you downloaded just like normal supervised learning with your dataset. And when you train CV models with backbone CNN, the backbone is almost automatically downloaded. You have to be careful about some points, for example you have to set learning rate smaller. Let me avoid too detailed points in this article. Hopefully in the future, I’d like to write about more practical fine-tuning tips.

Domain adaptation

Domain adaptation is another family of techniques to make uses of knowledge gained in one domain in another domain. Domain adaptation is a Domain adaptation is these days often used as almost a synonym of transfer learning. But papers on domain adaptation usually assume to handle the same tasks both in a source and a target domain. So I would say domain adaptation is a subfield of transfer learning. Domain adaptation is more of how to tackle deterioration of machine learning performances when trained models are applied in different domains. Based on how much labels are available in each domain, domain adaptation is classified to several types. And unsupervised domain adaptation (UDA), where labels are available only in a source domain, is considered as the most challenging and studied well.

*Another explanation I often hear about domain adaptation is, when a models trained on a dataset is trained on another data, domain adaptation can be used to mitigate decreases in performance. I think in this context, performance of the model on the source domain is not discussed. When you apply some retraining with a new dataset, performance of the model on the source domain often drastically decrease. This is called catastrophic forgetting, and techniques like continuous learning are studied to tackle this problem. I have not really seen continuous learning in contexts of domain adaptation, but I thin these are related.

There several approaches in domain adaptation, and one frequently used approach is using adversarial loss. As we saw with the example of getting “coffee syrup,” data is first mapped into a certain space, and this is often called feature extraction. And outputs with the feature extractor are processed are processed more to give task-specific results with some networks. Often in domain adaptation, we put a domain discriminator network right after the feature extractor. And the domain discriminator classifies whether the features extracted come from the source or target domain. The feature extractor tries to extract features the domain have in common, and the domain discriminator tries to distinguish them, and two networks compete. In this way, the feature extractor and the domain discriminator form generative adversarial network (GAN), and the feature extractor learns to extract features that are hard to distinguish their domains. Feature extractor is trained so that it extract domain invariant features, for example edges and silhouette.

As well as in other transfer learning techniques, one ultimate goal of UDA is training a deep learning model only with synthetic labeled data, for example CGI, and apply the model on a totally unlabeled dataset. Converting a source domain to look like a target domain with Cycle GAN is an often used approach in domain adaptation. In domain adaptation a source domain is supposed to be easier to annotate. The figure below is an example of converting a black and white cell images  to colored images.

*You could easily try converting data with Cycle GAN by preparing two datasets, and I made the converted data by myself. But you need at least one GPU to try that.

However some people insist that usefulness of UDA is very questionable. In the first place, if you do not have any labels on the target domain, that means you cannot evaluate anything qualitatively on the dataset of interest. And if you can prepare some of evaluation data or labels, applying other techniques like fine-tuning might be enough.

Meta learning and few-shot learning

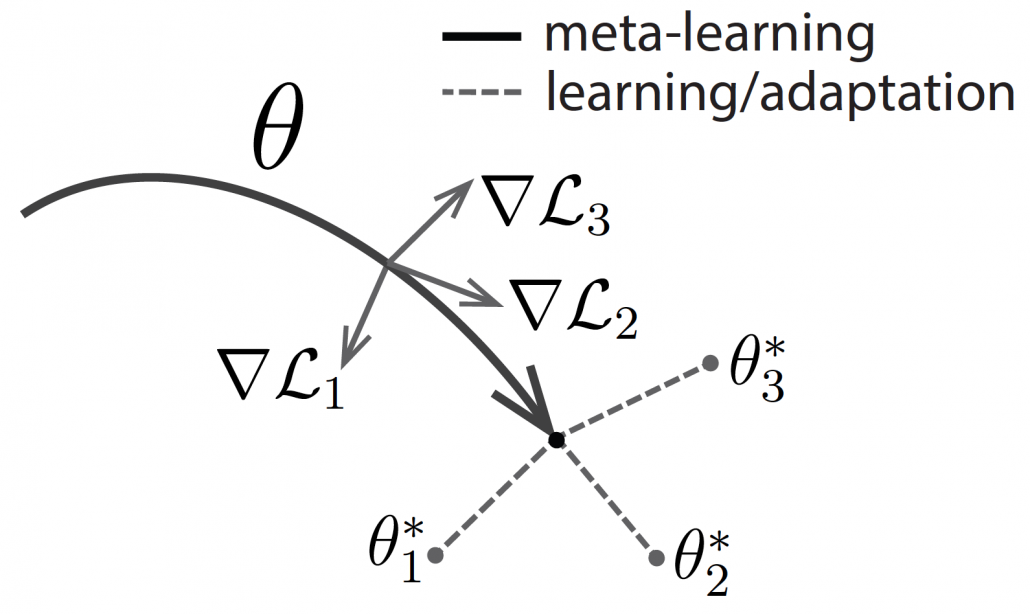
One simple way to explain meta learning is that, it is a machine learning technique teach models to learn efficiently. We can also say that it is a transfer learning case where target domains are unknown.  A famous meta learning method is Model-Agnostic Meta-Learning (MAML). MAML is used to get an ideal parameter \boldsymbol{\theta} which can be quickly and effectively used to new tasks. Like in the figure below, \boldsymbol{\theta} reaches the generally convenient parameter shown as the black dot. And the parameter can quickly reach the parameters \theta_{i}^{\ast}, which effective for each task.

Another interesting application of meta learning is few-shot learning. Few-shot learning trains a classification model to learn to acquire classification ability based only on a very few samples. By letting the models learn classification tasks over many episodes, the model learn comes to learn efficiently from limited data samples at a test phase. The figure below shows a case of few-shot learning, where a model learns some episodes of 3-class classifications with only 4 samples per class. Few-shot learning attempts to enable human-level flexibility of perception. MAML is known to be effective also for few-shot learning.
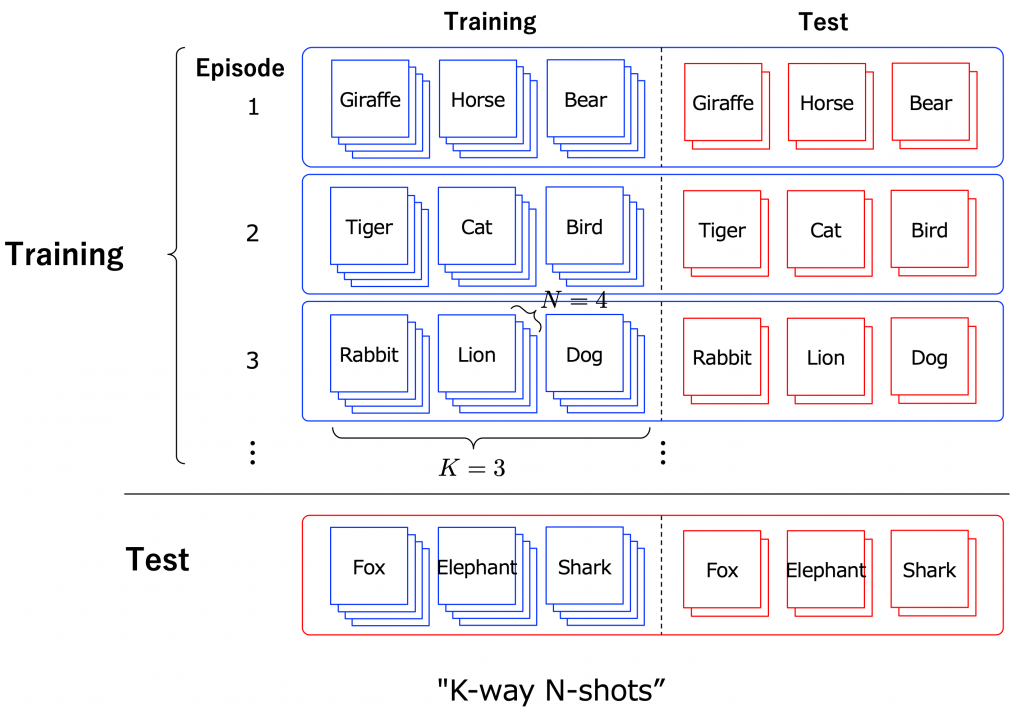
However, studies these days do also show that fine tuning pre-trained models with a few sample data show competitive results to those by few-shot learning. Similar things can be said about large language models like GPT. Chat GPT or GPT-3/GPT-4 for example can be fine-tuned with small extra training samples, and the logic behind is different from meta learning. Fine-tuning pre-trained models rather might be closer to human learning. Humans can effectively learn new topics based on what they have experienced so far. Thus again here, fine-tuning models can be an easier and realistic solution.

I have explained an overview of machine learning techniques for handling lack of data, and as you might have noticed, fine-tuning models could be enough in many cases. I am not sure how much other transfer learning technique would be widely as useful as fine-tuning at a business level. At least, I hope this article would be a rough guideline for machine learning tasks with small sizes of data or labels. And if you have a chance to work on very unique data with very few labels, you wouldn’t be able to rely so much on only naive fine tuning of pre-trained models. In that case you should consider some techniques introduced here. Hopefully someday I would like to write more detailed tutorials with each transfer learning technique.


Cloud Data Platform for Shopfloor Management

How Cloud Data Platforms improve Shopfloor Management

In the era of Industry 4.0, linking data from MES (Manufacturing Execution System) with that from ERP, CRM and PLM systems plays an important role in creating integrated monitoring and control of business processes.

ERP (Enterprise Resource Planning) systems contain information about finance, supplier management, human resources and other operational processes, while CRM (Customer Relationship Management) systems provide data about customer relationships, marketing and sales activities. PLM (Product Lifecycle Management) systems contain information about products, development, design and engineering.

By linking this data with the data from MES, companies can obtain a more complete picture of their business operations and thus achieve better monitoring and control of their business processes. Of central importance here are the OEE (Overall Equipment Effectiveness) KPIs that are so important in production, as well as the key figures from financial controlling, such as contribution margins. The fusion of data in a central platform enables smooth analysis to optimize processes and increase business efficiency in the world of Industry 4.0 using methods from business intelligence, process mining and data science. Companies also significantly increase their enterprise value with the linking of this data, thanks to the data and information transparency gained.

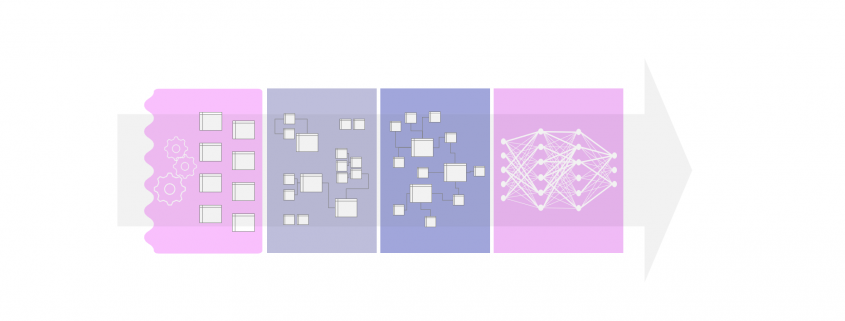
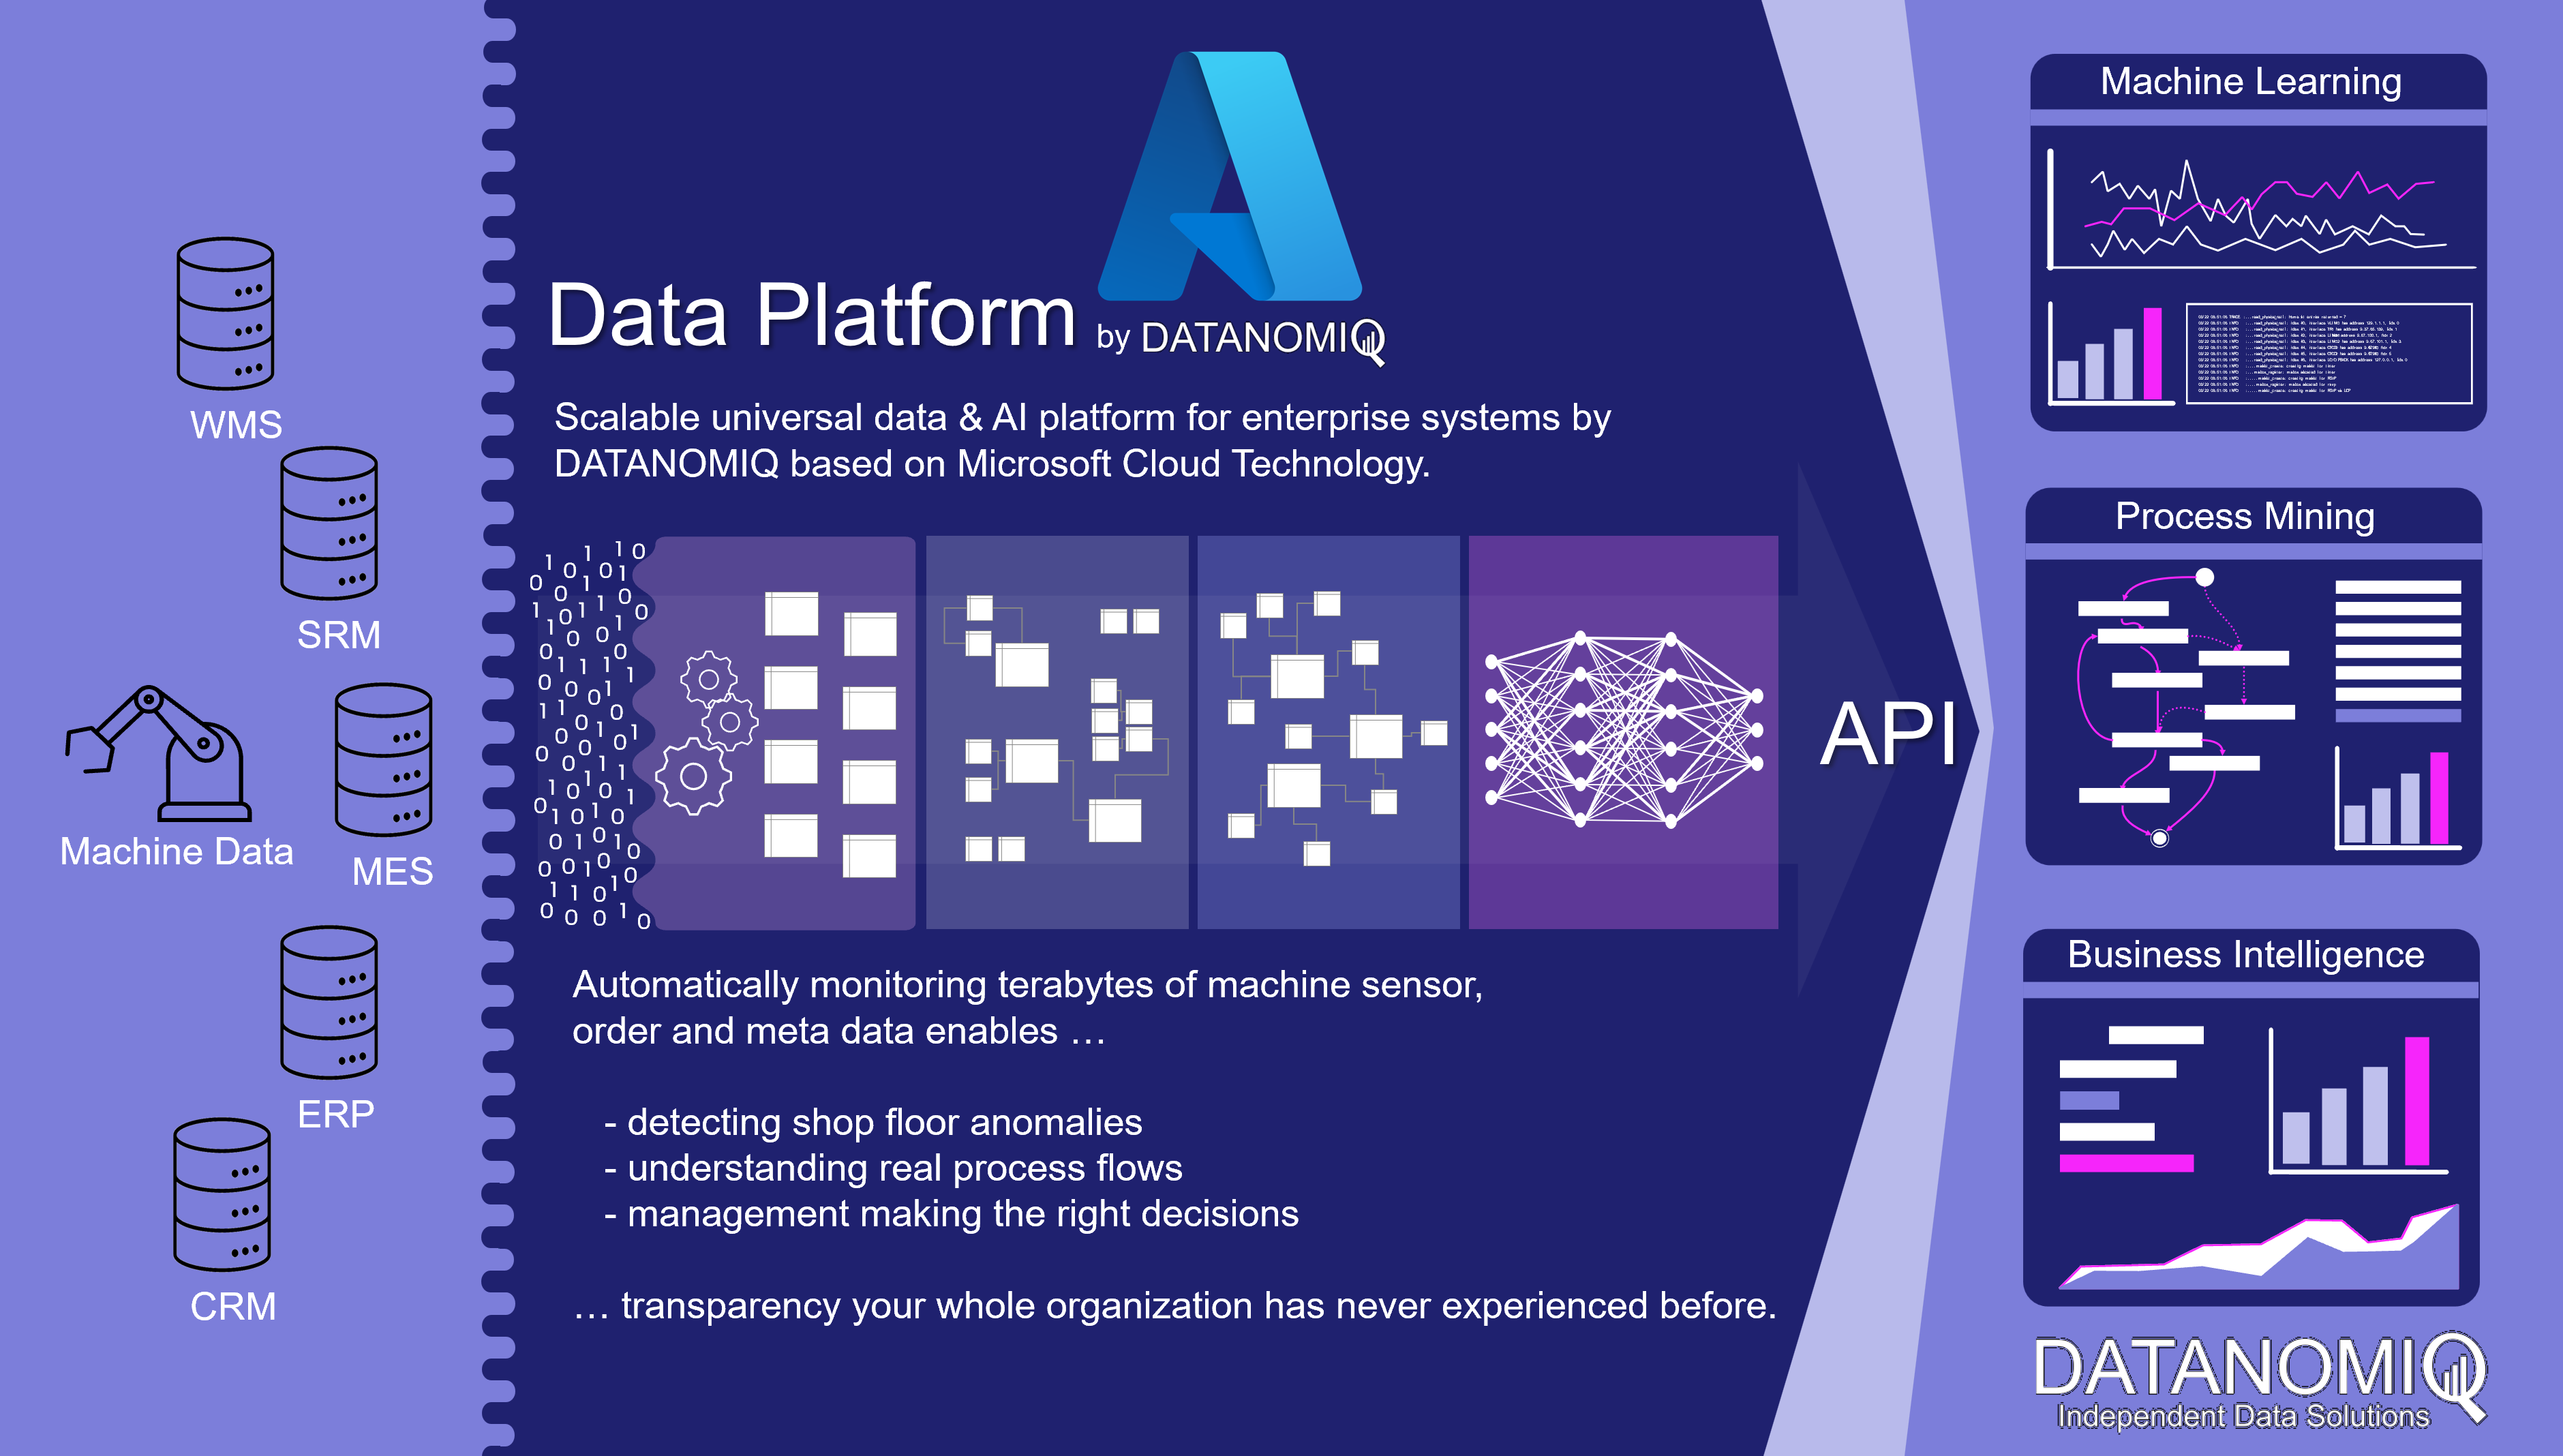
Cloud Data Platform for shopfloor management and data sources such like MES, ERP, PLM and machine data.

Cloud Data Platform for shopfloor management and data sources such like MES, ERP, PLM and machine data. Copyright by DATANOMIQ.

If the data sources are additionally expanded to include the machines of production and logistics, much more in-depth analyses for error detection and prevention as well as for optimizing the factory in its dynamic environment become possible. The machine sensor data can be monitored directly in real time via respective data pipelines (real-time stream analytics) or brought into an overall picture of aggregated key figures (reporting). The readers of this data are not only people, but also individual machines or entire production plants that can react to this data.

As a central data architecture there are dozens of analytical applications which can be fed with data:

OEE key figures for Shopfloor reporting
Process Mining (e.g. material flow analysis) for manufacturing and supply chain.
Detection of anomalies on the shopfloor or on individual machines.
Predictive maintenance for individual machines or entire production lines.

This solution scales completely automatically in terms of both performance and cost. It looks beyond individual problems since it offers universal and flexible scope for action. In other words, it will result in a “god mode” for the management being able to drill-down from a specific client project to insights into single machines involved into each project.

Are you interested in scalable data architectures for your shopfloor management? Or would you like to discuss a specific problem with us? Or maybe you are interested in an individual data strategy? Then get in touch with me! 🙂

Phishing: An Overlooked Threat to Business and Data

Data is the lifeblood of an organization and businesses that fail to embrace this fundamental concept risk losing future business opportunities or the company itself. The value of business and consumer data hasn’t been lost on cybercriminals, which is why phishing attacks and other data security threats have been more rampant through the years. As data technology becomes more advanced, reliance on data becomes a more significant opportunity for exploitation as even the most advanced data systems have their vulnerabilities. Businesses collect and process large amounts of data from several sources, making the protection of this data one of their main challenges.

The Threat to Business and Data

Today’s businesses demand a lot from the data they collect, and as such, also look for solutions that will help transform data into more tangible bits and pieces that will help promote business success. The role of AI in cybersecurity has been gaining mainstream attention because it helps automate the detection of security threats and other malicious activities within a company’s systems. 

Looking to more advanced solutions for cybersecurity is a prudent approach, and is highly recommended, especially for businesses that handle large amounts of data daily. Cybersecurity threats are no laughing matter, and they’re becoming more advanced and difficult to identify and address. The end goal remains the same, however—to gain unauthorized access to data and use it to harm a business or for personal gain. The threats come in many forms, including DDoS attacks, malware, and phishing attacks.

Cybersecurity threats are serious not only due to the potential loss of data but also because a data breach can cause irreparable harm to a business. Give cybercriminals access to sensitive data and there’s no telling what damage they’ll cause. Even a simple phishing scam can lead to a full-blown data breach, and these breaches rely on users making mistakes

Recognizing Phishing Scams

Before businesses can combat scams, they must train their employees on the detection and proper ways of addressing or preventing them altogether. Below are the most common types of phishing attacks done against businesses.

Phishing Emails

Phishing emails are common in a business email inbox—typically categorized together with spam emails. The difference is that they are not simply unsolicited marketing messages; they are designed to trick you into opening a malicious attachment or clicking on a link to a fraudulent website. Scammers often use an email address that resembles a legitimate business email address to confuse users into thinking that the email came from someone within the organization or a trusted partner or a third party.

Company Impersonation

This method is a type of phishing scam in which scammers try to impersonate your brand. This is often done via “domain spoofing” or using a fake but similar website or email domain designed to confuse the recipients of the email. It can be difficult to detect as a source of a data breach because it’s often unreported. Victims of these scams often aren’t aware that they’ve been duped until it’s too late.

Phone Phishing/Voice Phishing

This is similar to company impersonation but uses a different medium—Voice over Internet Protocol (VoIP). Most scammers who use this method go so far as to imitate the tone of voice and spiels of the brands they’re trying to impersonate. This is usually done in conjunction with other phishing scams to increase the chances of success.

Spear phishing

This is similar to phishing emails but with a more targeted approach. It involves more effort on the scammers’ part because it entails getting key information about a target. Using this method, the scammers send an email containing the name of a company officer and other personalizations to make the recipient believe that the email is legitimate. Unsuspecting users will be duped into sending money, pertinent information, or making payments to a fake vendor or partner. It’s a sophisticated scam that can often trick even tech-savvy individuals, depending on how skillfully the fake email message is crafted.

Email Account Takeover

It’s one thing to have scammers send fake emails and try to make them look legitimate, but it’s another when they get access to a legitimate email account and use it to get money from unsuspecting users, gain access to sensitive information, or cause harm to a business. It’s typically done as part of a cross-account takeover, in which a scammer gains access to a user’s email account, changes the password, and proceeds to make fund transfers from the compromised user’s bank and other financial accounts.

Why Cyberattackers Resort to Phishing Scams

Phishing scams are one of the most common cyberattacks that threaten the security of the company and personal data, with spear phishing being one of the main infection vectors. It’s a common scam because phishing is as easy; anyone can execute a phishing attack and be relatively successful with little to no investment. The flexibility of a phishing scam also makes it an infection vector of choice. With it, a scammer can steal sensitive data and gain access to user accounts.

The simplicity-to-value ratio is also a tempting draw of phishing. Despite how simple its execution is, it can help cybercriminals get their hands on large sums of money. $17,700 is lost every minute because of a phishing scam.

Lastly, users aren’t good at putting a stop to scams—even large companies face the threat of phishing today. Because of how sophisticated these phishing emails have become and the large number of emails people have to go through each day, it can distinguish a fake email from a real one. 

Fighting the Good Fight

Despite the evolving threats to data security, there are still ways you can fight them. Just like cybercriminals always find vulnerabilities to exploit, you can always find ways to mitigate or even counteract these measures. The key is in keeping an open eye and mind and keeping abreast of the available solutions that can help you keep your data and business secure. Protecting your digital assets often requires “digital measures.” It won’t hurt to let digital tools help you, but you and your organization should be at the heart of your data security. Educate yourself and your employees so your security isn’t only as good as the tool you choose to use.

Jobprofil des Data Engineers

Warum Data Engineering der Data Science in Bedeutung und Berufschancen längst die Show stiehlt, dabei selbst ebenso einem stetigen Wandel unterliegt.

Was ein Data Engineer wirklich können muss

Der Data Scientist als sexiest Job des 21. Jahrhunderts? Mag sein, denn der Job hat seinen ganz speziellen Reiz, auch auf Grund seiner Schnittstellenfunktion zwischen Technik und Fachexpertise. Doch das Spotlight der kommenden Jahre gehört längst einem anderen Berufsbild aus der Datenwertschöpfungskette – das zeigt sich auch bei den Gehältern.

Viele Unternehmen sind gerade auf dem Weg zum Data-Driven Business, einer Unternehmensführung, die für ihre Entscheidungen auf transparente Datengrundlagen setzt und unter Einsatz von Business Intelligence, Data Science sowie der Automatisierung mit Deep Learning und RPA operative Prozesse so weit wie möglich automatisiert. Die Lösung für diese Aufgabenstellungen werden oft vor allem bei den Experten für Prozessautomatisierung und Data Science gesucht, dabei hängt der Erfolg jedoch gerade viel eher von der Beschaffung valider Datengrundlagen ab, und damit von einer ganz anderen entscheidenden Position im Workflow datengetriebener Entscheidungsprozesse, dem Data Engineer.

Data Engineer, der gefragteste Job des 21sten Jahrhunderts?

Der Job des Data Scientists hingegen ist nach wie vor unter Studenten und Absolventen der MINT-Fächer gerade so gefragt wie nie, das beweist der tägliche Ansturm der vielen Absolventen aus Studiengängen rund um die Data Science auf derartige Stellenausschreibungen. Auch mangelt es gerade gar nicht mehr so sehr an internationalen Bewerben mit Schwerpunkt auf Statistik und Machine Learning. Der solide ausgebildete und bestenfalls noch deutschsprachige Data Scientist findet sich zwar nach wie vor kaum im Angebot, doch insgesamt gute Kandidaten sind nicht mehr allzu schwer zu finden. Seit Jahren sind viele Qualifizierungsangebote für Studenten sowie Arbeitskräfte am Markt auch günstig und ganz flexibel online verfügbar, ohne dabei Abstriche bei beim Ansehen dieser Aus- und Fortbildungsmaßnahmen in Kauf nehmen zu müssen.

Was ein Data Scientist fachlich in Sachen Expertise alles abdecken muss, hatten wir ganz ausführlich über Betrachtung des Data Science Knowledge Stack besprochen.

Doch was bringt ein Data Scientist, wenn dieser gar nicht über die Daten verfügt, die für seine Aufgaben benötigt werden? Sicherlich ist die Aufgabe eines jeden Data Scientists auch die Vorbereitung und Präsentation seiner Vorhaben. Die Heranschaffung und Verwaltung großer Datenmengen in einer Enterprise-fähigen Architektur ist jedoch grundsätzlich nicht sein Schwerpunkt und oft fehlen ihm dafür auch die Berechtigungen in einer Enterprise-IT. Noch konkreter wird der Bedarf an Datenbeschaffung und -aufbereitung in der Business Intelligence, denn diese benötigt für nachhaltiges Reporting feste Strukturen wie etwa ein Data Warehouse.

Das Profil des Data Engineers: Big Data High-Tech

Auch wenn Data Engineering von Hochschulen und Fortbildungsanbietern gerade noch etwas stiefmütterlich behandelt werden, werden der Einsatz und das daraus resultierende Anforderungsprofil eines Data Engineers am Markt recht eindeutig skizziert. Einsatzszenarien für diese Dateningenieure – auch auf Deutsch eine annehmbare Benennung – sind im Kern die Erstellung von Data Warehouse und Data Lake Systeme, mittlerweile vor allem auf Cloud-Plattformen. Sie entwickeln diese für das Anzapfen von unternehmensinternen sowie -externen Datenquellen und bereiten die gewonnenen Datenmengen strukturell und inhaltlich so auf, dass diese von anderen Mitarbeitern des Unternehmens zweckmäßig genutzt werden können.

Enabler für Business Intelligence, Process Mining und Data Science

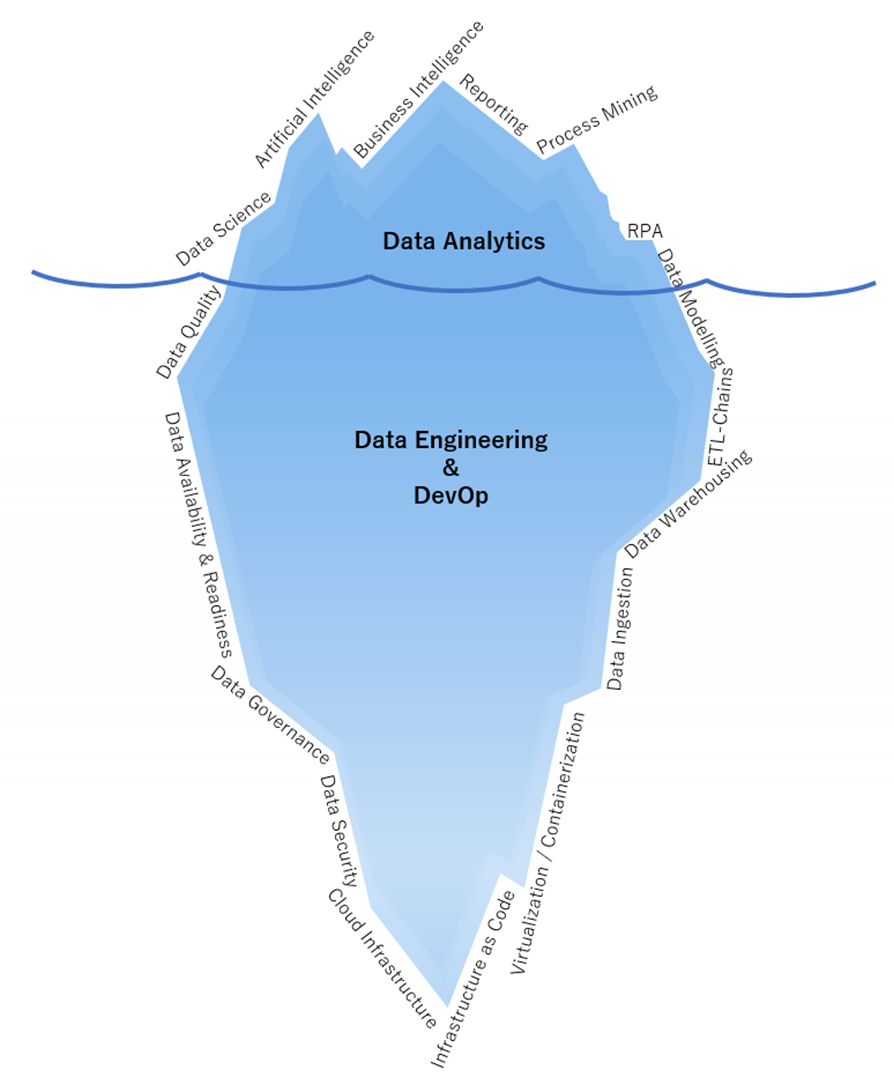
Kein Data Engineer darf den eigentlichen Verbraucher der Daten aus den Augen verlieren, für den die Daten nach allen Regeln der Kunst zusammengeführt, bereinigt und in das Zielformat gebracht werden sollen. Klassischerweise arbeiten die Engineers am Data Warehousing für Business Intelligence oder Process Mining, wofür immer mehr Event Logs benötigt werden. Ein Data Warehouse ist der unter Wasser liegende, viel größere Teil des Eisbergs der Business Intelligence (BI), der die Reports mit qualifizierten Daten versorgt. Diese Eisberg-Analogie lässt sich auch insgesamt auf das Data Engineering übertragen, der für die Endanwender am oberen Ende der Daten-Nahrungskette meistens kaum sichtbar ist, denn diese sehen nur die fertigen Analysen und nicht die dafür vorbereiteten Datentöpfe.

Abbildung 1 - Data Engineering ist der Mittelpunkt einer jeden Datenplattform. Egal ob für Data Science, BI, Process Mining oder sogar RPA, die Datenanlieferung bedingt gute Dateningenieure, die bis hin zur Cloud Infrastructure abtauchen können.

Abbildung 1 – Data Engineering ist der Mittelpunkt einer jeden Datenplattform. Egal ob für Data Science, BI, Process Mining oder sogar RPA, die Datenanlieferung bedingt gute Dateningenieure, die bis hin zur Cloud Infrastructure abtauchen können.

Datenbanken sind Quelle und Ziel der Data Engineers

Daten liegen selten direkt in einer einzigen CSV-Datei strukturiert vor, sondern entstammen einer oder mehreren Datenbanken, die ihren eigenen Regeln unterliegen. Geschäftsdaten, beispielsweise aus ERP- oder CRM-Systemen, liegen in relationalen Datenbanken vor, oftmals von Microsoft, Oracle, SAP oder als eine Open-Source-Alternative. Besonders im Trend liegen derzeitig die Cloud-nativen Datenbanken BigQuery von Google, Redshift von Amazon und Synapse von Microsoft sowie die cloud-unabhängige Datenbank snowflake. Dazu gesellen sich Datenbanken wie der PostgreSQL, Maria DB oder Microsoft SQL Server sowie CosmosDB oder einfachere Cloud-Speicher wie der Microsoft Blobstorage, Amazon S3 oder Google Cloud Storage. Welche Datenbank auch immer die passende Wahl für das Unternehmen sein mag, ohne SQL und Verständnis für normalisierte Daten läuft im Data Engineering nichts.

Andere Arten von Datenbanken, sogenannte NoSQL-Datenbanken beruhen auf Dateiformaten, einer Spalten- oder einer Graphenorientiertheit. Beispiele für verbreitete NoSQL-Datenbanken sind MongoDB, CouchDB, Cassandra oder Neo4J. Diese Datenbanken exisiteren nicht nur als Unterhaltungswert gelangweilter Nerds, sondern haben ganz konkrete Einsatzgebiete, in denen sie jeweils die beste Performance im Lesen oder Schreiben der Daten bieten.

Ein Data Engineer muss demnach mit unterschiedlichen Datenbanksystemen zurechtkommen, die teilweise auf unterschiedlichen Cloud Plattformen heimisch sind.

Data Engineers brauchen Hacker-Qualitäten

Liegen Daten in einer Datenbank vor, können Analysten mit Zugriff einfache Analysen bereits direkt auf der Datenbank ausführen. Doch wie bekommen wir die Daten in unsere speziellen Analyse-Tools? Hier muss der Engineer seinen Dienst leisten und die Daten aus der Datenbank exportieren können. Bei direkten Datenanbindungen kommen APIs, also Schnittstellen wie REST, ODBC oder JDBC ins Spiel und ein guter Data Engineer benötigt Programmierkenntnisse, bevorzugt in Python, diese APIs ansprechen zu können. Etwas Kenntnis über Socket-Verbindungen und Client-Server-Architekturen zahlt sich dabei manchmal aus. Ferner sollte jeder Data Engineer mit synchronen und asynchronen Verschlüsselungsverfahren vertraut sein, denn in der Regel wird mit vertraulichen Daten gearbeitet. Ein Mindeststandard an Sicherheit gehört zum Data Engineering und darf keinesfalls nur Datensicherheitsexperten überlassen werden, eine Affinität zu Netzwerksicherheit oder gar Penetration-Testing ist positiv zu bewerten, mindestens aber ein sauberes Berechtigungsmanagement gehört zu den Grundfähigkeiten. Viele Daten liegen nicht strukturiert in einer Datenbank vor, sondern sind sogenannte unstrukturierte oder semi-strukturierte Daten aus Dokumenten oder aus Internetquellen. Mit Methoden wie Data Web Scrapping und Data Crawling sowie der Automatisierung von Datenabrufen beweisen herausragende Data Engineers sogar echte Hacker-Qualitäten.

Dirigent der Daten: Orchestrierung von Datenflüssen

Eine der Kernaufgaben des Data Engineers ist die Entwicklung von ETL-Strecken, um Daten aus Quellen zu Extrahieren, zu in das gewünschte Zielformat zu Transformieren und schließlich in die Zieldatenbank zu Laden. Dies mag erstmal einfach klingen, wird jedoch zur echten Herausforderung, wenn viele ETL-Prozesse sich zu ganzen ETL-Ketten und -Netzwerken zusammenfügen, diese dabei trotz hochfrequentierter Datenabfrage performant laufen müssen. Die Orchestrierung der Datenflüsse kann in der Regel in mehrere Etappen unterschieden werden, von der Quelle ins Data Warehouse, zwischen den Ebenen im Data Warehouse sowie vom Data Warehouse in weiterführende Systeme, bis hin zum Zurückfließen verarbeiteter Daten in das Data Warehouse (Reverse ETL).

Hart an der Grenze zu DevOp: Automatisierung in Cloud-Architekturen

In den letzten Jahren sind Anforderungen an Data Engineers deutlich gestiegen, denn neben dem eigentlichen Verwalten von Datenbeständen und -strömen für Analysezwecke wird zunehmend erwartet, dass ein Data Engineer auch Ressourcen in der Cloud managen, mindestens jedoch die Datenbanken und ETL-Ressourcen. Darüber hinaus wird zunehmend jedoch verlangt, IT-Netzwerke zu verstehen und das ganze Zusammenspiel der Ressourcen auch als Infrastructure as Code zu automatisieren. Auch das automatisierte Deployment von Datenarchitekturen über CI/CD-Pipelines macht einen Data Engineer immer mehr zum DevOp.

Zukunfts- und Gehaltsaussichten

Im Vergleich zum Data Scientist, der besonders viel Methodenverständnis für Datenanalyse, Statistik und auch für das zu untersuchende Fachgebiet benötigt, sind Data Engineers mehr an Tools und Plattformen orientiert. Ein Data Scientist, der Deep Learning verstanden hat, kann sein Wissen zügig sowohl mit TensorFlow als auch mit PyTorch anwenden. Ein Data Engineer hingegen arbeitet intensiver mit den Tools, die sich über die Jahre viel zügiger weiterentwickeln. Ein Data Engineer für die Google Cloud wird mehr Einarbeitung benötigen, sollte er plötzlich auf AWS oder Azure arbeiten müssen.

Ein Data Engineer kann in Deutschland als Einsteiger mit guten Vorkenntnissen und erster Erfahrung mit einem Bruttojahresgehalt zwischen 45.000 und 55.000 EUR rechnen. Mehr als zwei Jahre konkrete Erfahrung im Data Engineering wird von Unternehmen gerne mit Gehältern zwischen 50.000 und 80.000 EUR revanchiert. Darüber liegen in der Regel nur die Data Architects / Datenarchitekten, die eher in großen Unternehmen zu finden sind und besonders viel Erfahrung voraussetzen. Weitere Aufstiegschancen für Data Engineers sind Berater-Karrieren oder Führungspositionen.

Wer einen Data Engineer in Festanstellung gebracht hat, darf sich jedoch nicht all zu sicher fühlen, denn Personalvermittler lauern diesen qualifizierten Fachkräften an jeder Ecke des Social Media auf. Gerade in den Metropolen wie Berlin schaffen es längst nicht alle Unternehmen, jeden Data Engineer über Jahre hinweg zu beschäftigen. Bei der großen Auswahl an Jobs und Herausforderungen fällt diesen Datenexperten nicht schwer, seine Gehaltssteigerungen durch Jobwechsel proaktiv voranzutreiben.

Hybrid Cloud

The Cloud or Hybrid Cloud – Pros & Cons

Big data and artificial intelligence (AI) are some of today’s most disruptive technologies, and both rely on data storage. How organizations store and manage their digital information has a considerable impact on these tools’ efficacy. One increasingly popular solution is the hybrid cloud.

Cloud computing has become the norm across many organizations as the on-premise solutions struggle to meet modern demands for uptime and scalability. Within that movement, hybrid cloud setups have gained momentum, with 80% of cloud users taking this approach in 2022. Businesses noticing that trend and considering joining should carefully weigh the hybrid cloud’s pros and cons. Here’s a closer look.

The Cloud

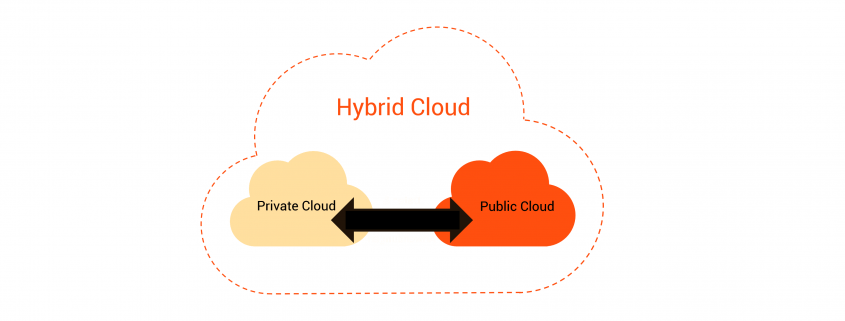
To understand the advantages and disadvantages of hybrid cloud setups, organizations must contrast them against conventional cloud systems. These fall into two categories: public, where multiple clients share servers and resources, and private, where a single party uses dedicated cloud infrastructure. In either case, using a single cloud presents unique opportunities and challenges.

Advantages of the Cloud

The most prominent advantage of traditional cloud setups is their affordability. Because both public and private clouds entirely remove the need for on-premise infrastructure, users pay only for what they need. Considering how 31% of users unsatisfied with their network infrastructure cite insufficient budgets as the leading reason, that can be an important advantage.

The conventional cloud also offers high scalability thanks to its reduced hardware needs. It can also help prevent user errors like misconfiguration because third-party vendors manage much of the management side. Avoiding those mistakes makes it easier to use tools like big data and AI to their full potential.

Disadvantages of the Cloud

While outsourcing management and security workloads can be an advantage in some cases, it comes with risks, too. Most notably, single-cloud or single-type multi-cloud users must give up control and visibility. That poses functionality and regulatory concerns when using these services to train AI models or analyze big data.

Storing an entire organization’s data in just one system also makes it harder to implement a reliable backup system to prevent data loss in a breach. That may be too risky in a world where 96% of IT decision-makers have experienced at least one outage in the last three years.

Hybrid Cloud

The hybrid cloud combines public and private clouds so users can experience some of the benefits of both. In many instances, it also combines on-premise and cloud environments, letting businesses use both in a cohesive data ecosystem. Here’s a closer look at the hybrid cloud’s pros and cons.

Advantages of Hybrid Cloud

One of the biggest advantages of hybrid cloud setups is flexibility. Businesses can distribute workloads across public, private and on-premise infrastructure to maximize performance with different processes. That control and adaptability also let organizations use different systems for different data sets to meet the unique security needs of each.

While hybrid environments may be less affordable than traditional clouds because of their on-premise parts, they offer more cost-efficiency than purely on-prem solutions. Having multiple data storage technologies provides more disaster recovery options. With 75% of small businesses being unable to recover from a ransomware attack, that’s hard to ignore.

Hybrid cloud systems are also ideal for companies transitioning to the cloud from purely on-premise solutions. The mixture of both sides enables an easier, smoother and less costly shift than moving everything simultaneously.

Disadvantages of Hybrid Cloud

By contrast, the most prominent disadvantage of hybrid cloud setups is their complexity. Creating a system that works efficiently between public, private and on-prem setups is challenging, making these systems error-prone and difficult to manage. Misconfigurations are the biggest threat to cloud security, so that complexity can limit big data and AI’s safety.

Finding compatible public and private clouds to work with each other and on-prem infrastructure can also pose a challenge. Vendor lock-in could limit businesses’ options in this regard. Even when they get things working, they may lack transparency, making it difficult to engage in effective big data analytics.

Which Is the Best Option?

Given the advantages and disadvantages of hybrid cloud setups and their conventional counterparts, it’s clear that no single one emerges as the optimal solution for every situation. Instead, which is best depends on an organization’s specific needs.

The hybrid cloud is ideal for companies facing multiple security, regulatory or performance needs. If the business has varying data sets that must meet different regulations, some information that’s far more sensitive than others or has highly diverse workflows, they need the hybrid cloud’s flexibility and control. Companies that want to move slowly into the cloud may prefer these setups, too.

On the other hand, the conventional cloud is best for companies with tighter budgets, limited IT resources or a higher need for scalability. Smaller businesses with an aggressive digitization timeline, for example, may prefer a public multi-cloud setup over a hybrid solution.

Find the Optimal Data Storage Technology

To make the most of AI and big data, organizations must consider where they store the related data. For some companies, the hybrid cloud is the ideal solution, while for others, a more conventional setup is best. Making the right decision begins with understanding what each has to offer.

How to speed up claims processing with automated car damage detection

AI drives automation, not only in industrial production or for autonomous driving, but above all in dealing with bureaucracy. It is an realy enabler for lean management!

One example is the use of Deep Learning (as part of Artificial Intelligence) for image object detection. A car insurance company checks the amount of the damage by a damage report after car accidents. This process is actually performed by human professionals. With AI, we can partially automate this process using image data (photos of car damages). After an AI training with millions of photos in relation to real costs for repair or replacement, the cost estimation gets suprising accurate and supports the process in speed and quality.

AI drives automation and DATANOMIQ drives this automation with you! You can download the Infographic as PDF.

How to speed up claims processing with automated car damage detection

How to speed up claims processing
with automated car damage detection

Download this Infographic as PDF now by clicking here!

We wrote this article in cooperation with pixolution, a company for computer vision and AI-bases visual search. Interested in introducing AI / Deep Learning to your organization? Do not hesitate to get in touch with us!

DATANOMIQ is the independent consulting and service partner for business intelligence, process mining and data science. We are opening up the diverse possibilities offered by big data and artificial intelligence in all areas of the value chain. We rely on the best minds and the most comprehensive method and technology portfolio for the use of data for business optimization.
7 Reasons Why You Need Cloud Cost Management Tool

Many businesses today use a CCM (Cloud Cost Management) tool to optimize their spending on the cloud. Read this article to learn why.

7 Reasons Why You Need Cloud Cost Management Tool (And Where to Find One)

The Cloud. Do you remember the time when this sounded like a silly, fiction-like buzzword? No one imagined that a few years later, we’d be amazed by the technology. Or, that the clouds will be used by millions of people and businesses.

As time passes, more and more businesses shift to the cloud. They use clouds for data warehousing and to share information with remote workers and clients. They use it to keep information easily accessible and safely stored in a digital format.

Clouds have become irreplaceable in the world. In 2020, the total worth of this market reached $371.4 billion. With a compound annual growth rate of 17.5%, the projections tell us that this market will reach $832 billion by 2025.

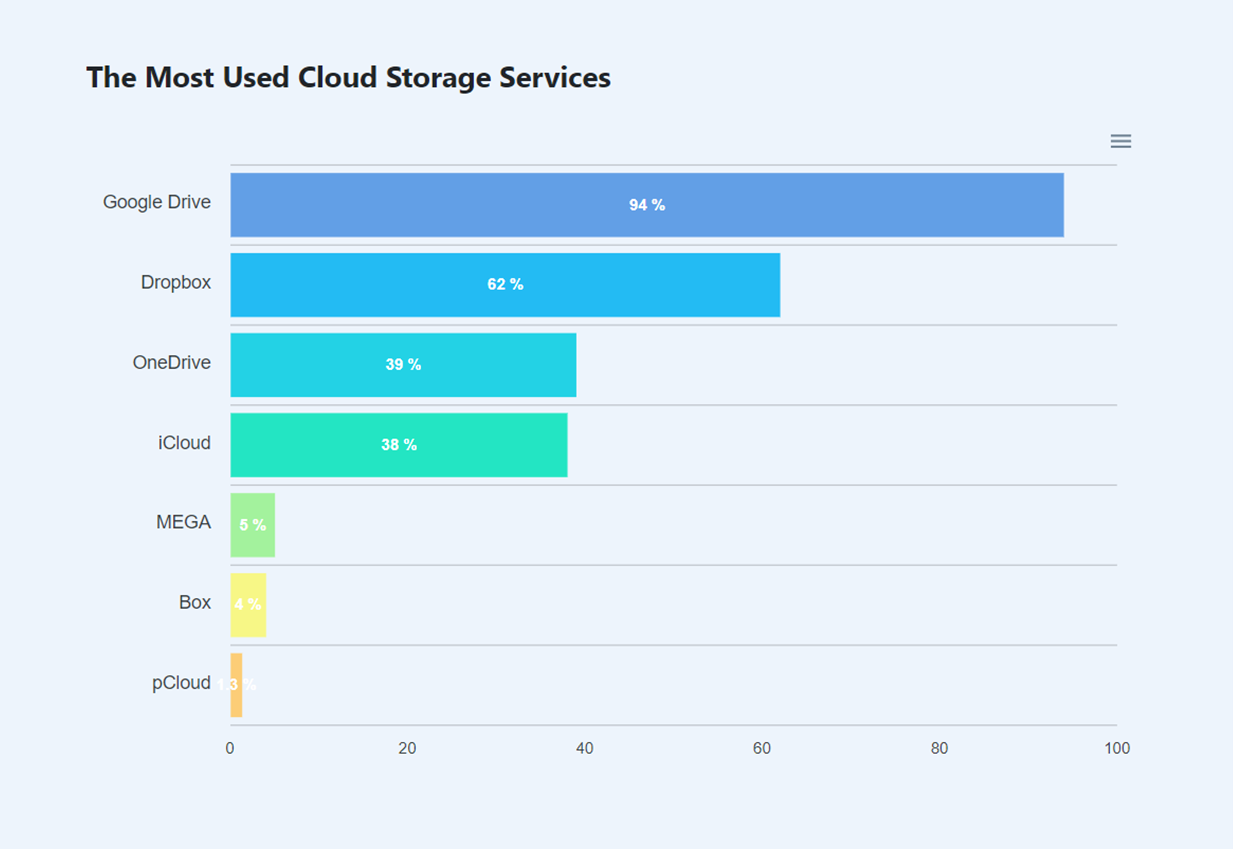
Today, zettabytes of data are placed in the top storage services such as Google Drive, Google Workspace, and Dropbox, as well as private IT clouds.

Most used Cloud Storages

Source: https://www.cloudwards.net/cloud-computing-statistics/

In a few years from now, there will be over a hundred zettabytes of data placed in the cloud, which amounts to nearly half of the global data storage projected for 2025. At this point, it is safe to say that clouds are trending in the business world and we can only expect these numbers to grow.

This raises a very big question – how will businesses handle their cloud usage?

One of the biggest challenges that companies face when it comes to the cloud is controlling cloud costs. Fortunately, there’s such a thing as cloud cost optimization, used to help businesses minimize their expenses and achieve better cloud performance.

This article will tell you all about cloud cost optimization and the tools used to make this happen. Read on to learn about the top 7 reasons why you need to invest in a good CCM tool.

What is cloud cost optimization?

Before we jump at the benefits of using a CCM, let’s discuss cloud cost optimization a bit. CCO refers to the act of reducing resource waste on clouds by scaling and choosing the resources required for cloud functions.

Data analytics in the cloud can transform your business altogether. While this is impossible to analyze on your own, certain tools can help you find ways to optimize the cloud performance.

Depending on what you use for this purpose, the success of your CCO strategy can vary. Nevertheless, with a good tool, you can get insight into what you’re doing right and what you need to change to get the most out of your cloud investment.

Choosing one of the best cloud cost management tools

When it comes to choosing cloud cost management tools, Zluri is the answer to all your questions. The popular SaaS management platform has a full range of top-ranked tools to be used for cloud cost optimization.

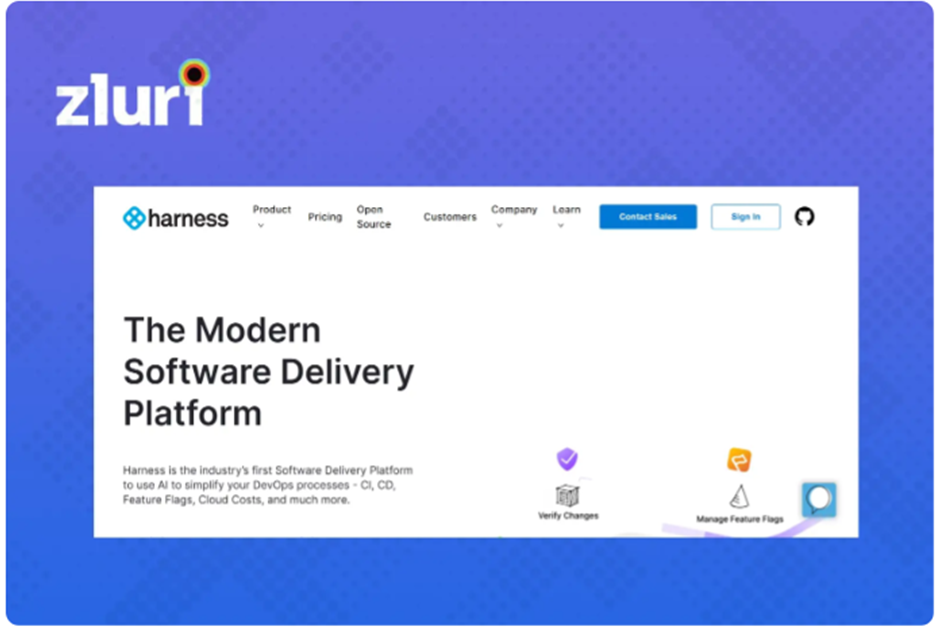
According to Zluri, the top choice available to businesses today is Harness.

The number one CCM tool will proactively detect anomalies and tell you all you need to know about your cloud resources. It will also predict your cloud spending and help you make smart data-based decisions. Lastly, Harness allows users to automate idle resource management.

Source: https://www.zluri.com/blog/cloud-cost-management-tools/

Some of the things to look for when choosing a cloud cost management tool are:

  • Automated cost optimizatione. the option to schedule resources to turn on and off to reduce costs and manual efforts.
  • Visibility of resources. The tool you use should make various resources used in the cloud environment visible such as applications, containers, and servers.
  • State of resources. A good CCM will tell you about the state of resources, how they are used, and whether they are underutilized.
  • Multi-cloud support. Many businesses store their data across different cloud providers. If you are one of them, you need a tool that offers multi-cloud support.

Naturally, the pricing and ease of use are also important when you’re making your choice.

Reasons to invest in a cloud cost management tool

Now that you know where to find the best CCM, let’s talk about what you get if you use a cloud cost management tool.

It all starts with what the CCM can do for you. Here are just a few of the most popular functions:

  • Forecast and budget the cloud spend with a great deal of accuracy
  • Inform on the current cloud costs
  • Discover areas that can increase profitability and find the least profitable projects within the cloud
  • Give you tips on adjusting the pricing structure and re-thinking unnecessary features

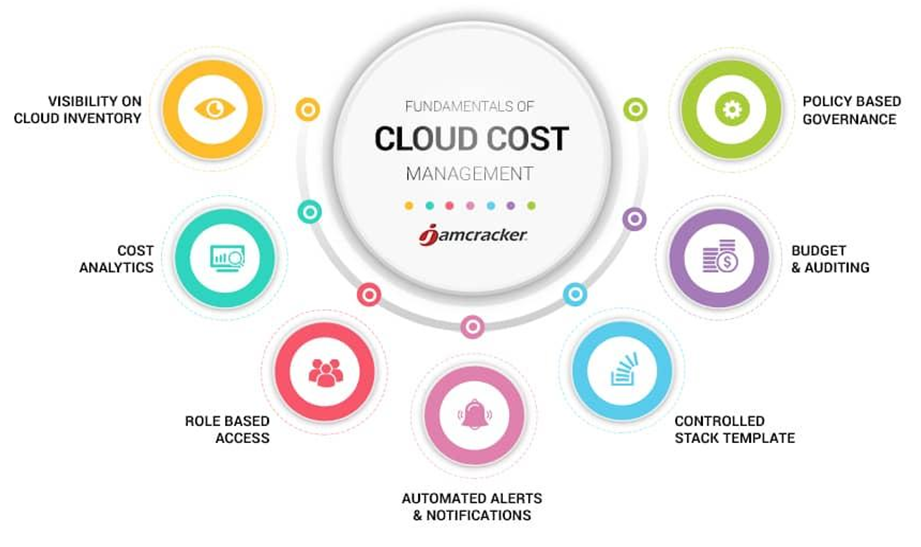
https://www.jamcracker.com/blogs/fundamentals-of-cloud-cost-management

With the right tool in your arsenal, you can reap many benefits. We present you with the top seven.

https://www.techtarget.com/searchcloudcomputing/feature/5-ways-to-reduce-cloud-costs

1.    Define the cloud costs

451Research reported that 73% of US cloud users look at their cloud expenses as a fixed cost. But, these expenses aren’t fixed – they are variables. That’s why businesses often come across cost inefficiencies. Cloud service charging changes every day and interpreting their plans is not as straightforward as it might seem.

However, with a good CCM tool, you can tie all the expenses to pricing and value and figure out a fixed quote for cloud spending. You can use this data to plan and manage your budget or figure out ways to make your cloud use more cost-conscious.

2.    More transparency

A good model for cost optimization will positively impact your operational, as well as financial aspects. Thanks to the analytics feature in a CCM tool, you can monitor and better organize your cloud expenditures. You’ll know how your cloud is used, how much every action costs, and what you can do to optimize this. More transparency leads to better decision-making.

3.    Reduce waste and correct defects

Let’s say that you invest in a cloud cost management tool. It will discover the resources you are spending and detect features that are underused. You can use this information to manage neglected tools and eliminate the unnecessary. You can correct the defects and reduce waste.

As a result of the transparency and analytics, users of a cloud can find a better cost-performance balance and optimize their cloud.

4.    Smart predictions

A cloud cost management tool will provide you with more than waste information. The usage patterns you’ll get access to can be analyzed and used to make smart predictions. You can use the data to perform consolidated cost analysis and predict future expenses for the cloud. Base this on additional cloud services you’ll need, increased cloud usage, as well as scalability.

5.    Timely reviews

By performing audits of the cloud usage and resource, teams can get better control over this matter. A CCM tool can perform audits every couple of months and hand out reports to the company about cloud usage.

These reports are shared within organizations and used to categorize expenses and drop under-utilized resources in the cloud.

6.    Memory and storage management

Another great benefit of using a CCM tool is that it helps you manage your storage. With it, you can detect unused data, manage regular data backups, and check the usage of the cloud.

Going through everything stored in your cloud can take forever, but not with these tools. With these tools, organizations can find and discard data that is useless and save a lot of money in the process. It’s amazing how much is stored in clouds without actual use. The right cloud cost management tool can point you in the direction of things you don’t need and remind you to cut them loose.

7.    Multi-cloud synchronization

Chances are, your business is using more than one cloud service to store its data. After a while, your data is scattered across different clouds and you cannot find or manage information as easily as you should. When you’re handling more clouds, it gets much harder to optimize the costs or reduce the expenses.

But, not if you have a good CCM tool.

A good CCM tool offers synchronization between at least the most-used cloud services out there. This will allow you to optimize your costs across different clouds, figure out where you can save some money, and find a way to organize your cloud usage more efficiently.

The best time to optimize your cloud is now!

Who would have thought that clouds will become such a big part of our business operations? If you are using clouds for your business, investing in a cloud cost management tool is the next smartest step to take. Thanks to a small investment in a good tool, you can save a fortune on cloud costs.

Data Dimensionality Reduction Series: Random Forest

Hello lovely individuals, I hope everyone is doing well, is fantastic, and is smiling more than usual. In this blog we shall discuss a very interesting term used to build many models in the Data science industry as well as the cyber security industry.

SUPER BASIC DEFINITION OF RANDOM FOREST:

Random forest is a form of Supervised Machine Learning Algorithm that operates on the majority rule. For example, if we have a number of different algorithms working on the same issue but producing different answers, the majority of the findings are taken into account. Random forests, also known as random selection forests, are an ensemble learning approach for classification, regression, and other problems that works by generating a jumble of decision trees during training.

When it comes to regression and classification, random forest can handle both categorical and continuous variable data sets. It typically helps us outperform other algorithms and overcome challenges like overfitting and the curse of dimensionality.

QUICK ANALOGY TO UNDERSTAND THINGS BETTER:

Uncle John wants to see a doctor for his acute abdominal discomfort, so he goes to his pals for recommendations on the top doctors in town. After consulting with a number of friends and family members, Atlas chooses to visit the doctor who received the highest recommendations.

So, what does this mean? The same is true for random forests. It builds decision trees from several samples and utilises their majority vote for classification and average for regression.

HOW BIAS AND VARIANCE AFFECTS THE ALGORITHM?

  1. BIAS
  • The algorithm’s accuracy or quality is measured.
  • High bias means a poor match
  1. VARIANCE
  • The accuracy or specificity of the match is measured.
  • A high variance means a weak match

We would like to minimise each of these. But, unfortunately we can’t do this independently, since there is a trade-off

EXPECTED PREDICTION ERROR = VARIANCE + BIAS^2 + NOISE^2

Bias vs Variance Tradeoff

HOW IS IT DIFFERENT FROM OTHER TWO ALGORITHMS?

Every other data dimensionality reduction method, such as missing value ratio and principal component analysis, must be built from the scratch, but the best thing about random forest is that it comes with built-in features and is a tree-based model that uses a combination of decision trees for non-linear data classification and regression.

Without wasting much time, let’s move to the main part where we’ll discuss the working of RANDOM FOREST:

WORKING WITH RANDOM FOREST:

As we saw in the analogy, RANDOM FOREST operates on the basis of ensemble technique; however, what precisely does ensemble technique mean? It’s actually rather straightforward. Ensemble simply refers to the combination of numerous models. As a result, rather than a single model, a group of models is utilised to create predictions.

ENSEMBLE TECHNIQUE HAS 2 METHODS:

Ensemble Learning: Bagging and Boosting

1] BAGGING

2] BOOSTING

Let’s dive deep to understand things better:

1] BAGGING:

LET’S UNDERSTAND IT THROUGH A BETTER VIEW:

Bagging simply helps us to reduce the variance in a loud datasets. It works on an ensemble technique.

  1. Algorithm independent : general purpose technique
  2. Well suited for high variance algorithms
  3. Variance reduction is achieved by averaging a group of data.
  4. Choose # of classifiers to build (B)

DIFFERENT TRAINING DATA:

  1. Sample Training Data with Replacement
  2. Same algorithm on different subsets of training data

APPLICATION :

  1. Use with high variance algorithms (DT, NN)
  2. Easy to parallelize
  3. Limitation: Loss of Interpretability
  4. Limitation: What if one of the features dominates?

SUMMING IT ALL UP:

  1. Ensemble approach = Bootstrap Aggregation.
  2. In bagging a random dataset is selected as shown in the above figure and then a model is built using those random data samples which is termed as bootstrapping.
  3. Now, when we train this random sample data it is not mendidate to select data points only once, while training the sample data we can select the individual data point more then once.
  4. Now each of these models is built and trained and results are obtained.
  5. Lastly the majority results are being considered.

We can even calculate  the error from this thing know as random forest OOB error:

RANDOM FORESTS: OOB ERROR  (Out-of-Bag Error) :

▪ From each bootstrapped sample, 1/3rd of it is kept aside as “Test”

▪ Tree built on remaining 2/3rd

▪ Average error from each of the “Test” samples is called “Out-of-Bag Error”

▪ OOB error provides a good estimate of model error

▪ No need for separate cross validation

2] BOOSTING:

Boosting in short helps us to improve our prediction by reducing error in predictive data analysis.

Weak Learner: only needs to generate a hypothesis with a training accuracy greater than 0.5, i.e., < 50% error over any distribution.

KEY INTUITION:

  1. Strong learners are very difficult to construct
  2. Constructing weaker Learners is relatively easy influence with the empirical squared improvement when assigned to the model

APPROACH OUTLINE:

  1. Start with a ML algorithm for finding the rough rules of thumb (a.k.a. “weak” or “base” algorithm)
  2. Call the base algorithm repeatedly, each time feeding it a different subset of the training examples
  3. The basic learning algorithm creates a new weak prediction rule each time it is invoked.
  4. After several rounds, the boosting algorithm must merge these weak rules into a single prediction rule that, hopefully, is considerably more accurate than any of the weak rules alone.

TWO KEY DETAILS :

  1. In each round, how is the distribution selected ?
  2. What is the best way to merge the weak rules into a single rule?

BOOSTING is classified into two types:

1] ADA BOOST

2] XG BOOST

As far as the Random forest is concerned it is said that it follows the bagging method, not a boosting method. As the name implies, boosting involves learning from others, which in turn increases learning. Random forests have trees that run in parallel. While creating the trees, there is no interaction between them.

Boosting helps us reduce the error by decreasing the bias whereas, on other hand, Bagging is a manner to decrease the variance within the prediction with the aid of generating additional information for schooling from the dataset using mixtures with repetitions to provide multi-sets of the original information.

How Bagging helps with variance – A Simple Example

BAGGED TREES

  1. Decision Trees have high variance
  2. The resultant tree (model) is determined by the training data.
  3. (Unpruned) Decision Trees tend to overfit
  4. One option: Cost Complexity Pruning

BAG TREES

  1. Sample with replacement (1 Training set → Multiple training sets)
  2. Train model on each bootstrapped training set
  3. Multiple trees; each different : A garden ☺
  4. Each DT predicts; Mean / Majority vote prediction
  5. Choose # of trees to build (B)

ADVANTAGES

Reduce model variance / instability.

RANDOM FOREST : VARIABLE IMPORTANCE

VARIABLE IMPORTANCE :

▪ Each time a tree is split due to a variable m, Gini impurity index of the parent node is higher than that of the child nodes

▪ Adding up all Gini index decreases due to variable m over all trees in the forest, gives a measure of variable importance

IMPORTANT FEATURES AND HYPERPARAMETERS:

  1. Diversity :
  2. Immunity to the curse of dimensionality :
  3. Parallelization :
  4. Train-Test split :
  5. Stability :
  6. Gini significance (or mean reduction impurity) :
  7. Mean Decrease Accuracy :

FEATURES THAT IMPROVE THE MODEL’S PREDICTIONS and SPEED :

  1. maximum_features :

Increasing max features often increases model performance since each node now has a greater number of alternatives to examine.

  1. n_estimators :

The number of trees you wish to create before calculating the maximum voting or prediction averages. A greater number of trees improves speed but slows down your code.

  1. min_sample_leaf :

If you’ve ever designed a decision tree, you’ll understand the significance of the minimal sample leaf size. A leaf is the decision tree’s last node. A smaller leaf increases the likelihood of the model collecting noise in train data.

  1. n_jobs :

This option instructs the engine on how many processors it is permitted to utilise.

  1. random_state :

This argument makes it simple to duplicate a solution. If given the same parameters and training data, a definite value of random state will always provide the same results.

  1. oob_score:

A random forest cross validation approach is used here. It is similar to the leave one out validation procedure, except it is significantly faster.

LET’S SEE THE STEPS INVOLVED IN IMPLEMENTATION OF RANDOM FOREST ALGORITHM:

Step1: Choose T- number of trees to grow

Step2: Choose m<p (p is the number of total features) —number of features used to calculate the best split at each node (typically 30% for regression, sqrt(p) for classification)

Step3: For each tree, choose a training set by choosing N times (N is the number of training examples) with replacement from the training set

Step4: For each node, calculate the best split, Fully grown and not pruned.

Step5: Use majority voting among all the trees

Following is a full case study and implementation of all the principles we just covered, in the form of a jupyter notebook including every concept and all you ever wanted to know about RANDOM FOREST.

GITHUB Repository for this blog article: https://gist.github.com/Vidhi1290/c9a6046f079fd5abafb7583d3689a410

Control the visibility of the PowerBI visuals based on condition

In PowerBI, there is no direct or functional mechanism to adjust the visibility (Show/Hide) of visualizations based on filter choices. There is, however, a workaround that enables us to show/hide visuals based on filter condition.

The fundamental concept behind this technique is to apply a mask to a visual and change its opacity based on a condition or filter selection.

Use Case:

I have detail table of orders. These orders are divided into Consumer, Home Office, and Corporation categories. I use segment as a filter. One of the requirements is to present a table of detail if the overall profit for the selected segment is less than $100,000. To do this, this task will be divided into two major parts. First, we will display the table if the filter is selected. Next, we will add a condition to the table.

Step 1: Show table only filter is selected

  • Place filter (Slicer) and visual on the Report Pane.

  • Create a measure that will determine if the filter is selected or not.

Filter_Selected = IF(ISFILTERED(Orders[Segment]),1,0)

  • Add this measure to the filter pane of the table visualization and select the show item when the value is 1 option. This will ensure that when no options are selected, only the header is displayed.

  • Set the mask down on the table. Make sure you only mask the table header with a border color that matches your background, or remove it entirely.

  • Create a measure to change the mask’s transparency. If two zeros are appended to the end of any HAX code, this represents complete transparency.

mask_transparency =IF([Filter_Selected],”#FFFFFF00″,”#FFFFFF”)

  • Keep this measure on the Fill of the mask and add conditional formatting to it.

If the mask transparency(measure) field is grayed out during the previous steps, you may need to modify the data type of mask transparency to text.

Step 2 : Add a condition to the solution

  • Create a new measure to determine if our condition is met.

condition_check = IF(CALCULATE(SUM(Orders[Profit]),filter(all(Orders), Orders[Segment] = SELECTEDVALUE(Orders[Segment]))) < 100000,1,0)

  • Now add this new measure to a table visual’s filter pane and pick the show item when the value is 1 option. This ensures that only if the condition meets the table will appear.

You can now display or hide visuals based on slicer selection and condition. If you know a better way to do this, please comment and let me know. For this article, I referred to this page.