Geschriebene Artikel über Big Data Analytics

The Future of AI in Dental Technology

As we develop more advanced technology, we begin to learn that artificial intelligence can have more and more of an impact on our lives and industries that we have gotten used to being the same over the past decades. One of those industries is dentistry. In your lifetime, you’ve probably not seen many changes in technology, but a boom around artificial intelligence and technology has opened the door for AI in dental technologies.

How Can AI Help?

Though dentists take a lot of pride in their craft and career, most acknowledge that AI can do some things that they can’t do or would make their job easier if they didn’t have to do. AI can perform a number of both simple and advanced tasks. Let’s take a look at some areas that many in the dental industry feel that AI can be of assistance.

Repetitive, Menial Tasks

The most obvious area that AI can help out when it comes to dentistry is with repetitive and menial simple tasks. There are many administrative tasks in the dentistry industry that can be sped up and made more cost-effective with the use of AI. If we can train a computer to do some of these tasks, we may be able to free up more time for our dentists to focus on more important matters and improve their job performance as well. One primary use of AI is virtual consultations that offices like Philly Braces are offering. This saves patients time when they come in as the Doctor already knows what the next steps in their treatment will be.

Using AI to do some basic computer tasks is already being done on a small scale by some, but we have yet to see a very large scale implementation of this technology. We would expect that to happen soon, with how promising and cost-effective the technology has proven to be.

Reducing Misdiagnosis

One area that many think that AI can help a lot in is misdiagnosis. Though dentists do their best, there is still a nearly 20% misdiagnosis rate when reading x-rays in dentistry. We like to think that a human can read an x-ray better, but this may not be the case. AI technology can certainly be trained to read an x-ray and there have been some trials to suggest that they can do it better and identify key conditions that we often misread.

A world with AI diagnosis that is accurate and quicker will save time, money, and lead to better dental health among patients. It hasn’t yet come to fruition, but this seems to be the next major step for AI in dentistry.

Artificial Intelligence Assistants

Once it has been demonstrated that AI can perform a range of tasks that are useful to dentists, the next logical step is to combine those skills to make a fully-functional AI dental assistant. A machine like this has not yet been developed, but we can imagine that it would be an interface that could be spoken to similar to Alexa. The dentist would request vital information and other health history data from a patient or set of patients to assist in the treatment process. This would undoubtedly be a huge step forward and bring a lot of computing power into the average dentist office.

Conclusion

It’s clear that AI has a bright future in the dental industry and has already shown some of the essential skills that it can help with in order to provide more comprehensive and accurate care to dental patients. Some offices like Westwood Orthodontics already use AI in the form of a virtual consult to diagnose issues and provide treatment options before patients actually step foot in the office. Though not nearly all applications that AI can provide have been explored, we are well on our way to discovering the vast benefits of artificial intelligence for both patients and practices in the dental healthcare industry.


Lisa Gao, DDS, MS | Westwood Orthodontics 1033 Gayley Ave #106, Los Angeles California 90024, 310-870-1823

Interview – Customer Data Platform, more than CRM 2.0?

Interview with David M. Raab from the CDP Institute

David M. Raab is as a consultant specialized in marketing software and service vendor selection, marketing analytics and marketing technology assessment. Furthermore he is the founder of the Customer Data Platform Institute which is a vendor-neutral educational project to help marketers build a unified customer view that is available to all of their company systems.

Furthermore he is a Keynote-Speaker for the Predictive Analytics World Event 2019 in Berlin.

Data Science Blog: Mr. Raab, what exactly is a Customer Data Platform (CDP)? And where is the need for it?

The CDP Institute defines a Customer Data Platform as „packaged software that builds a unified, persistent customer database that is accessible by other systems“.  In plainer language, a CDP assembles customer data from all sources, combines it into customer profiles, and makes the profiles available for any use.  It’s important because customer data is collected in so many different systems today and must be unified to give customers the experience they expect.

Data Science Blog: Is it something like a CRM System 2.0? What Use Cases can be realized by a Customer Data Platform?

CRM systems are used to interact directly with customers, usually by telephone or in the field.  They work almost exclusively with data that is entered during those interactions.  This gives a very limited view of the customer since interactions through other channels such as order processing or Web sites are not included.  In fact, one common use case for CDP is to give CRM users a view of all customer interactions, typically by opening a window into the CDP database without needing to import the data into the CRM.  There are many other use cases for unified data, including customer segmentation, journey analysis, and personalization.  Anything that requires sharing data across different systems is a CDP use case.

Data Science Blog: When does a CDP make sense for a company? It is more relevant for retail and financial companies than for industrial companies, isn´t it?

CDP has been adopted most widely in retail and online media, where each customer has many interactions and there are many products to choose from.  This is a combination that can make good use of predictive modeling, which benefits greatly from having more complete data.  Financial services was slower to adopt, probably because they have fewer products but also because they already had pretty good customer data systems.  B2B has also been slow to adopt because so much of their customer relationship is handled by sales people.  We’ve more recently been seeing growth in additional sectors such as travel, healthcare, and education.  Those involve fewer transactions than retail but also rely on building strong customer relationships based on good data.

Data Science Blog: There are several providers for CDPs. Adobe, Tealium, Emarsys or Dynamic Yield, just to name some of them. Do they differ a lot between each other?

Yes they do.  All CDPs build the customer profiles I mentioned.  But some do more things, such as predictive modeling, message selection, and, increasingly, message delivery.  Of course they also vary in the industries they specialize in, regions they support, size of clients they work with, and many technical details.  This makes it hard to buy a CDP but also means buyers are more likely to find a system that fits their needs.

Data Science Blog: How established is the concept of the CDP in Europe in general? And how in comparison with the United States?

CDP is becoming more familiar in Europe but is not as well understood as in the U.S.  The European market spent a lot of money on Data Management Platforms (DMPs) which promised to do much of what a CDP does but were not able to because they do not store the level of detail that a CDP does.  Many DMPs also don’t work with personally identifiable data because the DMPs primarily support Web advertising, where many customers are anonymous.  The failures of DMPs have harmed CDPs because they have made buyers skeptical that any system can meet their needs, having already failed once.  But we are overcoming this as the market becomes better educated and more success stories are available.  What’s the same in Europe and the U.S. is that marketers face the same needs.  This will push European marketers towards CDPs as the best solution in many cases.

Data Science Blog: What are coming trends? What will be the main topic 2020?

We see many CDPs with broader functions for marketing execution: campaign management, personalization, and message delivery in particular.  This is because marketers would like to buy as few systems as possible, so they want broader scope in each systems.  We’re seeing expansion into new industries such as financial services, travel, telecommunications, healthcare, and education.  Perhaps most interesting will be the entry of Adobe, Salesforce, and Oracle, who have all promised CDP products late this year or early next year.  That will encourage many more people to consider buying CDPs.  We expect that market will expand quite rapidly, so current CDP vendors will be able to grow even as Adobe, Salesforce, and Oracle make new CDP sales.


You want to get in touch with Daniel M. Raab and understand more about the concept of a CDP? Meet him at the Predictive Analytics World 18th and 19th November 2019 in Berlin, Germany. As a Keynote-Speaker, he will introduce the concept of a Customer Data Platform in the light of Predictive Analytics. Click here to see the agenda of the event.


Marketing Attribution Models

Why do we need attribution?

Attributionis the process of distributing the value of a purchase between the various channels, used in the funnel chain. It allows you to determine the role of each channel in profit. It is used to assess the effectiveness of campaigns, to identify more priority sources. The competent choice of the model makes it possible to optimally distribute the advertising budget. As a result, the business gets more profit and less expenses.

What models of attribution exist

The choice of the appropriate model is an important issue, because depending on the business objectives, it is better to fit something different. For example, for companies that have long been present in the industry, the priority is to know which sources contribute to the purchase. Recognition is the importance for brands entering the market. Thus, incorrect prioritization of sources may cause a decrease in efficiency. Below are the models that are widely used in the market. Each of them is guided by its own logic, it is better suited for different businesses.

First Interaction (First Click)

The value is given to the first touch. It is suitable only for several purposes and does not make it possible to evaluate the role of each component in making a purchase. It is chosen by brands who want to increase awareness and reach.

Advantages

It does not require knowledge of programming, so the introduction of a business is not difficult. A great option that effectively assesses campaigns, aimed at creating awareness and demand for new products.

Disadvantages

It limits the ability to analyze comprehensively all channels that is used to promote a brand. It gives value to the first interaction channel, ignoring the rest.

Who is suitable for?

Suitable for those who use the promotion to increase awareness, the formation of a positive image. Also allows you to find the most effective source.

Last Interaction (Last Click)

It gives value to the last channel with which the consumer interacted before making the purchase. It does not take into account the actions that the user has done up to this point, what marketing activities he encountered on the way to conversion.

Advantages

The tool is widely used in the market, it is not difficult. It solves the problem of small advertising campaigns, where is no more than 3 sources.

Disadvantages

There is no way to track how other channels have affected the acquisition.

Who is suitable for?

It is suitable for business models that have a short purchase cycle. This may be souvenirs, seasonal offers, etc.

Last Non-Direct Click

It is the default in Google Analytics. 100% of the  conversion value gives the last channel that interacted with the buyer before the conversion. However, if this source is Direct, then assumptions are counted.

Suppose a person came from an email list, bookmarked a product, because at that time it was not possible to place an order. After a while he comes back and makes a purchase. In this case, email as a channel for attracting users would be underestimated without this model.

Who is suitable for?

It is perfect for beginners who are afraid of making a mistake in the assessment. Because it allows you to form a general idea of ​​the effectiveness of all the involved channels.

Linear model attribution (Linear model)

The value of the conversion is divided in equal parts between all available channels.

Linear model attribution (Linear model)

Advantages

More advanced model than previous ones, however, characterized by simplicity. It takes into account all the visits before the acquisition.

Disadvantages

Not suitable for reallocating the budget between the channels. This is due to the fact that the effectiveness of sources may differ significantly and evenly divide – it is not the best idea. 

Who is suitable for?

It is performing well for businesses operating in the B2B sector, which plays a great importance to maintain contact with the customer during the entire cycle of the funnel.

Taking into account the interaction duration (Time Decay)

A special feature of the model is the distribution of the value of the purchase between the available channels by increment. Thus, the source, that is at the beginning of the chain, is given the least value, the channel at the end deserves the greatest value.  

Advantages

Value is shared between all channel. The highest value is given to the source that pushed the user to make a purchase.

Disadvantages

There is no fair assessment of the effectiveness of the channels, that have made efforts to obtain the desired result.

Who is suitable for?

It is ideal for evaluating the effectiveness of advertising campaigns with a limited duration.

Position-Based or U-Shaped

40% receive 2 channels, which led the user and pushed him to purchase. 20% share among themselves the intermediate sources that participated in the chain.

Advantages

Most of the value is divided equally between the key channels – the fact that attracted the user and closed the deal..

Disadvantages

Underestimated intermediate channels.It happens that they make it possible to more effectively promote the user chain.. Because they allow you to subscribe to the newsletter or start following the visitor for price reduction, etc.

Who is suitable for?

Interesting for businesses that focus on attracting new audiences, as well as pushing existing customers to buy.

Cons of standard attribution models

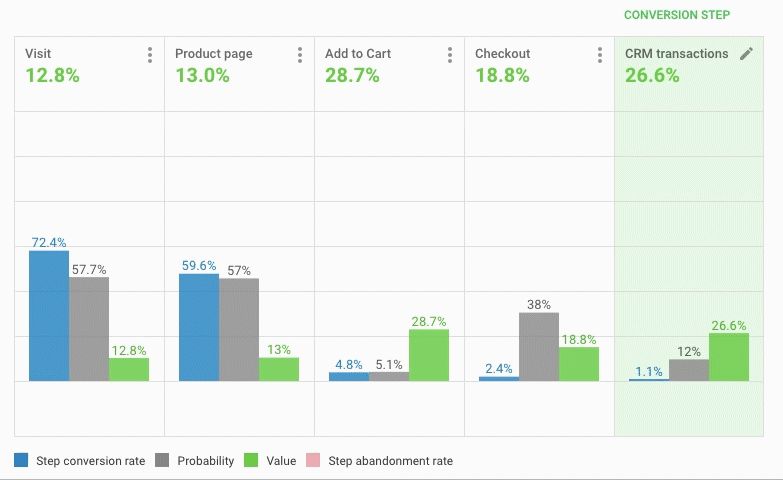
According to statistics, only 44% of foreign experts use attribution on the last interaction. Speaking about the domestic market, we can announce the numbers are much higher. However, only 18% of marketers use more complex models. There is also evidence which demonstrates that 72.4% of those who use attribution based on the last interaction, they use it not because of efficiency, but because it is simple.

What leads to a similar state of affairs?

Experts do not understand the effectiveness. Ignorance of how more complex models work leads to a lack of understanding of the real benefits for the business.

Attribution management is distributed among several employees. In view of this, different models can be used simultaneously. This approach greatly distorts the data obtained, not allowing an objective assessment of the effect of channels.

No comprehensive data storage. Information is stored in different places and does not take into account other channels. Using the analytics of the advertising office, it is impossible to work with customers in retail outlets.

You may find ways to eliminate these moments and attribution will work for the benefit of the business.

What algorithmic attribution models exist

Using one channel, there is no need to enable complex models. Attribution will be enough for the last interaction. It has everything to evaluate the effectiveness of the campaign, determine the profitability, understand the benefits for the business.

Moreover, if the number of channels increases significantly, and goals are already far beyond recognition, it will be better to give preference to more complex models. They allow you to collect all the information in one place, open up limitless monitoring capabilities, make it clear how one channel affects the other and which bundles work better together.

Below are the well-known and widely used today algorithmic attribution models.

Data-Driven Attribution

A model that allows you to track all the way that the consumer has done before making a purchase. It objectively evaluates each channel and does not take into account the position of the source in the funnel. It demonstrates how a certain interaction affected the outcome. Data-Driven attribution model is used in Google Analytics 360.

With it, you can work efficiently with channels that are underestimated in simpler models. It gives the opportunity to distribute the advertising budget correctly.

Attribution based on Markov’s Chains (Markov Chains)

Markov’s chain has been used for a long time to predict weather, matches, etc. The model allows you to find out, how the lack of a channel will affect sales. Its advantage is the ability to assess the impact of the source on the conversion, to find out which channel brings the best results.

A great option for companies that store data in one service. To implement requires knowledge of programming. It has one drawback in the form of underestimating the first channel in the chain. 

OWOX BI Attribution

OWOX BI Attribution helps you assess the mutual influence of channels on encouraging a customer through the funnel and achieving a conversion.

What information can be processed:

  • Upload user data from Google Analytics using flexible built-in tools.
  • Process information from various advertising services.
  • Integrate the model with CRM systems.

This approach makes it possible not to lose sight of any channel. Analyze the complex impact of marketing tools, correctly distributing the advertising budget.

The model uses CRM information, which makes it possible to do end-to-end analytics. Each user is assigned an identifier, so no matter what device he came from, you can track the chain of actions and understand that it is him. This allows you to see the overall effect of each channel on the conversion.

Advantages

Provides an integrated approach to assessing the effectiveness of channels, allows you to identify consumers, even with different devices, view all visits. It helps to determine where the user came from, what prompted him to do so. With it, you can control the execution of orders in CRM, to estimate the margin. To evaluate in combination with other models in order to determine the highest priority advertising campaigns that bring the most profit.

Disadvantages

It is impossible to objectively evaluate the first step of the chain.

Who is suitable for?

Suitable for all businesses that aim to account for each step of the chain and the qualitative assessment of all advertising channels.

Conclusion

The above-mentioned Ad Roll study shows that 70% of marketing managers find it difficult to use the results obtained from attribution. Moreover, there will be no result without it.

To obtain a realistic assessment of the effectiveness of marketing activities, do the following:

  • Determine priority KPIs.
  • Appoint a person responsible for evaluating advertising campaigns.
  • Define a user funnel chain.
  • Keep track of all data, online and offline. 
  • Make a diagnosis of incoming data.
  • Find the best attribution model for your business.
  • Use the data to make decisions.

The Power of Analyzing Processes

Are you thinking BIG enough? Over the past few years, the quality of discussion regarding a ‘process’ and its interfaces between different departments has developed radically. Organizations increasingly reject guesswork, individual assessments, or blame-shifting and instead focus on objective facts: the display of throughput times, process variants, and their optimization.

But while data can hold valuable insights into business, users, customer bases, and markets, companies are sometimes unsure how best to analyze and harness their data. In fact, the problem isn’t usually a lack of data; it’s a breakdown in leveraging useful data. Being unsure how to interpret, explore, and analyze processes can paralyze any go-live, leading to a failure in the efficient interaction of processes and business operations. Without robust data analysis, your business could be losing money, talent, and even clients.

After all, analyzing processes is about letting data tell its true story for improved understanding.

The “as-is” processes

Analyzing the as-is current state helps organizations document, track, and optimize processes for better performance, greater efficiency, and improved outcomes. By contextualizing data, we gain the ability to navigate and organize processes to negate bottlenecks, set business preferences, and plan an optimized route through process mining initiatives. This focus can help across an entire organization, or on one or more specific processes or trends within a department or team.

There are several vital goals/motivations for implementing current state analysis, including:

  • Saving money and improving ROI;
  • Improving existing processes or creating new processes;
  • Increasing customer satisfaction and journeys;
  • Improving business coordination and organizational responsiveness;
  • Complying with new regulatory standards;
  • Adapting methods following a merger or acquisition.

The “to-be” processes

Simply put, if as-is maps where your processes are, to-be maps where you want them to… be. To-be process mapping documents what you want the process to look like, and by using the as-is diagram, you can work with stakeholders to identify developments and improvements of the current process, then outline those changes on your to-be roadmap.

This analysis can help you make optimal decisions for your business and innovative OpEx imperatives. For instance, at leading data companies like Google and Amazon, data is used in such a way that the analysis results make the decisions! Just think of the power Recommendation Engines, PageRank, and Demand Forecasting Systems have over the content we see. To achieve this, advanced techniques of machine learning and statistical modeling are applied, resulting in mechanically improved results from the data. Interestingly, because these techniques reference large-scale data sets and reflect analysis and results in real-time, they are applied to areas that extend beyond human decision-making.

Also, by analyzing and continuously monitoring qualitative and quantitative data, we gain insights across potential risks and ongoing improvement opportunities, too. The powerful combination of process discovery, process analysis, and conformance checking supports a collaborative approach to process improvement, giving you game-changing insights into your business. For example:

  • Which incidents would I like to detect and act upon proactively?
  • Where would task prioritization help improve overall performance?
  • Where do I know that increased transparency would help the company?
  • How can I utilize processes in place of gut feeling/experience?

Further, as the economic environment continues to change rapidly, and modern organizations keep adopting process-based approaches to ensure they are achieving their business goals, process analysis naturally becomes the perfect template for any company.

With this, process mining technology can help modern businesses manage process challenges beyond the boundaries of implementation. We can evaluate the proof of concept (PoC) for any proposed improvements, and extract relevant information from a homogenous data set. Of course, process modeling and business process management (BPM) are available to solve the potentially tricky integration phase.

Process mining and analysis initiatives

Process mining and discovery initiatives can also provide critical insights throughout the automation and any Robotic Process Automation (RPA) journey, from defining the strategy to continuous improvement and innovation. Data-based process mining can even extend process analysis across teams and individuals, decreasing incident resolution times, and subsequently improving working habits via the discovery and validation of automation opportunities.

A further example of where process mining and strategic process analysis/alignment is already paying dividends is IT incident management. Here, “incident” is an unplanned interruption to an IT service, which may be complete unavailability or merely a reduction in quality. The goal of the incident management process is to restore regular service operation as quickly as possible and to minimize the impact on business operations. Incident management is a critical process in Information Technology Library (ITIL).

Process mining can also further drive improvement in as-is incident management processes as well as exceptional and unwanted process steps, by increasing visibility and transparency across IT processes. Process mining will swiftly analyze the different working habits across teams and individuals, decreasing incident resolution times, and subsequently improving customer impact cases.

Positive and practical experiences with process mining across industries have also led to the further dynamic development of tools, use cases, and the end-user community. Even with very experienced process owners, the visualization of processes can skyrocket improvement via new ideas and discussion.

However, the potential performance gains are more extensive, with the benefits of using process mining for incident management, also including:

  • Finding out how escalation rules are working and how the escalation is done;
  • Calculating incident management KPIs, including SLA (%);
  • Discovering root causes for process problems;
  • Understanding the effect of the opening interface (email, web form, phone, etc.);
  • Calculating the cost of the incident process;
  • Aligning the incident management system with your incident management process.

Robotic Process Automation (RPA)

Robotic process automation (RPA) provides a virtual workforce to automatize manual, repetitive, and error-prone tasks. However, successful process automation requires specific knowledge about the intended (and potential) benefits, effective training of the robots, and continuous monitoring of their performance and processes.

With this, process mining supports organizations throughout the lifecycle of RPA initiatives by monitoring and benchmarking robots to ensure sustainable benefits. These insights are especially valuable for process miners and managers with a particular interest in process automation. By unlocking the experiences with process mining, a company better understands what is needed today, for tomorrow’s process initiatives.

To further upgrade the impact of robot-led automation, there is also a need for a solid understanding of legacy systems, and an overview of automation opportunities. Process mining tools provide key insights throughout the entire RPA journey, from defining the strategy to continuous improvement and innovation.

Benefits of process mining and analysis within the RPA lifecycle include:

  1. Overviews of processes within the company, based on specific criteria;
  2. Identification of processes suitable for RPA implementation during the preparation phase;
  3. Mining the optimal process flow/process path;
  4. Understanding the extent to which RPA can be implemented in legacy processes and systems;
  5. Monitoring and analysis of RPA performance during the transition/handover of customization;
  6. Monitoring and continuous improvement of RPA in the post-implementation phase.

The process of better business understanding

Every organization is different and brings with it a variety of process-related questions. Yet some patterns are usually repeated. For example, customers who introduce data supported process analysis as part of business transformation initiatives will typically face challenges in harmonizing processes from fragmented sectors and regional locations. Here it helps enormously to base actions on data and statistics from the respective processes, instead of relying on the instincts and estimations of individuals.

With this, process analysis which is supported by data, enables a fact-based discussion, and builds a bridge between employees, process experts and management. This helps avoid siloed thinking, as well as allowing the transparent design of handovers and process steps which cross departmental boundaries within an organization.

In other words, to unlock future success and transformation, we must be processing… today.

Find out more about process mining with Signavio Process Intelligence, and see how it can help your organization uncover the hidden value of process, generate fresh ideas, and save time and money.

Accelerate your AI Skills Today: A Million Dollar Job!

The skyrocketing salaries ($1m per year) of AI engineers is not a hype. It is the fact of current corporate world, where you will witness a shift that is inevitable.

We’ve already set our feet at the edge of the technological revolution. A revolution that is at the verge of altering the way we live and work. As the fact suggests, humanity has fundamentally developed human production in three revolutions, and we’re now entering the fourth revolution. In its scope, the fourth revolution projects a transformation that is unlike anything we humans have ever experienced.

  • The first revolution had the world transformed from rural to urban
  • the emergence of mass production in the second revolution
  • third introduced the digital revolution
  • The fourth industrial revolution is anxious to integrate technologies into our lives.

And all thanks to artificial intelligence (AI). An advanced technology that surrounds us, from virtual assistants to software that translates to self-driving cars.

The rise of AI at an exponential rate has disrupted almost every industry. So much so that AI is being rated as one-million-dollar profession.

Did this grab your attention? It did?

Now, what if we were to tell you that the salary compensation for AI experts has grown dramatically. AI and machine learning are fields that have a mountain of demand in the tech industry today but has sparse supply.

AI field is growing at a quicker pace and salaries are skyrocketing! Read it for yourself to know what AI experts, AI researchers and any other AI talent are commanding today.

  • A top-class AI research laboratory, OpenAI says that techies in the AI field are projected to earn a salary compensation ranging between $300 to $500k for fresh graduates. However, expert professionals could earn anywhere up to $1m.
  • Whopping salary package of above 100 million yen that amounts to $1m is being offered to AI geniuses by a Japanese firm, Start Today. A firm that operates a fashion shopping website named Zozotown.

Does this leave you with a question – Is this a right opportunity for you to jump in the field and make hay while the sun is shining? 

And the answer to this question is – yes, it is the right opportunity for any developer seeking a role in the AI industry. It can be your chance to bridge the skill shortage in the AI field either by upskilling or reskilling yourself in the field of AI.

There are a wide varieties of roles available for an AI enthusiast like you. And certain areas are like AI Engineers and AI Researchers are high in demand, as there are not many professionals who have robust AI knowledge.

According to a job report, “The Future of Jobs 2018,” a prediction was made suggesting that machines and algorithms will create around 133 million new job roles by 2022.

AI and machine learning will dominate the tech world. The World Economic Forum says that several sectors have started embracing AI and machine learning to tackle challenges in certain fields such as advertising, supply chain, manufacturing, smart cities, drones, and cybersecurity.

Unraveling the AI realm

From chatbots to financial planners, AI is impacting the way businesses function on a day-today basis. AI makes the work simpler, as it provides variables, which makes the work more streamlined.

Alright! You know that

  • the demand for AI professionals is rising exponentially and that there is just a trickle of supply
  • the AI professionals are demanding skyrocketing salaries

However, beyond that how much more do you know about AI?

Considering the fact that our lives have already been touched by AI (think Alexa, and Siri), it is just a matter of time when AI will become an indispensable part of our lives.

As Gartner predicts that 2020 will be an important year for business growth in AI. Thus, it is possible to witness significant sparks for employment growth. Though AI predicts to diminish 1.8 million jobs, it is also said to replace it with 2.3 million jobs that will be created. As we look forward to stepping into 2020, AI-related job roles are set to make positive progress of achieving 2 million net-new employments by 2025.

With AI promising to score fat paychecks that would reach millions, AI experts are struggling to find new ways to pick up nouveau skills. However, one of the biggest impacts that affect the job market today is the scarcity of talent in this field.

The best way to stay relevant and employable in AI is probably by “reskilling,” and “upskilling.” And  AI certifications is considered ideal for those in the current workforce.

Looking to upskill yourself – here’s how you can become an AI engineer today.

Top three ways to enhance your artificial intelligence career:

  1. Acquire skills in Statistics and Machine Learning: If you’re getting into the field of machine learning, it is crucial that you have in-depth knowledge of statistics. Statistics is considered a prerequisite to the ML field. Both the fields are tightly related. Machine learning models are created to make accurate predictions while statistical models do the job of interpreting the relationship between variables. Many ML techniques heavily rely on the theory obtained through statistics. Thus, having extensive knowledge in statistics help initiate the first step towards an AI career.
  2. Online certification programs in AI skills: Opting for AI certifications will boost your credibility amongst potential employers. Certifications will also enhance your earning potential and increase your marketability. If you’re looking for a change and to be a part of something impactful; join the AI bandwagon. The IT industry is growing at breakneck speed; it is now that businesses are realizing how important it is to hire professionals with certain skillsets. Specifically, those who are certified in AI are becoming sought after in the job market.
  3. Hands-on experience: There’s a vast difference in theory and practical knowledge. One needs to familiarize themselves with the latest tools and technologies used by the industry. This is possible only if the individual is willing to work on projects and build things from scratch.

Despite all the promises, AI does prove to be a threat to job holders, if they don’t upskill or reskill themselves. The upcoming AI revolution will definitely disrupt the way we work, however, it will leave room for humans to perform more creative jobs in the future corporate world.

So a word of advice is to be prepared and stay future ready.

Visual Question Answering with Keras – Part 1

This is Part I of II of the Article Series Visual Question Answering with Keras

Making Computers Intelligent to answer from images

If we look closer in the history of Artificial Intelligence (AI), the Deep Learning has gained more popularity in the recent years and has achieved the human-level performance in the tasks such as Speech Recognition, Image Classification, Object Detection, Machine Translation and so on. However, as humans, not only we but also a five-year child can normally perform these tasks without much inconvenience. But the development of such systems with these capabilities has always considered an ambitious goal for the researchers as well as for developers.

In this series of blog posts, I will cover an introduction to something called VQA (Visual Question Answering), its available datasets, the Neural Network approach for VQA and its implementation in Keras and the applications of this challenging problem in real life. 

Table of Contents:

1 Introduction

2 What is exactly Visual Question Answering?

3 Prerequisites

4 Datasets available for VQA

4.1 DAQUAR Dataset

4.2 CLEVR Dataset

4.3 FigureQA Dataset

4.4 VQA Dataset

5 Real-life applications of VQA

6 Conclusion


  1. Introduction:

Let’s say you are given a below picture along with one question. Can you answer it?

I expect confidently you all say it is the Kitchen without much inconvenience which is also the right answer. Even a five-year child who just started to learn things might answer this question correctly.

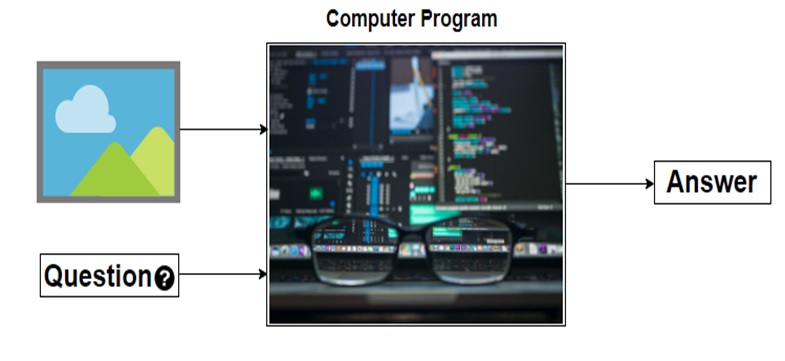
Alright, but can you write a computer program for such type of task that takes image and question about the image as an input and gives us answer as output?

Before the development of the Deep Neural Network, this problem was considered as one of the difficult, inconceivable and challenging problem for the AI researcher’s community. However, due to the recent advancement of Deep Learning the systems are capable of answering these questions with the promising result if we have a required dataset.

Now I hope you have got at least some intuition of a problem that we are going to discuss in this series of blog posts. Let’s try to formalize the problem in the below section.

  1. What is exactly Visual Question Answering?:

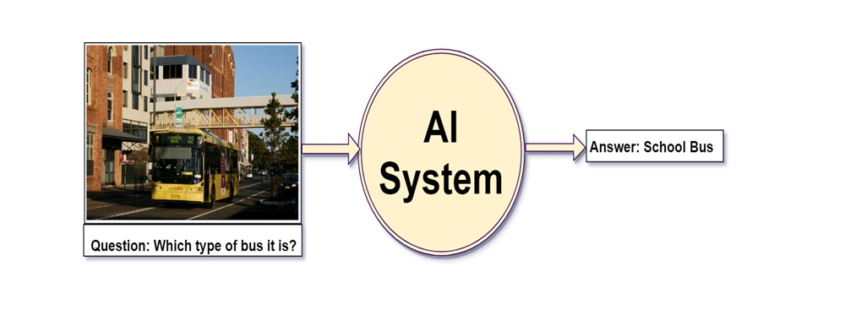
We can define, “Visual Question Answering(VQA) is a system that takes an image and natural language question about the image as an input and generates natural language answer as an output.”

VQA is a research area that requires an understanding of vision(Computer Vision)  as well as text(NLP). The main beauty of VQA is that the reasoning part is performed in the context of the image. So if we have an image with the corresponding question then the system must able to understand the image well in order to generate an appropriate answer. For example, if the question is the number of persons then the system must able to detect faces of the persons. To answer the color of the horse the system need to detect the objects in the image. Many of these common problems such as face detection, object detection, binary object classification(yes or no), etc. have been solved in the field of Computer Vision with good results.

To summarize a good VQA system must be able to address the typical problems of CV as well as NLP.

To get a better feel of VQA you can try online VQA demo by CloudCV. You just go to this link and try uploading the picture you want and ask the related question to the picture, the system will generate the answer to it.


  1. Prerequisites:

In the next post, I will walk you through the code for this problem using Keras. So I assume that you are familiar with:

  1. Fundamental concepts of Machine Learning
  2. Multi-Layered Perceptron
  3. Convolutional Neural Network
  4. Recurrent Neural Network (especially LSTM)
  5. Gradient Descent and Backpropagation
  6. Transfer Learning
  7. Hyperparameter Optimization
  8. Python and Keras syntax
  1. Datasets available for VQA:

As you know problems related to the CV or NLP the availability of the dataset is the key to solve the problem. The complex problems like VQA, the dataset must cover all possibilities of questions answers in real-world scenarios. In this section, I will cover some of the datasets available for VQA.

4.1 DAQUAR Dataset:

The DAQUAR dataset is the first dataset for VQA that contains only indoor scenes. It shows the accuracy of 50.2% on the human baseline. It contains images from the NYU_Depth dataset.

Example of DAQUAR dataset

Example of DAQUAR dataset

The main disadvantage of DAQUAR is the size of the dataset is very small to capture all possible indoor scenes.

4.2 CLEVR Dataset:

The CLEVR Dataset from Stanford contains the questions about the object of a different type, colors, shapes, sizes, and material.

It has

  • A training set of 70,000 images and 699,989 questions
  • A validation set of 15,000 images and 149,991 questions
  • A test set of 15,000 images and 14,988 questions

Image Source: https://cs.stanford.edu/people/jcjohns/clevr/?source=post_page


4.3 FigureQA Dataset:

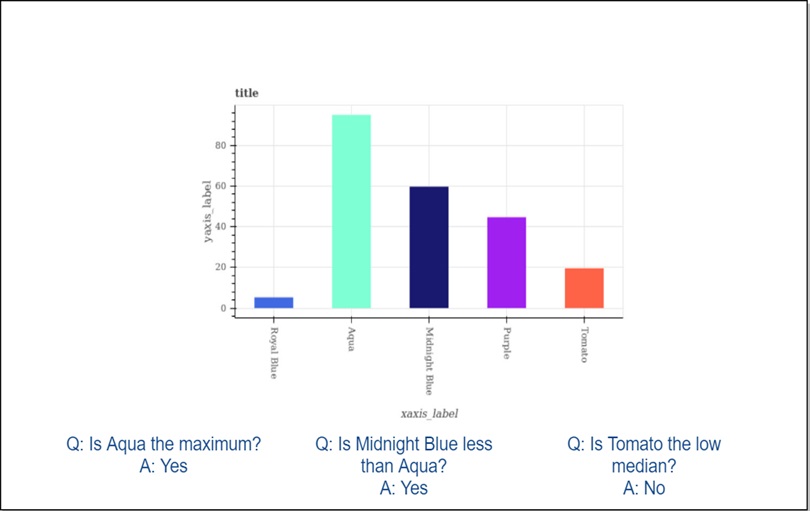
FigureQA Dataset contains questions about the bar graphs, line plots, and pie charts. It has 1,327,368 questions for 100,000 images in the training set.

4.4 VQA Dataset:

As comapred to all datasets that we have seen so far VQA dataset is relatively larger. The VQA dataset contains open ended as well as multiple choice questions. VQA v2 dataset contains:

  • 82,783 training images from COCO (common objects in context) dataset
  • 40, 504 validation images and 81,434 validation images
  • 443,757 question-answer pairs for training images
  • 214,354 question-answer pairs for validation images.

As you might expect this dataset is very huge and contains 12.6 GB of training images only. I have used this dataset in the next post but a very small subset of it.

This dataset also contains abstract cartoon images. Each image has 3 questions and each question has 10 multiple choice answers.

  1. Real-life applications of VQA:

There are many applications of VQA. One of the famous applications is to help visually impaired people and blind peoples. In 2016, Microsoft has released the “Seeing AI” app for visually impaired people to describe the surrounding environment around them. You can watch this video for the prototype of the Seeing AI app.

Another application could be on social media or e-commerce sites. VQA can be also used for educational purposes.

  1. Conclusion:

I hope this explanation will give you a good idea of Visual Question Answering. In the next blog post, I will walk you through the code in Keras.

If you like my explanations, do provide some feedback, comments, etc. and stay tuned for the next post.

The New Age of Big Data: Is It the Death of Hadoop?

Big Data had gone through several transformations through the years, growing into the phrase we identify it as today. From its first identified use on the back of Hadoop and MapReduce, a new age of Big Data has been ushered in with the spread of new technologies such as Kubernetes, Spark, and NoSQL databases.

These might not serve the exact same purpose as Hadoop individually, but they fill the same niche and do the same job with features the original platform designers never envisioned.

The multi-cloud architecture boom and increasing emphasis on real-time data may just mean the end of Big Data as we know it, and Hadoop with it.

A brief history of Big Data

The use of data for making business decisions can be traced back to ancient civilizations in Mesopotamia. However, the age of Big Data as we know it is only as old as 2005 when O’Reilly Media launched the phrase. It was used to describe the massive amounts of data that the world was beginning to produce on the internet.

The newly-dubbed Web 2.0 needed to be indexed and easily searchable, and, Yahoo, being the behemoth that it was, was just the right company for the job. Hadoop was born off the efforts of Yahoo engineers, depending on Google’s MapReduce under the hood. A new era of Big Data had begun, and Hadoop was at the forefront of the revolution.

The new technologies led to a fundamental shift in the way the world regarded data processing. Traditional assumptions of atomicity, consistency, isolation, and durability (ACID) began to fade, and new use cases for previously unusable data began to emerge.

Hadoop would begin its life as a commercial platform with the launch of Cloudera in 2008, followed by rivals such as Hortonworks, EMC and MapR. It continued its momentous run until it seemingly hit its peak in 2015, and its place in the enterprise market would never be guaranteed again

Where Hadoop Couldn’t Keep Up

Hadoop made its mark in the world of Big Data by being a platform to collect, store and analyze large swathes of data. However, not even a technology as revolutionary and versatile as Hadoop could exist without its drawbacks.

Some of these would be so costly developers would rather design whole new systems to deal with them. With time, Hadoop started to lose its charm, unable to grow past its initial vision as a Big Data software.

Hadoop is a machine made up of smaller moving parts that are incredibly efficient at what they do – crunch data. This ultimately results in one of the first drawbacks of Hadoop – it does not come with built-in support for analytics data. Hadoop works well to process your data, but not likely as you need – visual reports about how the data is being processed, for instance.

MapReduce was also built from the ground up to be file-intensive. This makes it a great piece of software for simple requests, but not so much for iterative data. For smaller datasets, it turns out to be a rather inefficient solution.

Another area Hadoop lands flat on its face is with regards to real-time processing and reporting. Hadoop suffers from the curse of time. It relies on technologies that even its very founders (Google in particular) no longer rely on.

With MapReduce, every time you want to analyze a modified dataset (say, after adding or deleting data), you have to stream over the whole dataset again. Thanks to this feature, Hadoop is horrible at real-time reporting – a feature that led to the creation of Percolator, MapReduce’s replacement within Google.

The emergence of better technology has also meant a rise in the number of threats to said technology and a corresponding increase in the emphasis that is placed on it.

Unfortunately, Hadoop is nowhere close to being secure. As a matter of fact, its security settings are off by default, and it has too much inertia to simply change that. To make things worse, plugging in security measures isn’t that much easier.

The Fall of Hadoop

With these and more shortcomings in the data science world, new tools such as Hive, Pig and Spark were created to work on top of Hadoop to overcome its weaknesses. But it simply couldn’t grow out of the shoes it had been made for.

The growth of NoSQL databases such as Hazelcast and MongoDB also meant that problems Hadoop was designed to support were now being solved by single players rather than the ‘all or nothing’ approach Hadoop was designed with. It wasn’t flexible enough to evolve beyond simply being a batch processing software.

Over time, new Big Data challenges began to emerge that a large monolithic software like Hadoop couldn’t deal with, either. Being primarily file-intensive, it couldn’t keep up with the variety of data sources that were now available, the lack of support for dynamic schemas, on-the-fly queries, and the rise of cloud infrastructure all caused people to seek different solutions. Hadoop had lost its grip on the enterprise world.

Businesses whose primary concern was dealing with Hadoop infrastructure like Cloudera and Hortonworks were seeing less and less adoption. This led to the eventual merger of the two companies in 2019, and the same message rang out from different corners of the world at the same time: ‘Hadoop is dead.’

Is Hadoop Really Dead?

Hadoop still has a place in the enterprise world – the problems it was designed to solve still exist to this day. Technologies such as Spark have largely taken over the same space that Hadoop once occupied.

The question of Hadoop or Spark is one every data scientist has to contend with at some point, and most seem to be settling in the latter of these, thanks to the great advantages is speed it offers.

It’s unlikely Hadoop will see much more adoption with newer marker entrants, especially considering the pace with which technology moves. It also doesn’t help that a lot of alternatives have a much smaller learning curve than the convoluted monolith that is Hadoop. Companies like MapR and Cloudera have also begun to pivot away from Hadoop-only infrastructure to more robust cloud-based solutions. Hadoop still has its place, but maybe not for long.

From BI to PI: The Next Step in the Evolution of Data-Driven Decisions

“Change is a constant.” “The pace of change is accelerating.” “The world is increasingly complex, and businesses have to keep up.” Organizations of all shapes and sizes have heard these ideas over and over—perhaps too often! However, the truth remains that adaptation is crucial to a successful business.


Read this article in German: Von der Datenanalyse zur Prozessverbesserung: So gelingt eine erfolgreiche Process-Mining-Initiative


Of course, the only way to ensure that the decisions you make are evolving in the right way is to understand the underlying building blocks of your organization. You can think of it as DNA; the business processes that underpin the way you work and combine to create a single unified whole. Knowing how those processes operate, and where the opportunities for improvement lie, can be the difference between success and failure.

Businesses with an eye on their growth understand this already. In the past, Business Intelligence was seen as the solution to this challenge. In more recent times, forward-thinking organizations see the need for monitoring solutions that can keep up with today’s rate of change, at the same time as they recognize that increasing complexity within business processes means traditional methods are no longer sufficient.

Adapting to a changing environment? The challenges of BI

Business Intelligence itself is not necessarily defunct or obsolete. However, the tools and solutions that enable Business Intelligence face a range of challenges in a fast-paced and constantly changing world. Some of these issues may include:

  • High data latency – Data latency refers to how long it takes for a business user to retrieve data from, for example, a business intelligence dashboard. In many cases, this can take more than 24 hours, a critical time period when businesses are attempting to take advantage of opportunities that may have a limited timeframe.
  • Incomplete data sets – The broad approach of Business Intelligence means investigations may run wide but not deep. This increases the chances that data will be missed, especially in instances where the tools themselves make the parameters for investigations difficult to change.
  • Discovery, not analysis – Business intelligence tools are primarily optimized for exploration, with a focus on actually finding data that may be useful to their users. Often, this is where the tools stop, offering no simple way for users to actually analyze the data, and therefore reducing the possibility of finding actionable insights.
  • Limited scalability – In general, Business Intelligence remains an arena for specialists and experts, leaving a gap in understanding for operational staff. Without a wide appreciation for processes and their analysis within an organization, the opportunities to increase the application of a particular Business Intelligence tool will be limited.
  • Unconnected metrics – Business Intelligence can be significantly restricted in its capacity to support positive change within a business through the use of metrics that are not connected to the business context. This makes it difficult for users to interpret and understand the results of an investigation, and apply these results to a useful purpose within their organization.

Process Intelligence: the next evolutionary step

To ensure companies can work efficiently and make the best decisions, a more effective method of process discovery is needed. Process Intelligence (PI) provides the critical background to answer questions that cannot be answered with Business Intelligence tools.

Process Intelligence offers visualization of end-to-end process sequences using raw data, and the right Process Intelligence tool means analysis of that raw data can be conducted straight away, so that processes are displayed accurately. The end-user is free to view and work with this accurate information as they please, without the need to do a preselection for the analysis.

By comparison, because Business Intelligence requires predefined analysis criteria, only once the criteria are defined can BI be truly useful. Organizations can avoid delayed analysis by using Process Intelligence to identify the root causes of process problems, then selecting the right criteria to determine the analysis framework.

Then, you can analyze your system processes and see the gaps and variants between the intended business process and what you actually have. And of course, the faster you discover what you have, the faster you can apply the changes that will make a difference in your business.

In short, Business Intelligence is suitable for gaining a broad understanding of the way a business usually functions. For some businesses, this will be sufficient. For others, an overview is not enough.

They understand that true insights lie in the detail, and are looking for a way of drilling down into exactly how each process within their organization actually works. Software that combines process discovery, process analysis, and conformance checking is the answer.

The right Process Intelligence tools means you will be able to automatically mine process models from the different IT systems operating within your business, as well as continuously monitor your end-to-end processes for insights into potential risks and ongoing improvement opportunities. All of this is in service of a collaborative approach to process improvement, which will lead to a game-changing understanding of how your business works, and how it can work better.

Early humans evolved from more primitive ancestors, and in the process, learned to use more and more sophisticated tools. For the modern human, working in a complex organization, the right tool is Process Intelligence.

Endless Potential with Signavio Process Intelligence

Signavio Process Intelligence allows you to unearth the truth about your processes and make better decisions based on true evidence found in your organization’s IT systems. Get a complete end-to-end perspective and understanding of exactly what is happening in your organization in a matter of weeks.

As part of Signavio Business Transformation Suite, Signavio Process Intelligence integrates perfectly with Signavio Process Manager and is accessible from the Signavio Collaboration Hub. As an entirely cloud-based process mining solution, the tool makes it easy to collaborate with colleagues from all over the world and harness the wisdom of the crowd.

Find out more about Signavio Process Intelligence, and see how it can help your organization generate more ideas, save time and money, and optimize processes.

A Bird’s Eye View: How Machine Learning Can Help You Charge Your E-Scooters

Bird scooters in Columbus, Ohio

Bird scooters in Columbus, Ohio

Ever since I started using bike-sharing to get around in Seattle, I have become fascinated with geolocation data and the transportation sharing economy. When I saw this project leveraging the mobility data RESTful API from the Los Angeles Department of Transportation, I was eager to dive in and get my hands dirty building a data product utilizing a company’s mobility data API.

Unfortunately, the major bike and scooter providers (Bird, JUMP, Lime) don’t have publicly accessible APIs. However, some folks have seemingly been able to reverse-engineer the Bird API used to populate the maps in their Android and iOS applications.

One interesting feature of this data is the nest_id, which indicates if the Bird scooter is in a “nest” — a centralized drop-off spot for charged Birds to be released back into circulation.

I set out to ask the following questions:

  1. Can real-time predictions be made to determine if a scooter is currently in a nest?
  2. For non-nest scooters, can new nest location recommendations be generated from geospatial clustering?

To answer these questions, I built a full-stack machine learning web application, NestGenerator, which provides an automated recommendation engine for new nest locations. This application can help power Bird’s internal nest location generation that runs within their Android and iOS applications. NestGenerator also provides real-time strategic insight for Bird chargers who are enticed to optimize their scooter collection and drop-off route based on proximity to scooters and nest locations in their area.

Bird

The electric scooter market has seen substantial growth with Bird’s recent billion dollar valuation  and their $300 million Series C round in the summer of 2018. Bird offers electric scooters that top out at 15 mph, cost $1 to unlock and 15 cents per minute of use. Bird scooters are in over 100 cities globally and they announced in late 2018 that they eclipsed 10 million scooter rides since their launch in 2017.
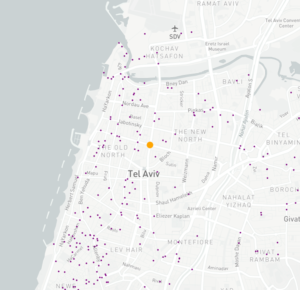
Bird scooters in Tel Aviv, Israel

Bird scooters in Tel Aviv, Israel

With all of these scooters populating cities, there’s much-needed demand for people to charge them. Since they are electric, someone needs to charge them! A charger can earn additional income for charging the scooters at their home and releasing them back into circulation at nest locations. The base price for charging each Bird is $5.00. It goes up from there when the Birds are harder to capture.

Data Collection and Machine Learning Pipeline
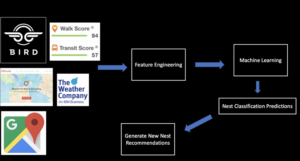
The full data pipeline for building “NestGenerator”

Data

From the details here, I was able to write a Python script that returned a list of Bird scooters within a specified area, their geolocation, unique ID, battery level and a nest ID.

I collected scooter data from four cities (Atlanta, Austin, Santa Monica, and Washington D.C.) across varying times of day over the course of four weeks. Collecting data from different cities was critical to the goal of training a machine learning model that would generalize well across cities.

Once equipped with the scooter’s latitude and longitude coordinates, I was able to leverage additional APIs and municipal data sources to get granular geolocation data to create an original scooter attribute and city feature dataset.

Data Sources:

  • Walk Score API: returns a walk score, transit score and bike score for any location.
  • Google Elevation API: returns elevation data for all locations on the surface of the earth.
  • Google Places API: returns information about places. Places are defined within this API as establishments, geographic locations, or prominent points of interest.
  • Google Reverse Geocoding API: reverse geocoding is the process of converting geographic coordinates into a human-readable address.
  • Weather Company Data: returns the current weather conditions for a geolocation.
  • LocationIQ: Nearby Points of Interest (PoI) API returns specified PoIs or places around a given coordinate.
  • OSMnx: Python package that lets you download spatial geometries and model, project, visualize, and analyze street networks from OpenStreetMap’s APIs.

Feature Engineering

After extensive API wrangling, which included a four-week prolonged data collection phase, I was finally able to put together a diverse feature set to train machine learning models. I engineered 38 features to classify if a scooter is currently in a nest.
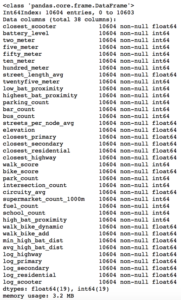
Full Feature Set

Full Feature Set

The features boiled down into four categories:

  • Amenity-based: parks within a given radius, gas stations within a given radius, walk score, bike score
  • City Network Structure: intersection count, average circuity, street length average, average streets per node, elevation level
  • Distance-based: proximity to closest highway, primary road, secondary road, residential road
  • Scooter-specific attributes: battery level, proximity to closest scooter, high battery level (> 90%) scooters within a given radius, total scooters within a given radius


Log-Scale Transformation

For each feature, I plotted the distribution to explore the data for feature engineering opportunities. For features with a right-skewed distribution, where the mean is typically greater than the median, I applied these log transformations to normalize the distribution and reduce the variability of outlier observations. This approach was used to generate a log feature for proximity to closest scooter, closest highway, primary road, secondary road, and residential road.

An example of a log transformation

Statistical Analysis: A Systematic Approach

Next, I wanted to ensure that the features I included in my model displayed significant differences when broken up by nest classification. My thinking was that any features that did not significantly differ when stratified by nest classification would not have a meaningful predictive impact on whether a scooter was in a nest or not.

Distributions of a feature stratified by their nest classification can be tested for statistically significant differences. I used an unpaired samples t-test with a 0.01% significance level to compute a p-value and confidence interval to determine if there was a statistically significant difference in means for a feature stratified by nest classification. I rejected the null hypothesis if a p-value was smaller than the 0.01% threshold and if the 99.9% confidence interval did not straddle zero. By rejecting the null-hypothesis in favor of the alternative hypothesis, it’s deemed there is a significant difference in means of a feature by nest classification.

Battery Level Distribution Stratified by Nest Classification to run a t-test

Battery Level Distribution Stratified by Nest Classification to run a t-test

Log of Closest Scooter Distribution Stratified by Nest Classification to run a t-test

Throwing Away Features

Using the approach above, I removed ten features that did not display statistically significant results.
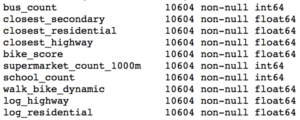
Statistically Insignificant Features Removed Before Model Development

Model Development

I trained two models, a random forest classifier and an extreme gradient boosting classifier since tree-based models can handle skewed data, capture important feature interactions, and provide a feature importance calculation. I trained the models on 70% of the data collected for all four cities and reserved the remaining 30% for testing.

After hyper-parameter tuning the models for performance on cross-validation data it was time to run the models on the 30% of test data set aside from the initial data collection.

I also collected additional test data from other cities (Columbus, Fort Lauderdale, San Diego) not involved in training the models. I took this step to ensure the selection of a machine learning model that would generalize well across cities. The performance of each model on the additional test data determined which model would be integrated into the application development.

Performance on Additional Cities Test Data

The Random Forest Classifier displayed superior performance across the board

The Random Forest Classifier displayed superior performance across the board

I opted to move forward with the random forest model because of its superior performance on AUC score and accuracy metrics on the additional cities test data. AUC is the Area under the ROC Curve, and it provides an aggregate measure of model performance across all possible classification thresholds.
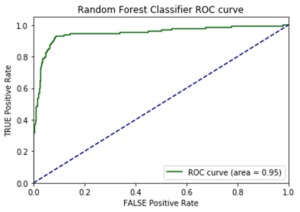
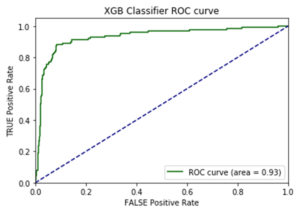
AUC Score on Test Data for each Model

AUC Score on Test Data for each Model

Feature Importance

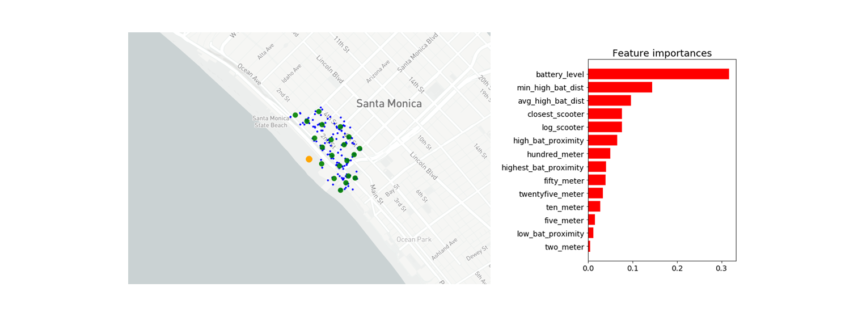
Battery level dominated as the most important feature. Additional important model features were proximity to high level battery scooters, proximity to closest scooter, and average distance to high level battery scooters.
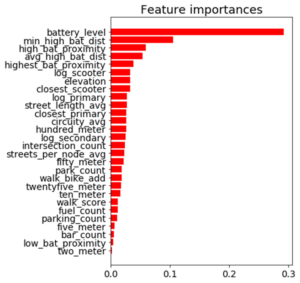
Feature Importance for the Random Forest Classifier

Feature Importance for the Random Forest Classifier

The Trade-off Space

Once I had a working machine learning model for nest classification, I started to build out the application using the Flask web framework written in Python. After spending a few days of writing code for the application and incorporating the trained random forest model, I had enough to test out the basic functionality. I could finally run the application locally to call the Bird API and classify scooter’s into nests in real-time! There was one huge problem, though. It took more than seven minutes to generate the predictions and populate in the application. That just wasn’t going to cut it.

The question remained: will this model deliver in a production grade environment with the goal of making real-time classifications? This is a key trade-off in production grade machine learning applications where on one end of the spectrum we’re optimizing for model performance and on the other end we’re optimizing for low latency application performance.

As I continued to test out the application’s performance, I still faced the challenge of relying on so many APIs for real-time feature generation. Due to rate-limiting constraints and daily request limits across so many external APIs, the current machine learning classifier was not feasible to incorporate into the final application.

Run-Time Compliant Application Model

After going back to the drawing board, I trained a random forest model that relied primarily on scooter-specific features which were generated directly from the Bird API.

Through a process called vectorization, I was able to transform the geolocation distance calculations utilizing NumPy arrays which enabled batch operations on the data without writing any “for” loops. The distance calculations were applied simultaneously on the entire array of geolocations instead of looping through each individual element. The vectorization implementation optimized real-time feature engineering for distance related calculations which improved the application response time by a factor of ten.
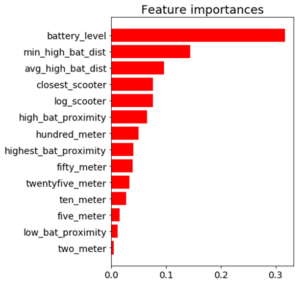
Feature Importance for the Run-time Compliant Random Forest Classifier

Feature Importance for the Run-time Compliant Random Forest Classifier

This random forest model generalized well on test-data with an AUC score of 0.95 and an accuracy rate of 91%. The model retained its prediction accuracy compared to the former feature-rich model, but it gained 60x in application performance. This was a necessary trade-off for building a functional application with real-time prediction capabilities.

Geospatial Clustering

Now that I finally had a working machine learning model for classifying nests in a production grade environment, I could generate new nest locations for the non-nest scooters. The goal was to generate geospatial clusters based on the number of non-nest scooters in a given location.

The k-means algorithm is likely the most common clustering algorithm. However, k-means is not an optimal solution for widespread geolocation data because it minimizes variance, not geodetic distance. This can create suboptimal clustering from distortion in distance calculations at latitudes far from the equator. With this in mind, I initially set out to use the DBSCAN algorithm which clusters spatial data based on two parameters: a minimum cluster size and a physical distance from each point. There were a few issues that prevented me from moving forward with the DBSCAN algorithm.

  1. The DBSCAN algorithm does not allow for specifying the number of clusters, which was problematic as the goal was to generate a number of clusters as a function of non-nest scooters.
  2. I was unable to hone in on an optimal physical distance parameter that would dynamically change based on the Bird API data. This led to suboptimal nest locations due to a distortion in how the physical distance point was used in clustering. For example, Santa Monica, where there are ~15,000 scooters, has a higher concentration of scooters in a given area whereas Brookline, MA has a sparser set of scooter locations.
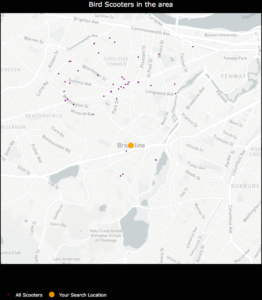
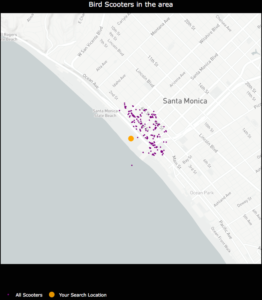
An example of how sparse scooter locations vs. highly concentrated scooter locations for a given Bird API call can create cluster distortion based on a static physical distance parameter in the DBSCAN algorithm. Left:Bird scooters in Brookline, MA. Right:Bird scooters in Santa Monica, CA.

An example of how sparse scooter locations vs. highly concentrated scooter locations for a given Bird API call can create cluster distortion based on a static physical distance parameter in the DBSCAN algorithm. Left:Bird scooters in Brookline, MA. Right:Bird scooters in Santa Monica, CA.

Given the granularity of geolocation scooter data I was working with, geospatial distortion was not an issue and the k-means algorithm would work well for generating clusters. Additionally, the k-means algorithm parameters allowed for dynamically customizing the number of clusters based on the number of non-nest scooters in a given location.

Once clusters were formed with the k-means algorithm, I derived a centroid from all of the observations within a given cluster. In this case, the centroids are the mean latitude and mean longitude for the scooters within a given cluster. The centroids coordinates are then projected as the new nest recommendations.
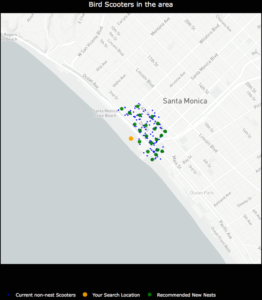
NestGenerator showcasing non-nest scooters and new nest recommendations utilizing the K-Means algorithm

NestGenerator showcasing non-nest scooters and new nest recommendations utilizing the K-Means algorithm.

NestGenerator Application

After wrapping up the machine learning components, I shifted to building out the remaining functionality of the application. The final iteration of the application is deployed to Heroku’s cloud platform.

In the NestGenerator app, a user specifies a location of their choosing. This will then call the Bird API for scooters within that given location and generate all of the model features for predicting nest classification using the trained random forest model. This forms the foundation for map filtering based on nest classification. In the app, a user has the ability to filter the map based on nest classification.
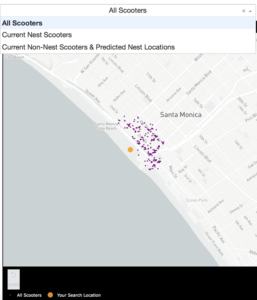
Drop-Down Map View filtering based on Nest Classification

Drop-Down Map View filtering based on Nest Classification

Nearest Generated Nest

To see the generated nest recommendations, a user selects the “Current Non-Nest Scooters & Predicted Nest Locations” filter which will then populate the application with these nest locations. Based on the user’s specified search location, a table is provided with the proximity of the five closest nests and an address of the Nest location to help inform a Bird charger in their decision-making.
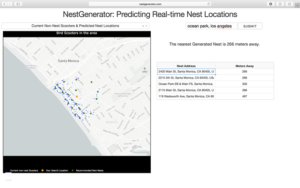
NestGenerator web-layout with nest addresses and proximity to nearest generated nests

NestGenerator web-layout with nest addresses and proximity to nearest generated nests

Conclusion

By accurately predicting nest classification and clustering non-nest scooters, NestGenerator provides an automated recommendation engine for new nest locations. For Bird, this application can help power their nest location generation that runs within their Android and iOS applications. NestGenerator also provides real-time strategic insight for Bird chargers who are enticed to optimize their scooter collection and drop-off route based on scooters and nest locations in their area.

Code

The code for this project can be found on my GitHub

Comments or Questions? Please email me an E-Mail!


Interview: Does Business Intelligence benefit from Cloud Data Warehousing?

Interview with Ross Perez, Senior Director, Marketing EMEA at Snowflake

Read this article in German:
“Profitiert Business Intelligence vom Data Warehouse in der Cloud?”

Does Business Intelligence benefit from Cloud Data Warehousing?

Ross Perez is the Senior Director, Marketing EMEA at Snowflake. He leads the Snowflake marketing team in EMEA and is charged with starting the discussion about analytics, data, and cloud data warehousing across EMEA. Before Snowflake, Ross was a product marketer at Tableau Software where he founded the Iron Viz Championship, the world’s largest and longest running data visualization competition.

Data Science Blog: Ross, Business Intelligence (BI) is not really a new trend. In 2019/2020, making data available for the whole company should not be a big thing anymore. Would you agree?

BI is definitely an old trend, reporting has been around for 50 years. People are accustomed to seeing statistics and data for the company at large, and even their business units. However, using BI to deliver analytics to everyone in the organization and encouraging them to make decisions based on data for their specific area is relatively new. In a lot of the companies Snowflake works with, there is a huge new group of people who have recently received access to self-service BI and visualization tools like Tableau, Looker and Sigma, and they are just starting to find answers to their questions.

Data Science Blog: Up until today, BI was just about delivering dashboards for reporting to the business. The data warehouse (DWH) was something like the backend. Today we have increased demand for data transparency. How should companies deal with this demand?

Because more people in more departments are wanting access to data more frequently, the demand on backend systems like the data warehouse is skyrocketing. In many cases, companies have data warehouses that weren’t built to cope with this concurrent demand and that means that the experience is slow. End users have to wait a long time for their reports. That is where Snowflake comes in: since we can use the power of the cloud to spin up resources on demand, we can serve any number of concurrent users. Snowflake can also house unlimited amounts of data, of both structured and semi-structured formats.

Data Science Blog: Would you say the DWH is the key driver for becoming a data-driven organization? What else should be considered here?

Absolutely. Without having all of your data in a single, highly elastic, and flexible data warehouse, it can be a huge challenge to actually deliver insight to people in the organization.

Data Science Blog: So much for the theory, now let’s talk about specific use cases. In general, it matters a lot whether you are storing and analyzing e.g. financial data or machine data. What do we have to consider for both purposes?

Financial data and machine data do look very different, and often come in different formats. For instance, financial data is often in a standard relational format. Data like this needs to be able to be easily queried with standard SQL, something that many Hadoop and noSQL tools were unable to provide. Luckily, Snowflake is an ansi-standard SQL data warehouse so it can be used with this type of data quite seamlessly.

On the other hand, machine data is often semi-structured or even completely unstructured. This type of data is becoming significantly more common with the rise of IoT, but traditional data warehouses were very bad at dealing with it since they were optimized for relational data. Semi-structured data like JSON, Avro, XML, Orc and Parquet can be loaded into Snowflake for analysis quite seamlessly in its native format. This is important, because you don’t want to have to flatten the data to get any use from it.

Both types of data are important, and Snowflake is really the first data warehouse that can work with them both seamlessly.

Data Science Blog: Back to the common business use case: Creating sales or purchase reports for the business managers, based on data from ERP-systems such as Microsoft or SAP. Which architecture for the DWH could be the right one? How many and which database layers do you see as necessary?

The type of report largely does not matter, because in all cases you want a data warehouse that can support all of your data and serve all of your users. Ideally, you also want to be able to turn it off and on depending on demand. That means that you need a cloud-based architecture… and specifically Snowflake’s innovative architecture that separates storage and compute, making it possible to pay for exactly what you use.

Data Science Blog: Where would you implement the main part of the business logic for the report? In the DWH or in the reporting tool? Does it matter which reporting tool we choose?

The great thing is that you can choose either. Snowflake, as an ansi-Standard SQL data warehouse, can support a high degree of data modeling and business logic. But you can also utilize partners like Looker and Sigma who specialize in data modeling for BI. We think it’s best that the customer chooses what is right for them.

Data Science Blog: Snowflake enables organizations to store and manage their data in the cloud. Does it mean companies lose control over their storage and data management?

Customers have complete control over their data, and in fact Snowflake cannot see, alter or change any aspect of their data. The benefit of a cloud solution is that customers don’t have to manage the infrastructure or the tuning – they decide how they want to store and analyze their data and Snowflake takes care of the rest.

Data Science Blog: How big is the effort for smaller and medium sized companies to set up a DWH in the cloud? Does this have to be an expensive long-term project in every case?

The nice thing about Snowflake is that you can get started with a free trial in a few minutes. Now, moving from a traditional data warehouse to Snowflake can take some time, depending on the legacy technology that you are using. But Snowflake itself is quite easy to set up and very much compatible with historical tools making it relatively easy to move over.