What is Data Warehousing and Data Mining – Know the difference between Data Warehousing and Data Mining

Getting started

Before we start off with Data Warehousing and Data Mining, let us first set the ground for the same. This will help in understanding why we need them in the first place. By the end of the post, you would feel much more acquainted with the two topics at hand. So here goes!

With the exponential increase in the generation and consumption of the data, the organizations have to deal with a humungous amount of data at their end. We all have heard the talks about data being the new oil, which is rather turning out to be a reality. Data is considered to be an extremely valuable asset for every organization and they attempt to put it to good use. The data assists the organizations in making business decisions that will generate significant revenues. It helps in understanding the current requirements of the market which is vital for some organizations to stay in business. Thus, it is essential for organizations to store the data somewhere which can be later utilized for analytical purposes.


Introduction to Data Warehousing

Data Warehousing is a process to collect and manage data from a variety of sources. The data can also come from different departments of an organization like Finance, Marketing, etc. The idea of constructing a Data Warehouse is to be able to use the data for analytical purposes and make decisions based upon the analysis. Data warehouses are a pivotal component of any analytical and business intelligence operations at an organization. As the organizations can generate data at various sources, we might need to use different tools in order to store the data at a single source. The process of data warehousing generally involves ETL (Extract – Transform – Load) tools that help to extract the data from different sources, transform the data into a suitable format, and load the data into a single source. There are some tools like Google BigQuery, Amazon Redshift, etc that allow you to connect with a vast number of sources to store the data in one place. The data warehouses can be implemented on-premise as well as on the cloud. On-premise data warehouses are implemented on the local networks of the organization while cloud data warehouses are implemented over the internet. There is always a trade-off in making decisions as to which one to choose because there are multiple factors to be considered like scalability, initial investment, recurring costs, security, speed, etc.

General steps to implement a data warehouse

  1. Determining the business objectives.

Every organization can have different business objectives that define success in its terms. Some organizations are involved in a constantly changing market which will require a large number of sources while others might just need to use the data for better administration purposes. Hence the key step to initiate the creation of a data warehouse is to include the stakeholders and determine their business objectives.

  1. Analyzing and obtaining the information regarding the objectives.

Once the business objectives are decided, the information regarding those objectives needs to be obtained. The information can be obtained using any periodic report, or any CRM application, etc depending upon the organization. An extensive amount of interaction with all the supervisors attending to that information can be crucial for this process. Interacting with the people that are daily involved in this routine can serve a lot of information. These people tend to know the bits and pieces of the entire task and any information obtained from these people can lead to better implementation of the data warehouse. This step also helps in identifying the key performance indicators for the desired objectives.

  1. Identifying the concerned departments in the organization.

The key performance indicators can be different for different organizations. For example, in an organization that deals with the manufacturing of different products, if their objective were to increase the revenue then the number of units sold would be one of the key performance indicators. Based on these indicators, the involvement of the concerned departments proves to be significant.

  1. Create a layout of the data warehouse.

With all the key performance indicators discovered, create a layout of the data warehouse. It will help in providing an overview of the entire data warehouse and the data that will be stored in it. It will determine what key indicators are being stored in the data warehouse and whether all the indicators required for our objectives exist or not. As the data will be pulled in periodically, think about all of the investment costs including the hardware costs and recurring costs.

  1. Locating the sources of data and its transformation.

After finalizing the layout, we need to locate the sources of the data and figure out how the data can be extracted from it. The data can be in a CRM application or any database, we need to export the data or make use of an ETL tool that can connect with the data source. As the data comes from different sources, there is a need to consolidate all of the data. Also, there are high chances that the data is not clean and needs some transformation. In case some data may not be extracted then we need the reconsider the layout of the data warehouse. Many times, these two steps are performed in a parallel fashion.

  1. Implementation of the data warehouse layout

After the objectives are set in place, the concerned stakeholders are looped into the plan, the information is collected and analyzed, a layout for creating a data warehouse is planned, the data sources are located and transformed, now it is time to put all the things to work. After the data from the warehouse can be accessed, the data needs to be pulled from the sources periodically. We need to monitor the data warehouse continuously and check for any irregularities.


Introduction to Data Mining

Data Mining is a process to extract insightful information from a large amount of raw data. The intent of this process is to find some trends and patterns which would help organizations in making data-driven decisions. This process is one of the steps of KDD or Knowledge Discovery in Database. KDD also includes different sub-processes like data cleaning, data transformation, data pre-processing, etc. There are a number of tools that we can use for performing Data Mining – Tableau and Power BI being two of them. We can also make use of certain packages in Python and R languages to extract information. Data Mining helps in analyzing a huge amount of data in a quick amount of time. It is an essential step in any data science project because it provides some exploratory insights which might tell us which features are very important in prediction or which features provide very little information. Data Mining helps the organization in various ways like analyzing their market expenditure, resource management, fraud detection, etc. There are a lot of Data mining techniques which include Association rules, Classification, Clustering, Regression, Outlier Detection, etc.  It is a very cost-effective solution for the organization and it can regularly provide new information and analysis depending upon the skillsets. The process of data mining also begins with the understanding of the business and the data. Developing a thorough knowledge about the business and its related data is extremely pivotal for the analysts to be able to perform some operations on it.

Examples of Data Mining

  1. Ever got any recommendations on an e-commerce store when you are buying a product? Like when you buy a smartphone, the website will show you some phone cases or accessories. This is what is known as Basket Analysis. In this analysis, the buying patterns of the customers and what they tend to buy along with the other products are analyzed. It not only helps in an e-commerce website but also is implemented at any supermarket or grocery store. It can be done using Association based learning and creating some rules.
  2. Fraud detection is one of the most vital use-cases of Data Mining. Banks have a lot at stake due to the fraudulent transactions because they have to bear the losses for these transactions. Data Mining can help in analyzing the data and catching these fraudulent activities. Although it is a tedious task, the organizations can try to extract some patterns that will help in getting a hold of these fraudsters.


The link between Data Warehousing and Data Mining

Although we will mention the differences that lie between these two terms, let us see how data warehousing data mining is linked to each other. In fact, data warehousing and data mining work in conjunction with each other. As mentioned earlier in the article, we all know that data mining includes the extraction of useful information from tons of data. In order to perform data mining, from where will the analyst obtain the data? Their search ends at the data warehouse itself as it is a single source of contact for all their data needs. The data mining process is provided with all the information that is required for the analysis from the data warehouse. In many instances, the analytical team is able to extract some useful information from the data merged from two completely different departments of the organizations or even from different offices of the same department.

Distinguishing between Data Warehousing and Data Mining

Parameter Data Warehousing Data Mining
Process It is a process of storing data from multiple sources. It is a process of using different methods to analyze the raw data.


Ideology The idea behind it was to centralize all the sources of data into one location for ease of use in analytical processes. The idea behind it was to use the data to find some trends and patterns and help the organization in making good decisions.
Requirements To implement a data warehouse, we need to locate the different means of sources and how the data can be extracted from those sources. In order to perform data mining, a data warehouse needs to be implemented to be able to look at all the sources and then analyze the raw data.
Maintenance The data pipelines need to be maintained and monitored to prevent any loss of data. The methods used for extracting information need to be maintained and monitored in order to check if they provide any useful information or not.
Periodicity The data is extracted and stored in the data warehouse periodically. The data needs to be analyzed periodically for continuously extracting useful information.
Tools Tools used for this process include Google BigQuery, Amazon Redshift, etc Tools used for this process include Tableau, Power BI, etc.
Benefits Easy access to the historic data of the organization Helps in detecting any fraudulent operations, financial and market analysis, etc.


End Notes

Any organization that plans to use the data at hand for analytical purposes needs to implement a data warehouse and different data mining techniques. It requires a good amount of skillset and resources for getting good use of it. Another element that is also vital in the entire data analysis process is the interpretation of the analysis. One should be able to correctly interpret what the data is trying to tell you because all the decisions are based on these interpretations. Bad decisions could really cost organizations a fortune of money. But the decisions that are spot-on can make the organizations earn a fortune of money as well. This explains the increasing demand for different positions such as Data Engineers, Data Scientists, and Data Analysts.

This article was centered on giving its readers an overview of data warehousing and data mining. It mentioned different steps that are generally involved during the implementation of a data warehouse. It illustrated a couple of examples of Data Mining and explained how data warehousing and data mining are linked to each other. And lastly, provided some distinguishing parameters between data warehousing and data mining.

Operational Data Store vs. Data Warehouse

One of the main problems with large amounts of data, especially in this age of data-driven tools and near-instant results, is how to store the data. With proper storage also comes the challenge of keeping the data updated, and this is the reason why organizations focus on solutions that will help make data processing faster and more efficient. For many, a digital transformation is in their roadmap, thanks in large part to the changes brought about by the global COVID-19 pandemic. The problem is that organizations often assume that it’s similar to traditional change initiatives, which can’t be any further from the truth. There are a number of challenges to prepare for in digital transformations, however, and without proper planning, non-unified data storage systems and systems of record implemented through the years can slow down or even hinder the process.

Businesses have relied on two main solutions for data storage for many years: traditional data warehouses and operational data stores (ODS). These key data structures provide assistance when it comes to boosting business intelligence so that the business can make sound corporate decisions based on data. Before considering which one will work for your business, it’s important to understand the main differences between the two.

What is a Data Warehouse?

Data warehousing is a common practice because a data warehouse is designed to support business intelligence tools and activities. It’s subject-oriented so data is centered on customers, products, sales, or other subjects that contribute to the business bottom line. Because data comes from a multitude of sources, a data warehouse is also designed to consolidate large amounts of data in a variety of formats, including flat files, legacy database management systems, and relational database management systems. It’s considered an organization’s single source of truth because it houses historical records built through time, which could become invaluable as a source of actionable insights.

One of the main disadvantages of a data warehouse is its non-volatile nature. Non-volatile data is read-only and, therefore, not frequently updated or deleted over time. This leads to some time variance, which means that a data warehouse only stores a time series of periodic data snapshots that show the state of data during specific periods. As such, data loading and data retrieval are the most vital operations for a data warehouse.

What is an Operational Data Store?

Forward-thinking companies turn to an operational data store to resolve the issues with data warehousing, primarily, the issue of always keeping data up-to-date. Similar to a data warehouse, an ODS can aggregate data from multiple sources and report across multiple systems of record to provide a more comprehensive view of the data. It’s essentially a staging area that can receive operational data from transactional sources and can be queried directly. This allows data analytics tools to query ODS data as it’s received from the respective source systems. This offloads the burden from the transactional systems by only providing access to current data that’s queried in an integrated manner. This makes an ODS the ideal solution for those looking for near-real time data that’s processed quickly and efficiently.

Traditional ODS solutions, however, typically suffer from high latency because they are based on either relational databases or disk-based NoSQL databases. These systems simply can’t handle large amounts of data and provide high performance at the same time, which is a common requirement of most modern applications. The limited scalability of traditional systems also leads to performance issues when multiple users access the data store all at the same time. As such, traditional ODS solutions are incapable of providing real-time API services for accessing systems of record.

A Paradigm Shift

As modern real-time digital applications replace previously offline services, companies are going through a paradigm shift and venturing beyond what traditional data storage systems can offer. This has led to the rise of a new breed of ODS solutions that Gartner refers to as digital integration hubs. It’s a cost-effective solution because it doesn’t require a rip-and-replace if you already have a traditional ODS in place. Adopting a digital integration hub can be as simple as augmenting your current system with the missing layers, including the microservices API, smart cache, and event-driven architecture.

While sticking with a data warehouse or traditional ODS may not necessarily hurt your business, the benefits of modernization via a digital integration hub are too great to ignore. Significant improvements in throughput, availability, and scalability will help organizations become more agile so they can drive innovation quicker, helping their industry and pushing the limits of technology further to open up possibilities never before discovered.

How the Pandemic is Changing the Data Analytics Outsourcing Industry

While media pundits have largely focused on the impact of COVID-19 as far as human health is concerned, it hasn’t been particularly good for the health of automated systems either. As cybersecurity budgets plummet in the face of dwindling finances, computer criminals have taken the opportunity to increase attacks against high value targets.

In June, an online antique store suffered a data breach that contained over 3 million records, and it’s likely that a number of similar attacks have simply gone unpublished. Fortunately, data scientists are hard at work developing new methods of fighting back against these kinds of breaches. Budget constraints and a lack of personnel as a result of the pandemic continues to be a problem, but automation has helped to assuage the issue to some degree.

AI-Driven Data Storage Systems

Big data experts have long promoted the cloud as an ideal metaphor for the way that data is stored remotely, but as a result few people today consider the physical locations that this information is stored at. All data has to be located on some sort of physical storage device. Even so-called serverless apps have to be distributed from a server unless they’re fully deployed using P2P services.

Since software can never truly replace hardware, researchers are looking at refining the various abstraction layers that exist between servers and the clients who access them. Data warehousing software has enabled computer scientists to construct centralized data storage solutions that look like traditional disk locations. This gives users the ability to securely interact with resources that are encrypted automatically.

Background services based on artificial intelligence monitor virtual data warehouse locations, which gives specialists the freedom to conduct whatever analytics they deem necessary. In some cases, a data warehouse can even anonymize information as it’s stored, which can streamline workflows involved with the analysis process.

While this level of automation has proven useful, it’s still subject to some of the problems that have occurred as a result of the pandemic. Traditional supply chains are in shambles and a large percentage of technical workers are now telecommuting. If there’s a problem with any existing big data plans, then there’s often nobody around to do any work in person.

Living with Shifting Digital Priorities

Many businesses were in the process of outsourcing their data operations even before the pandemic, and the current situation is speeding this up considerably. Initial industry estimates had projected steady growth numbers for the data analytics sector through 2025. While the current figures might not be quite as bullish, it’s likely that sales of outsourcing contracts will remain high.

That being said, firms are also shifting a large percentage of their IT spending dollars into cybersecurity projects. A recent survey found that 37 percent of business leaders said they were already going to cut their IT department budgets. The same study found that 28 percent of businesses are going to move at least some part of their data analytics programs abroad.

Those companies that can’t find an attractive outsourcing contract might start to patch their remote systems over a virtual private network. Unfortunately, this kind of technology has been strained to some degree in recent months. The virtual servers that power VPNs are flooded with requests, which in turn has brought them down in some instances. Neural networks, which utilize deep learning technology to improve themselves as time goes on, have proven more than capable of predicting when these problems are most likely to arise.

That being said, firms that deploy this kind of technology might find that it still costs more to work with automated technology on-premise compared to simply investing in an outsourcing program that works with these kinds of algorithms at an outside location.

Saving Money in the Time of Corona

Experts from Think Big Analytics pointed out how specialist organizations can deal with a much wider array of technologies than a small business ever could. Since these companies specialize in providing support for other organizations, they have a tendency to offer support for a large number of platforms.

These representatives recently opined that they could provide support for NoSQL, Presto, Apache Spark and several other emerging platforms at the same time. Perhaps most importantly, these organizations can work with Hadoop and other traditional data analysis languages.

Staffers working on data mining operations have long relied on languages like Hadoop and R to write scripts that they later use to automate the process of collecting and analyzing data. By working with an organization that already supports a language that companies rely on, they can avoid the need of changing up their existing operations.

This can help to drastically reduce the cost of migration, which is extremely important since many of the firms that need to migrate to a remote system are already suffering from budget problems. Assuming that some issues related to the pandemic continue to plague businesses for some time, it’s likely that these budget constraints will force IT departments to consider a migration even if they would have otherwise relied solely on a traditional colocation arrangement.

IT department staffers were already moving away from many rare platforms even before the COVID-19 pandemic hit, however, so this shouldn’t be as much of a herculean task as it sounds. For instance, the KNIME Analytics Platform has increased in popularity exponentially since it’s release in 2006. The fact that it supports over 1,000 plug-in modules has made it easy for smaller businesses to move toward the platform.

The road ahead isn’t going to be all that pleasant, however. COBOL and other antiquated languages still rule the roost at many governmental big data processing centers. At the same time, some small businesses have never even been able to put a big data plan into play in the first place. As the pandemic continues to wreak havoc on the world’s economy, however, it’s likely that there will be no shortage of organizations continuing to migrate to more secure third-party platforms backed by outsourcing contracts.

Simplify Vendor Onboarding with Automated Data Integration

Vendor onboarding is a key business process that involves collecting and processing large data volumes from one or multiple vendors. Business users need vendor information in a standardized format to use it for subsequent data processes. However, consolidating and standardizing data for each new vendor requires IT teams to write code for custom integration flows, which can be a time-consuming and challenging task.

In this blog post, we will talk about automated vendor onboarding and how it is far more efficient and quicker than manually updating integration flows.

Problems with Manual Integration for Vendor Onboarding

During the onboarding process, vendor data needs to be extracted, validated, standardized, transformed, and loaded into the target system for further processing. An integration task like this involves coding, updating, and debugging manual ETL pipelines that can take days and even weeks on end.

Every time a vendor comes on board, this process is repeated and executed to load the information for that vendor into the unified business system. Not just this, but because vendor data is often received from disparate sources in a variety of formats (CSV, Text, Excel), these ETL pipelines frequently break and require manual fixes.

All this effort is not suitable, particularly for large-scale businesses that onboard hundreds of vendors each month. Luckily, there is a faster alternative available that involves no code-writing.

Automated Data Integration

The manual onboarding process can be automated using purpose-built data integration tools.

To help you better understand the advantages, here is a step-by-step guide on how automated data integration for vendor onboarding works:

  1. Vendor data is retrieved from heterogeneous sources such as databases, FTP servers, and web APIs through built-in connectors available in the solution.
  2. The data from each file is validated by passing it through a set of predefined quality rules – this step helps in eliminating records with missing, duplicate, or incorrect data.
  3. Transformations are applied to convert input data into the desired output format or screen vendors based on business criteria. For example, if the vendor data is stored in Excel sheets and the business uses SQL Server for data storage, then the data has to be mapped to the relevant fields in the SQL Server database, which is the destination.
  4. The standardized, validated data is then loaded into a unified enterprise database that you can use as the source of information for business processes. In some cases, this can be a staging database where you can perform further filtering and aggregation to build a consolidated vendor database.
  5. This entire ETL pipeline (Step 1 through Step 4) can then be automated through event-based or time-based triggers in a workflow. For instance, you may want to run the pipeline once every day, or once a new file/data point is available in your FTP server.

Why Build a Consolidated Database for Vendors?

Once the ETL pipeline runs, you will end up with a consolidated database with complete vendor information. The main benefit of having a unified database is that it would have filtered information regarding vendors.

Most businesses have a strict process for screening vendors that follows a set of predefined rules. For example, you may want to reject vendors that have a poor credit history automatically. With manual data integration, you would need to perform this filtering by writing code. Automated data integration allows you to apply pre-built filters directly within your ETL pipeline to flag or remove vendors with a credit score lower than the specified threshold.

This is just one example; you can perform a wide range of tasks at this level in your ETL pipeline including vendor scoring (calculated based on multiple fields in your data), filtering (based on rules applied to your data), and data aggregation (to add measures to your data) to build a robust vendor database for decision-making and subsequent processes.

Conclusion

Automated vendor onboarding offers cost-and-time benefits to your organization. Making use of enterprise-grade data integration tools ensures a seamless business-to-vendor data exchange without the need for reworking and upgrading your ETL pipelines.

Interview: Does Business Intelligence benefit from Cloud Data Warehousing?

Interview with Ross Perez, Senior Director, Marketing EMEA at Snowflake

Read this article in German:
“Profitiert Business Intelligence vom Data Warehouse in der Cloud?”

Does Business Intelligence benefit from Cloud Data Warehousing?

Ross Perez is the Senior Director, Marketing EMEA at Snowflake. He leads the Snowflake marketing team in EMEA and is charged with starting the discussion about analytics, data, and cloud data warehousing across EMEA. Before Snowflake, Ross was a product marketer at Tableau Software where he founded the Iron Viz Championship, the world’s largest and longest running data visualization competition.
Data Science Blog: Ross, Business Intelligence (BI) is not really a new trend. In 2019/2020, making data available for the whole company should not be a big thing anymore. Would you agree?

BI is definitely an old trend, reporting has been around for 50 years. People are accustomed to seeing statistics and data for the company at large, and even their business units. However, using BI to deliver analytics to everyone in the organization and encouraging them to make decisions based on data for their specific area is relatively new. In a lot of the companies Snowflake works with, there is a huge new group of people who have recently received access to self-service BI and visualization tools like Tableau, Looker and Sigma, and they are just starting to find answers to their questions.

Data Science Blog: Up until today, BI was just about delivering dashboards for reporting to the business. The data warehouse (DWH) was something like the backend. Today we have increased demand for data transparency. How should companies deal with this demand?

Because more people in more departments are wanting access to data more frequently, the demand on backend systems like the data warehouse is skyrocketing. In many cases, companies have data warehouses that weren’t built to cope with this concurrent demand and that means that the experience is slow. End users have to wait a long time for their reports. That is where Snowflake comes in: since we can use the power of the cloud to spin up resources on demand, we can serve any number of concurrent users. Snowflake can also house unlimited amounts of data, of both structured and semi-structured formats.

Data Science Blog: Would you say the DWH is the key driver for becoming a data-driven organization? What else should be considered here?

Absolutely. Without having all of your data in a single, highly elastic, and flexible data warehouse, it can be a huge challenge to actually deliver insight to people in the organization.

Data Science Blog: So much for the theory, now let’s talk about specific use cases. In general, it matters a lot whether you are storing and analyzing e.g. financial data or machine data. What do we have to consider for both purposes?

Financial data and machine data do look very different, and often come in different formats. For instance, financial data is often in a standard relational format. Data like this needs to be able to be easily queried with standard SQL, something that many Hadoop and noSQL tools were unable to provide. Luckily, Snowflake is an ansi-standard SQL data warehouse so it can be used with this type of data quite seamlessly.

On the other hand, machine data is often semi-structured or even completely unstructured. This type of data is becoming significantly more common with the rise of IoT, but traditional data warehouses were very bad at dealing with it since they were optimized for relational data. Semi-structured data like JSON, Avro, XML, Orc and Parquet can be loaded into Snowflake for analysis quite seamlessly in its native format. This is important, because you don’t want to have to flatten the data to get any use from it.

Both types of data are important, and Snowflake is really the first data warehouse that can work with them both seamlessly.

Data Science Blog: Back to the common business use case: Creating sales or purchase reports for the business managers, based on data from ERP-systems such as Microsoft or SAP. Which architecture for the DWH could be the right one? How many and which database layers do you see as necessary?

The type of report largely does not matter, because in all cases you want a data warehouse that can support all of your data and serve all of your users. Ideally, you also want to be able to turn it off and on depending on demand. That means that you need a cloud-based architecture… and specifically Snowflake’s innovative architecture that separates storage and compute, making it possible to pay for exactly what you use.

Data Science Blog: Where would you implement the main part of the business logic for the report? In the DWH or in the reporting tool? Does it matter which reporting tool we choose?

The great thing is that you can choose either. Snowflake, as an ansi-Standard SQL data warehouse, can support a high degree of data modeling and business logic. But you can also utilize partners like Looker and Sigma who specialize in data modeling for BI. We think it’s best that the customer chooses what is right for them.

Data Science Blog: Snowflake enables organizations to store and manage their data in the cloud. Does it mean companies lose control over their storage and data management?

Customers have complete control over their data, and in fact Snowflake cannot see, alter or change any aspect of their data. The benefit of a cloud solution is that customers don’t have to manage the infrastructure or the tuning – they decide how they want to store and analyze their data and Snowflake takes care of the rest.

Data Science Blog: How big is the effort for smaller and medium sized companies to set up a DWH in the cloud? Does this have to be an expensive long-term project in every case?

The nice thing about Snowflake is that you can get started with a free trial in a few minutes. Now, moving from a traditional data warehouse to Snowflake can take some time, depending on the legacy technology that you are using. But Snowflake itself is quite easy to set up and very much compatible with historical tools making it relatively easy to move over.

How To Remotely Send R and Python Execution to SQL Server from Jupyter Notebooks

Introduction

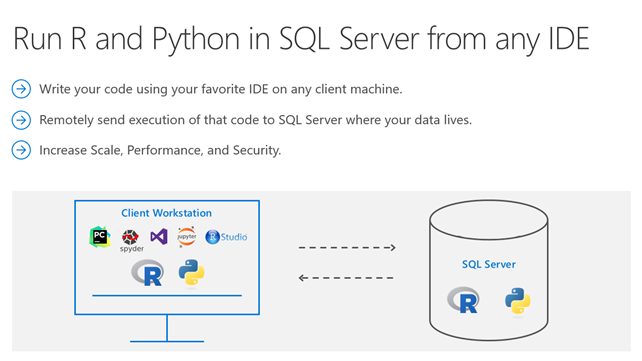
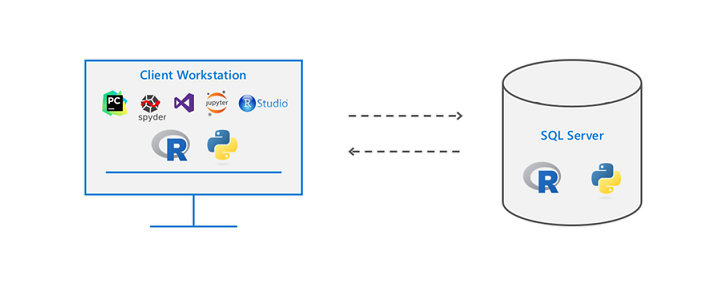
Did you know that you can execute R and Python code remotely in SQL Server from Jupyter Notebooks or any IDE? Machine Learning Services in SQL Server eliminates the need to move data around. Instead of transferring large and sensitive data over the network or losing accuracy on ML training with sample csv files, you can have your R/Python code execute within your database. You can work in Jupyter Notebooks, RStudio, PyCharm, VSCode, Visual Studio, wherever you want, and then send function execution to SQL Server bringing intelligence to where your data lives.

This tutorial will show you an example of how you can send your python code from Juptyter notebooks to execute within SQL Server. The same principles apply to R and any other IDE as well. If you prefer to learn through videos, this tutorial is also published on YouTube here:


Environment Setup Prerequisites

  1. Install ML Services on SQL Server

In order for R or Python to execute within SQL, you first need the Machine Learning Services feature installed and configured. See this how-to guide.

  1. Install RevoscalePy via Microsoft’s Python Client

In order to send Python execution to SQL from Jupyter Notebooks, you need to use Microsoft’s RevoscalePy package. To get RevoscalePy, download and install Microsoft’s ML Services Python Client. Documentation Page or Direct Download Link (for Windows).

After downloading, open powershell as an administrator and navigate to the download folder. Start the installation with this command (feel free to customize the install folder): .\Install-PyForMLS.ps1 -InstallFolder “C:\Program Files\MicrosoftPythonClient”

Be patient while the installation can take a little while. Once installed navigate to the new path you installed in. Let’s make an empty folder and open Jupyter Notebooks: mkdir JupyterNotebooks; cd JupyterNotebooks; ..\Scripts\jupyter-notebook

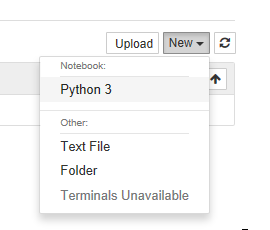
Create a new notebook with the Python 3 interpreter:


To test if everything is setup, import revoscalepy in the first cell and execute. If there are no error messages you are ready to move forward.

Database Setup (Required for this tutorial only)

For the rest of the tutorial you can clone this Jupyter Notebook from Github if you don’t want to copy paste all of the code. This database setup is a one time step to ensure you have the same data as this tutorial. You don’t need to perform any of these setup steps to use your own data.

  1. Create a database

Modify the connection string for your server and use pyodbc to create a new database.

import pyodbc  
# creating a new db to load Iris sample in 
new_db_name = "MLRemoteExec" connection_string = "Driver=SQL Server;Server=localhost\MSSQLSERVER2017;Database={0};Trusted_Connection=Yes;" 

cnxn = pyodbc.connect(connection_string.format("master"), autocommit=True) 

cnxn.cursor().execute("IF EXISTS(SELECT * FROM sys.databases WHERE [name] = '{0}') DROP DATABASE {0}".format(new_db_name)) 

cnxn.cursor().execute("CREATE DATABASE " + new_db_name)

cnxn.close()

print("Database created") 
  1. Import Iris sample from SkLearn

Iris is a popular dataset for beginner data science tutorials. It is included by default in sklearn package.

from sklearn import datasetsimport pandas as pd
# SkLearn has the Iris sample dataset built in to the packageiris = datasets.load_iris()
df = pd.DataFrame(iris.data, columns=iris.feature_names)
  1. Use RecoscalePy APIs to create a table and load the Iris data

(You can also do this with pyodbc, sqlalchemy or other packages)

from revoscalepy import RxSqlServerData, rx_data_step
# Example of using RX APIs to load data into SQL table. You can also do this with pyodbc
table_ref = RxSqlServerData(connection_string=connection_string.format(new_db_name), table="Iris")rx_data_step(input_data = df, output_file = table_ref, overwrite = True)print("New Table Created: Iris")
print("Sklearn Iris sample loaded into Iris table")

Define a Function to Send to SQL Server

Write any python code you want to execute in SQL. In this example we are creating a scatter matrix on the iris dataset and only returning the bytestream of the .png back to Jupyter Notebooks to render on our client.

def send_this_func_to_sql():
    from revoscalepy import RxSqlServerData, rx_import
    from pandas.tools.plotting import scatter_matrix
    import matplotlib.pyplot as plt
    import io    
# remember the scope of the variables in this func are within our SQL Server Python Runtime
    connection_string = "Driver=SQL Server;Server=localhost\MSSQLSERVER2017; Database=MLRemoteExec;Trusted_Connection=Yes;"

# specify a query and load into pandas dataframe df
    sql_query = RxSqlServerData(connection_string=connection_string, sql_query = "select * from Iris")

    df = rx_import(sql_query)
    scatter_matrix(df)

# return bytestream of image created by scatter_matrix
    buf = io.BytesIO()
    plt.savefig(buf, format="png")
    buf.seek(0)
    return buf.getvalue()

Send execution to SQL

Now that we are finally set up, check out how easy sending remote execution really is! First, import revoscalepy. Create a sql_compute_context, and then send the execution of any function seamlessly to SQL Server with RxExec. No raw data had to be transferred from SQL to the Jupyter Notebook. All computation happened within the database and only the image file was returned to be displayed.

from IPython import display
import matplotlib.pyplot as plt 
from revoscalepy import RxInSqlServer, rx_exec# create a remote compute context with connection to SQL Server

sql_compute_context = RxInSqlServer(connection_string=connection_string.format(new_db_name))

# use rx_exec to send the function execution to SQL Server

image = rx_exec(send_this_func_to_sql, compute_context=sql_compute_context)[0]

# only an image was returned to my jupyter client. All data remained secure and was manipulated in my db.

display.Image(data=image)

While this example is trivial with the Iris dataset, imagine the additional scale, performance, and security capabilities that you now unlocked. You can use any of the latest open source R/Python packages to build Deep Learning and AI applications on large amounts of data in SQL Server. We also offer leading edge, high-performance algorithms in Microsoft’s RevoScaleR and RevoScalePy APIs. Using these with the latest innovations in the open source world allows you to bring unparalleled selection, performance, and scale to your applications.

Learn More

Check out SQL Machine Learning Services Documentation to learn how you can easily deploy your R/Python code with SQL stored procedures making them accessible in your ETL processes or to any application. Train and store machine learning models in your database bringing intelligence to where your data lives.

Other YouTube Tutorials:

Consider Anonymization – Process Mining Rule 3 of 4

This is article no. 3 of the four-part article series Privacy, Security and Ethics in Process Mining.

Read this article in German:
Datenschutz, Sicherheit und Ethik beim Process Mining – Regel 3 von 4

If you have sensitive information in your data set, instead of removing it you can also consider the use of anonymization. When you anonymize a set of values, then the actual values (for example, the employee names “Mary Jones”, “Fred Smith”, etc.) will be replaced by another value (for example, “Resource 1”, “Resource 2”, etc.).

If the same original value appears multiple times in the data set, then it will be replaced with the same replacement value (“Mary Jones” will always be replaced by “Resource 1”). This way, anonymization allows you to obfuscate the original data but it preserves the patterns in the data set for your analysis. For example, you will still be able to analyze the workload distribution across all employees without seeing the actual names.

Some process mining tools (Disco and ProM) include anonymization functionality. This means that you can import your data into the process mining tool and select which data fields should be anonymized. For example, you can choose to anonymize just the Case IDs, the resource name, attribute values, or the timestamps. Then you export the anonymized data set and you can distribute it among your team for further analysis.

Do:

  • Determine which data fields are sensitive and need to be anonymized (see also the list of common process mining attributes and how they are impacted if anonymized).
  • Keep in mind that despite the anonymization certain information may still be identifiable. For example, there may be just one patient having a very rare disease, or the birthday information of your customer combined with their place of birth may narrow down the set of possible people so much that the data is not anonymous anymore.

Don’t:

  • Anonymize the data before you have cleaned your data, because after the anonymization the data cleaning may not be possible anymore. For example, imagine that slightly different customer category names are used in different regions but they actually mean the same. You would like to merge these different names in a data cleaning step. However, after you have anonymized the names as “Category 1”, “Category 2”, etc. the data cleaning cannot be done anymore.
  • Anonymize fields that do not need to be anonymized. While anonymization can help to preserve patterns in your data, you can easily lose relevant information. For example, if you anonymize the Case ID in your incident management process, then you cannot look up the ticket number of the incident in the service desk system anymore. By establishing a collaborative culture around your process mining initiative (see guideline No. 4) and by working in a responsible, goal-oriented way, you can often work openly with the original data that you have within your team.

Responsible Handling of Data – Process Mining Rule 2 of 4

This is article no. 2 of the four-part article series Privacy, Security and Ethics in Process Mining.

Read this article in German:
Datenschutz, Sicherheit und Ethik beim Process Mining – Regel 2 von 4

Like in any other data analysis technique, you must be careful with the data once you have obtained it. In many projects, nobody thinks about the data handling until it is brought up by the security department. Be that person who thinks about the appropriate level of protection and has a clear plan already prior to the collection of the data.

Do:

  • Have external parties sign a Non Disclosure Agreement (NDA) to ensure the confidentiality of the data. This holds, for example, for consultants you have hired to perform the process mining analysis for you, or for researchers who are participating in your project. Contact your legal department for this. They will have standard NDAs that you can use.
  • Make sure that the hard drive of your laptop, external hard drives, and USB sticks that you use to transfer the data and your analysis results are encrypted.

Don’t:

  • Give the data set to your co-workers before you have checked what is actually in the data. For example, it could be that the data set contains more information than you requested, or that it contains sensitive data that you did not think about. For example, the names of doctors and nurses might be mentioned in a free-text medical notes attribute. Make sure you remove or anonymize (see guideline No. 3) all sensitive data before you pass it on.
  • Upload your data to a cloud-based process mining tool without checking that your organization allows you to upload this kind of data. Instead, use a desktop-based process mining tool (like Disco [3] or ProM [4]) to analyze your data locally or get the cloud-based process mining vendor to set-up an on-premise version of their software within your organization. This is also true for cloud-based storage services like Dropbox: Don’t just store data or analysis results in the cloud even if it is convenient.

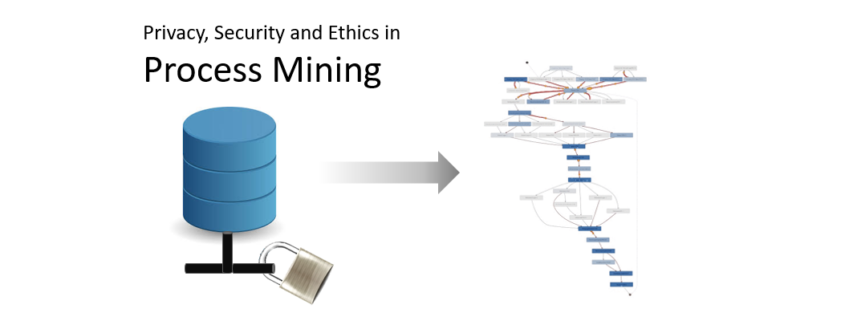
Privacy, Security and Ethics in Process Mining – Article Series

When I moved to the Netherlands 12 years ago and started grocery shopping at one of the local supermarket chains, Albert Heijn, I initially resisted getting their Bonus card (a loyalty card for discounts), because I did not want the company to track my purchases. I felt that using this information would help them to manipulate me by arranging or advertising products in a way that would make me buy more than I wanted to. It simply felt wrong.

Read this article in German:
Datenschutz, Sicherheit und Ethik beim Process Mining – Artikelserie

The truth is that no data analysis technique is intrinsically good or bad. It is always in the hands of the people using the technology to make it productive and constructive. For example, while supermarkets could use the information tracked through the loyalty cards of their customers to make sure that we have to take the longest route through the store to get our typical items (passing by as many other products as possible), they can also use this information to make the shopping experience more pleasant, and to offer more products that we like.

Most companies have started to use data analysis techniques to analyze their data in one way or the other. These data analyses can bring enormous opportunities for the companies and for their customers, but with the increased use of data science the question of ethics and responsible use also grows more dominant. Initiatives like the Responsible Data Science seminar series [1] take on this topic by raising awareness and encouraging researchers to develop algorithms that have concepts like fairness, accuracy, confidentiality, and transparency built in (see Wil van der Aalst’s presentation on Responsible Data Science at Process Mining Camp 2016).

Process Mining can provide you with amazing insights about your processes, and fuel your improvement initiatives with inspiration and enthusiasm, if you approach it in the right way. But how can you ensure that you use process mining responsibly? What should you pay attention to when you introduce process mining in your own organization?

In this article series, we provide you four guidelines that you can follow to prepare your process mining analysis in a responsible way:

Part 1 of 4: Clarify the Goal of the Analysis

Part 2 of 4: Responsible Handling of Data

Part 3 of 4: Consider Anonymization

Part 4 of 4: Establish a collaborative Culture

Acknowledgements

We would like to thank Frank van Geffen and Léonard Studer, who initiated the first discussions in the workgroup around responsible process mining in 2015. Furthermore, we would like to thank Moe Wynn, Felix Mannhardt and Wil van der Aalst for their feedback on earlier versions of this article.