Web Scraping Using R..!
In this blog, I’ll show you, How to Web Scrape using R..?
What is R..?
R is a programming language and its environment built for statistical analysis, graphical representation & reporting. R programming is mostly preferred by statisticians, data miners, and software programmers who want to develop statistical software.
R is also available as Free Software under the terms of the Free Software Foundation’s GNU General Public License in source code form.
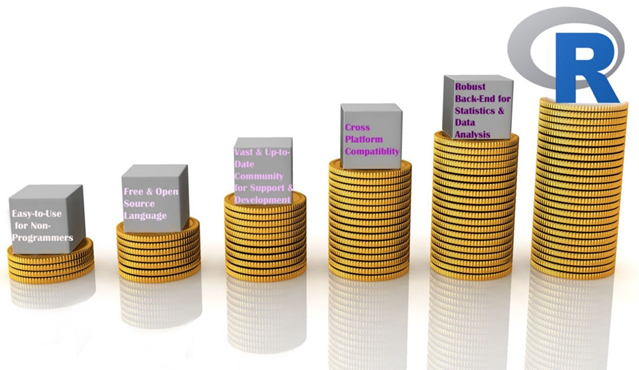
Reasons to choose R
Let’s begin our topic of Web Scraping using R.
Step 1- Select the website & the data you want to scrape.
I picked this website “https://www.alexa.com/topsites/countries/IN” and want to scrape data of Top 50 sites in India.
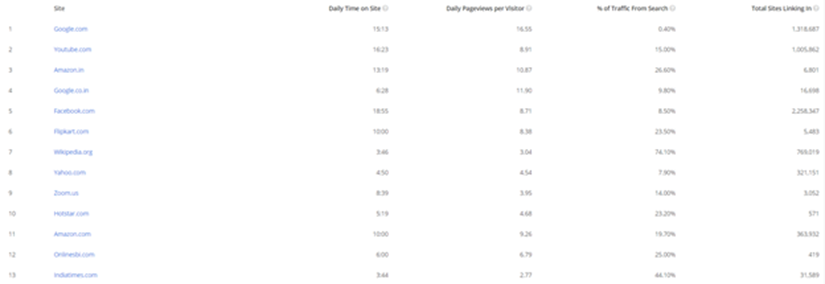
Data we want to scrape
Step 2- Get to know the HTML tags using SelectorGadget.
In my previous blog, I already discussed how to inspect & find the proper HTML tags. So, now I’ll explain an easier way to get the HTML tags.
You have to go to Google chrome extension (chrome://extensions) & search SelectorGadget. Add it to your browser, it’s a quite good CSS selector.

Step 3- R Code
Evoking Important Libraries or Packages
I’m using RVEST package to scrape the data from the webpage; it is inspired by libraries like Beautiful Soup. If you didn’t install the package yet, then follow the code in the snippet below.
![]()
Step 4- Set the url of the website
![]()
Step 5- Find the HTML tags using SelectorGadget
It’s quite easy to find the proper HTML tags in which your data is present.
Firstly, I have to click on data using SelectorGadget which I want to scrape, it automatically selects the data which are similar to selected HTML tags. Before going forward, cross-check the selected values, are they correct or some junk data is also gets selected..? If you noticed our page has only 50 values, but you can see 156 values are selected.
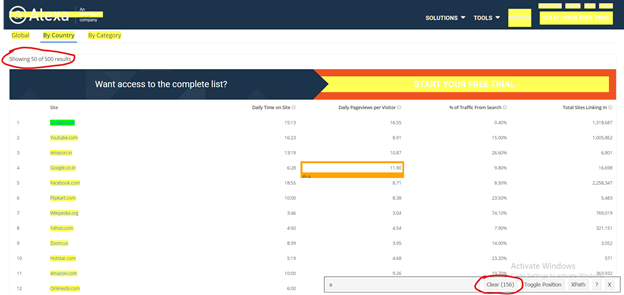
Selection by SelectorGadget
So I need to remove unwanted values who get selected, once you click on them to deselect it, it turns red and others will turn yellow except our primary selection which turn to green. Now you can see only 50 values are selected as per our primary requirement but it’s not enough. I have to again cross-check that some required values are not exchanged with junk values.
If we satisfy with our selection then copy the HTML tag & include it into the code, else repeat this exercise.
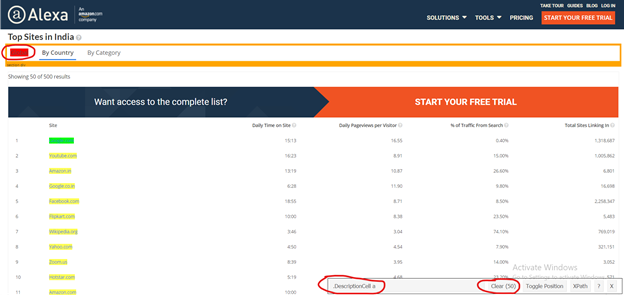
Modified Selection by SelectorGadget
Step 6- Include the tag in our Code
After including the tags, our code is like this.
Code Snippet
If I run the code, values in each list object will be 50.
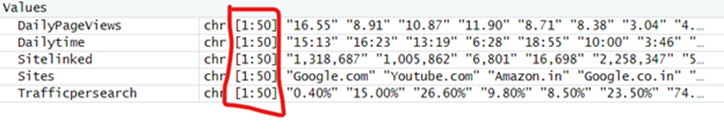
Data Stored in List Objects
Step 7- Creating DataFrame
Now, we create a dataframe with our list-objects. So for creating a dataframe, we always need to remember one thumb rule that is the number of rows (length of all the lists) should be equal, else we get an error.
Error appears when number of rows differs
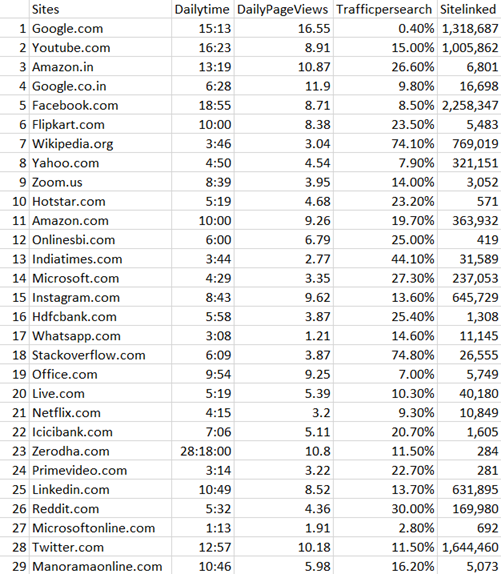
Finally, Our DataFrame will look like this:

Our Final Data
Step 8- Writing our DataFrame to CSV file
We need our scraped data to be available locally for further analysis & model building or other purposes.
Our final piece of code to write it in CSV file is:
Writing to CSV file
Step 9- Check the CSV file
Data written in CSV file
Conclusion-
I tried to explain Web Scraping using R in a simple way, Hope this will help you in understanding it better.
Find full code on
https://github.com/vgyaan/Alexa/blob/master/webscrap.R
If you have any questions about the code or web scraping in general, reach out to me on LinkedIn!
Okay, we will meet again with the new exposer.
Till then,
Happy Coding..!


 David M. Raab is as a consultant specialized in marketing software and service vendor selection, marketing analytics and marketing technology assessment. Furthermore he is the founder of the Customer Data Platform Institute which is a vendor-neutral educational project to help marketers build a unified customer view that is available to all of their company systems.
 Ross Perez is the Senior Director, Marketing EMEA at