CRISP-DM methodology in technical view

On this paper discuss about CRISP-DM (Cross Industry Standard Process for data mining) methodology and its steps including selecting technique to successful the data mining process. Before going to CRISP-DM it is better to understand what data mining is? So, here first I introduce the data mining and then discuss about CRISP-DM and its steps for any beginner (data scientist) need to know.

1 Data Mining

Data mining is an exploratory analysis where has no idea about interesting outcome (Kantardzic, 2003). So data mining is a process to explore by analysis a large set of data to discover meaningful information which help the business to take a proper decision. For better business decision data mining is a way to select feature, correlation, and interesting patterns from large dataset (Fu, 1997; SPSS White Paper, 1999).

Data mining is a step by step process to discover knowledge from data. Pre-processing data is vital part for a data mining. In pre-process remove noisy data, combining multiple sources of data, retrieve relevant feature and transforming data for analysis. After pre-process mining algorithm applied to extract data pattern so data mining is a step by step process and applied algorithm to find meaning full data pattern. Actually data mining is not only conventional analysis it is more than that (Read, 1999).

Data mining and statistics closely related. Main goal of data mining and statistic is find the structure of data because data mining is a part of statistics (Hand, 1999). However, data mining use tools, techniques, database, machine learning which not part of statistics but data mining use statistics algorithm to find a pattern or discover hidden decision.

Data mining objective could be prediction or description. On prediction data mining considering several features of dataset to predict unidentified future, on the other hand description involve identifying pattern of data to interpreted (Kantardzic, 2003).

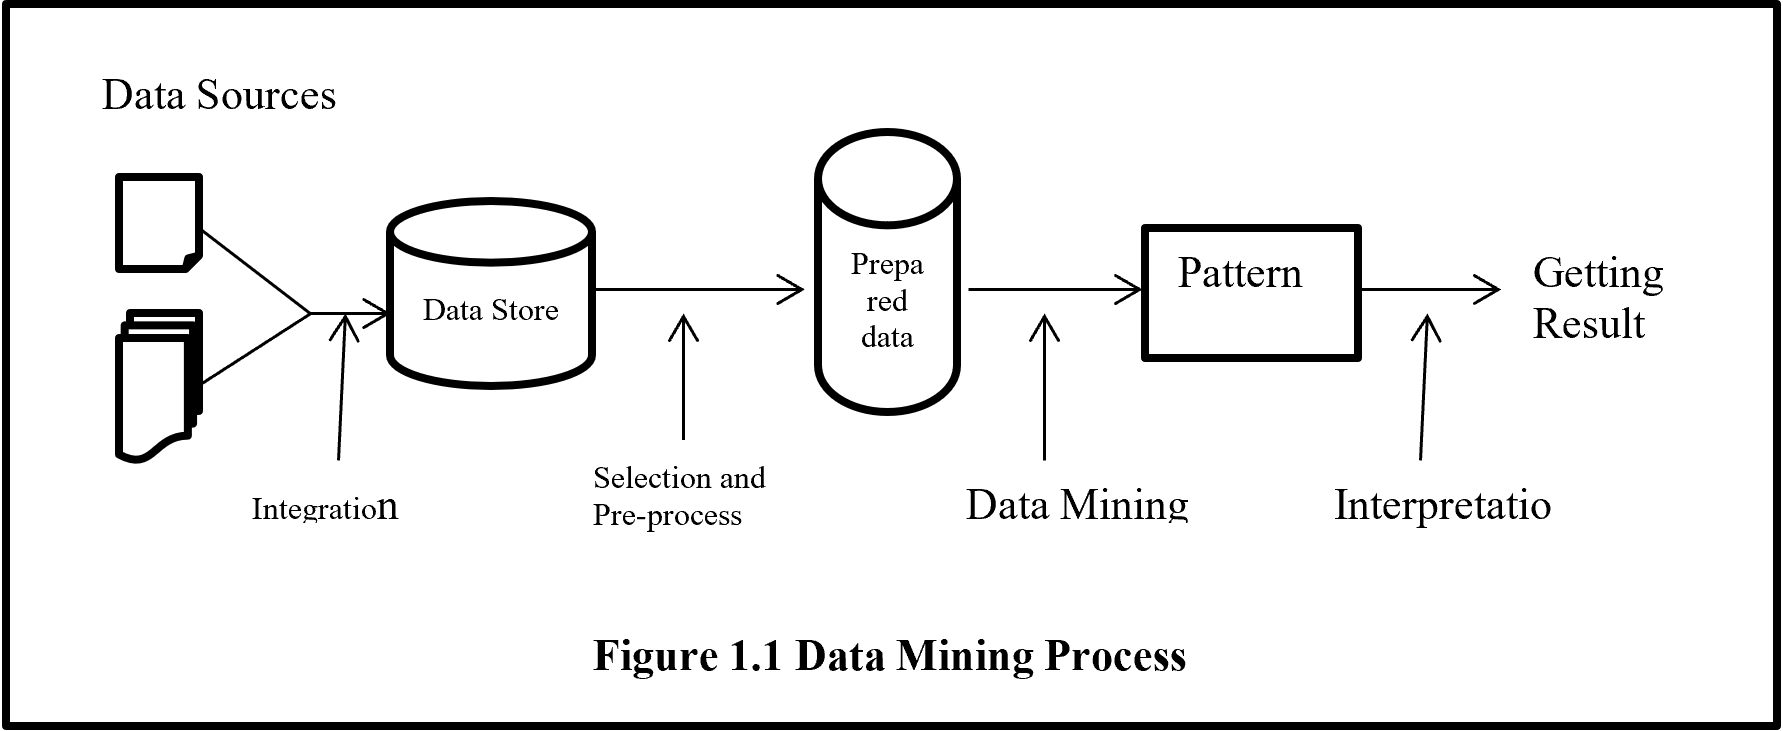
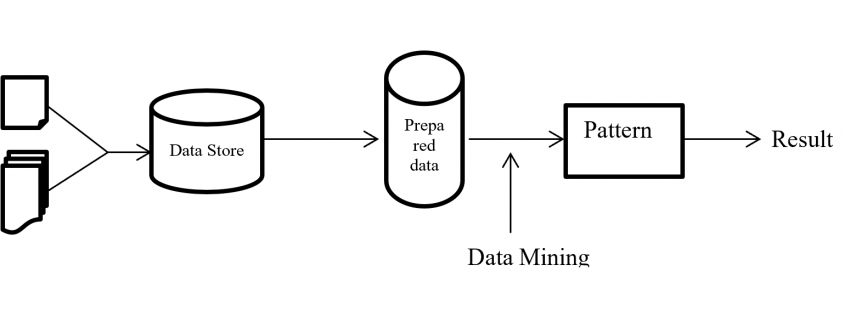
From figure 1.1 shows data mining is the only one part of getting unknown information from data but it is the central process of whole process. Before data mining there are several processes need to be done like collecting data from several sources than integrated data and keep in data storage. Stored unprocessed data evaluated and selected with pre-processed activity to give a standard format than data mining algorithm to analysis for hidden pattern.

Data Mining Process

2 CRISP-DM Methodologies

Cross Industry Standard Process for data mining (CRISP-DM) is most popular and widely uses data mining methodology. CRISP-DM breaks down the data mining project life cycle into six phases and each phase consists of many second-level generic tasks. Generic task cover all possible data mining application. CRISP-DM extends KDD (Knowledge Discovery and Data Mining) into six steps which are sequence of data mining application (Martínez-Plumed 2019).

Data science and data mining project extract meaningful information from data. Data science is an art where a lot of time need to spend for understanding the business value and data before applying any algorithm then evaluate and deployed a project. CRISP-DM help any data science and data mining project from start to end by giving step by step process.

Present world every day billions of data are generating. So organisations are struggling with overwhelmed data to process and find a business goal. Comprehensive data mining methodology, CRISP-DM help business to achieve desirable goal by analysing data.

CRISP-DM (Cross Industry Standard Process for Data Mining) is well documented, freely available, data mining methodology. CRISP-DM is developed by more than 200 data mining users and many mining tool and service providers funded by European Union. CRISP-DM encourages organization for best practice and provides a structure of data mining to get better, faster result.

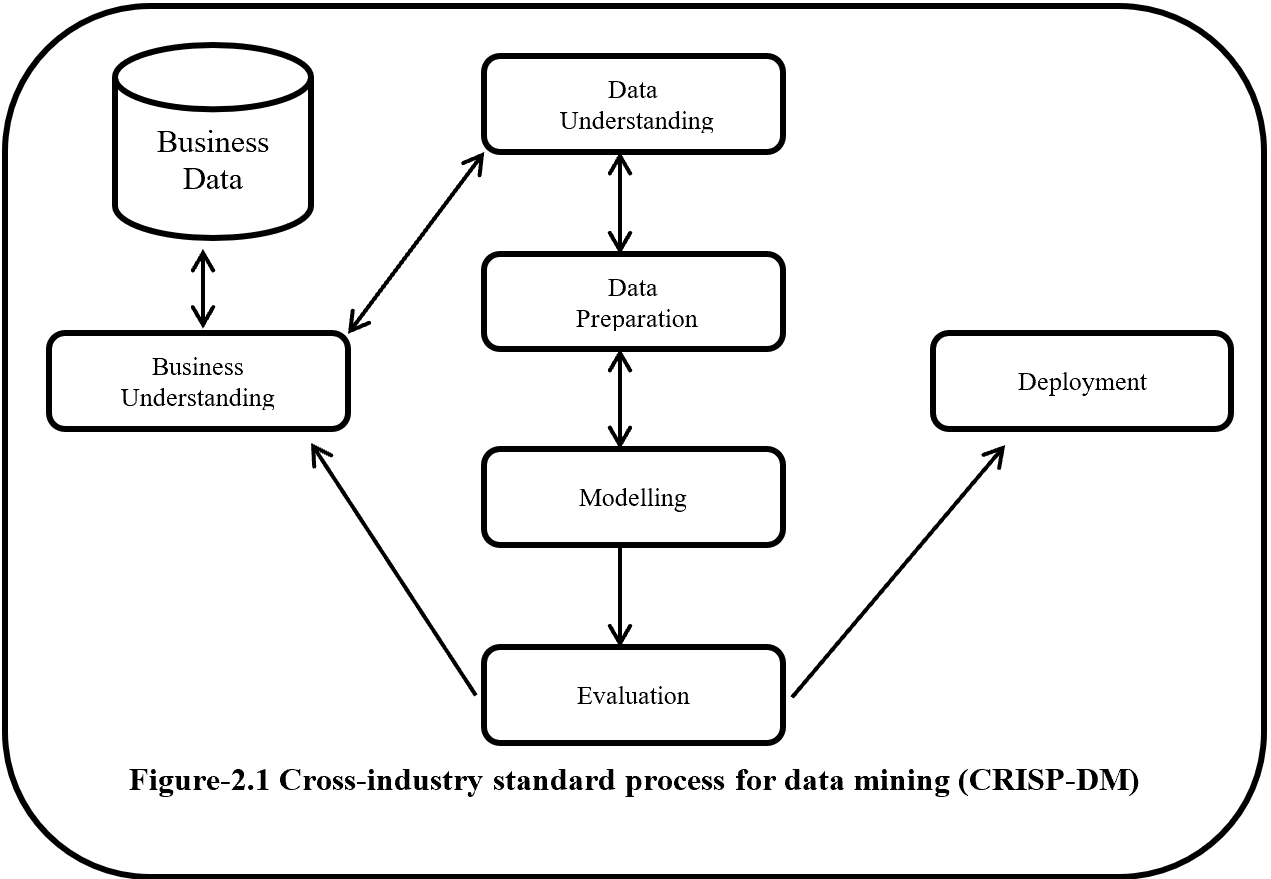
CRISP-DM is a step by step methodology. Figure-2.1 show the phases of CRISP-DM and process of data mining. Here one side arrow indicates the dependency between phases and double side arrow represents repeatable process. Six phases of CRISP-DM are Business understanding, Data understanding, Modelling, Evaluation and Deployment.

CRISP-DM

2.1 Business Understanding

Business Understanding or domain understanding is the first step of CRISP-DM methodology. On this stage identify the area of business which is going to transform into meaningful information by analysing, processing and implementing several algorithms. Business understanding identifies the available resource (human and hardware), problems and set a goal. Identification of business objective should be agreed with project sponsors and other unit of business which will be affected. This step also focuses about details business success criteria, requirements, constraints, risk, project plan and timeline.

2.2 Data Understanding

Data understanding is the second and closely related with the business understanding phase. This phase mainly focus on data collection and proceeds to get familiar with the data and also detect interesting subset from data. Data understanding has four subsets these are:-

2.2.1 Initial data collection

On this subset considering the data collection sources which is mainly divided into two categories like outsource data or internal source data.  If data is from outsource then it may costly, time consuming and may be low quality but if data is collected form internal source it is an easy and less costly, but it may be contain irrelevant data. If internal source data does not fulfil the interest of analysis than it is necessary to move outsource data. Data collection also give an assumption that the data is quantitative (continuous, count) or qualitative (categorical).  It also gives information about balance or imbalanced dataset.  On data collection should avoid random error, systematic error, exclusion errors, and errors of choosing.

2.2.2 Data Description

Data description performs initial analysis about data. On this stage it is going to determine about the source of data like RDBMS, SQL, NoSQL, Big data etc. then analysis and describe the data about size (large data set give more accurate result but time consuming), number of records, tables, database, variables, and data types (numeric, categorical or Boolean). On this phase examine the accessibility and availability of attributes.

2.2.3 Exploratory data analysis (EDA)

On exploratory data analysis describe the inferential statistics, descriptive statistics and graphical representation of data. Inferential statistics summarize the entire population from the sample data to perform sampling and hypothesis testing. On Parametric hypothesis testing  (Null or alternate – ANOVA, t-test, chi square test) perform for known distribution (based on population) like mean, variance, standard deviation, proportion and Non-parametric hypothesis testing perform when distribution is unknown or sample size is small. On sample dataset, random sampling implement when dataset is balance but for imbalance dataset should be follow random resampling (under  and over sampling), k fold cross validation, SMOTE (synthetic minority oversampling technique), cluster base sampling, ensemble techniques (bagging and boosting – Add boost, Gradient Tree Boosting, XG Boost) to form a balance dataset.

On descriptive statistics analysis describe about the mean, median, mode for measures of central tendency on first moment business decision. On second moment business decision describe the measure of dispersion about the variance, standard deviation and range of data.  On third and fourth moment business decision describe accordingly skewness (Positive skewness – heavier tail to the right, negative skewness – heavier tail to the left, Zero skewness – symmetric distribution) and Kurtosis (Leptokurtosis – heavy tail, platykurtosis – light tail, mesokurtic – normal distribution).

Graphical representation is divided into univariate, bivariate and multivariate analysis. Under univariate whisker plot, histogram identify the outliers and shape of distribution of data and Q-Q plot (Quantile – Quantile) plot describe the normality of data that means data is normally distribution or not.  On whisker plot if data present above of Q3 + 1.5 (IQR) and below of Q1 – 1.5 (IQR) is outlier. For Bivariate correlations identify with scatter plot which describe positive, negative or no correlation and also identify the data linearity or non-linearity. Scatter plot also describe the clusters and outliers of data.  For multivariate has no graphical analysis but used to use regression analysis, ANOVA, Hypothesis analysis.

2.2.4 Data Quality analysis

This phase identified and describes the potential errors like outliers, missing data, level of granularity, validation, reliability, bad metadata and inconsistency.  On this phase AAA (attribute agreement analysis) analysed discrete data for data error. Continuous data analysed with Gage repeatability and reproducibility (Gage R & R) which follow SOP (standard operating procedures). Here Gage R & R define the aggregation of variation in the measurement data because of the measurement system.

2.3 Data Preparation

Data Preparation is the time consuming stage for every data science project. Overall on every data science project 60% to 70% time spend on data preparation stage. Data preparation stapes are described below.

2.3.1 Data integration

Data integration involved to integrate or merged multiple dataset. Integration integrates data from different dataset where same attribute or same columns presents but when there is different attribute then merging the both dataset.

2.3.2 Data Wrangling

On this subset data are going to clean, curate and prepare for next level. Here analysis the outlier and treatment done with 3 R technique (Rectify, Remove, Retain) and for special cases if there are lots of outliner then need to treat outlier separately (upper outliner in an one dataset and lower outliner in another dataset) and alpha (significant value) trim technique use to separate the outliner from the original dataset. If dataset has a missing data then need to use imputation technique like mean, median, mode, regression, KNN etc.

If dataset is not normal or has a collinearity problem or autocorrelation then need to implement transformation techniques like log, exponential, sort, Reciprocal, Box-cox etc. On this subset use the data normalization (data –means/standard deviation) or standardization (min- max scaler) technique to make unitless and scale free data. This step also help if data required converting into categorical then need to use discretization or binning or grouping technique. For factor variable (where has limited set of values), dummy variable creation technique need to apply like one hot encoding.  On this subset also help heterogeneous data to transform into homogenous with clustering technique. Data inconsistencies also handle the inconsistence of data to make data in a single scale.

2.3.3 Feature engineering and selection/reduction

Feature engineering may called as attribute generation or feature extraction. Feature extraction creating new feature by reducing original feature to make simplex model. Feature engineering also do the normalized feature by producing calculative new feature. So feature engineering is a data pre-process technique where improve data quality by cleaning, integration, reduction, transformation and scaling.

Feature selections reduce the multicollinearity or high correlated data and make model simple. Main two type of feature selection technique are supervised and unsupervised. Principal Components Analysis (PCA) is an unsupervised feature reduction/ feature selection technique and LDA is a Linear Discriminant analysis supervised technique mainly use for classification problem. LDA analyse by comparing mean of the variables. Supervised technique is three types filter, wrapper and ensemble method. Filter method is easy to implement but wrapper is costly method and ensemble use inside a model.

2.4 Model

2.4.1 Model Selection Technique

Model selection techniques are influence by accuracy and performance.  Because recommendation need better performance but banking fraud detection needs better accuracy technique.  Model is mainly subdivided into two category supervised learning where predict an output variable according to given an input variable and unsupervised learning where has not output variable.

On supervised learning if an output variable is categorical than it is classification problem like two classes or multiclass classification problem. If an output variable is continuous (numerical) then the problem is called prediction problem. If need to recommending according to relevant information is called recommendation problem or if need to retrieve data according to relevance data is called retrieval problem.

On unsupervised learning where target or output variable is not present. On this technique all variable is treated as an input variable. Unsupervised learning also called clustering problem where clustering the dataset for future decision.

Reinforcement learning agent solves the problem by getting reward for success and penalty for any failure. And semi-supervised learning is a process to solve the problem by combining supervised and unsupervised learning method. On semi-supervised, a problem solved by apply unsupervised clustering technique then for each cluster apply different type of supervised machine learning algorithm like linear algorithm, neural network, K nearest  neighbour etc.

On data mining model selection technique, where output variable is known, then need to implement supervised learning.  Regression is the first choice where interpretation of parameter is important. If response variable is continuous then linear regression or if response variable is discrete with 2 categories value then logistic regression or if response variable is discrete with more than 2 categorical values then multinomial or ordinal regression or if response variable is count then poission where mean is equal to variance or negative binomial regression where variance is grater then mean or if response variable contain excessive zero values then need to choose Zero inflated poission (ZIP) or Zero inflated negative binomial (ZINB).

On supervised technique except regression technique all other technique can be used for both continuous or categorical response variable like KNN (K-Nearest Neighbour),  Naïve Bays, Black box techniques (Neural network, Support vector machine), Ensemble Techniques (Stacking, Bagging like random forest, Boosting like Decision tree, Gradient boosting, XGB, Adaboost).

When response variable is unknown then need to implement unsupervised learning. Unsupervised learning for row reduction is K-Means, Hierarchical etc., for columns reduction or dimension reduction PCA (principal component analysis), LDA (Linear Discriminant analysis), SVD (singular value decomposition) etc. On market basket analysis or association rules where measure are support and confidence then lift ration to determine which rules is important. There are recommendation systems, text analysis and NLP (Natural language processing) also unsupervised learning technique.

For time series need to select forecasting technique. Where forecasting may model based or data based. For Trend under model based need to use linear, exponential, quadratic techniques. And for seasonality need to use additive, multiplicative techniques. On data base approaches used auto regressive, moving average, last sample, exponential smoothing (e.g. SES – simple exponential smoothing, double exponential smoothing, and winters method).

2.4.2 Model building

After selection model according to model criterion model is need to be build. On model building provided data is subdivided with training, validation and testing.  But sometime data is subdivided just training and testing where information may leak from testing data to training data and cause an overfitting problem. So training dataset should be divided into training and validation whereas training model is tested with validation data and if need any tuning to do according to feedback from validation dataset. If accuracy is acceptable and error is reasonable then combine the training and validation data and build the model and test it on unknown testing dataset. If the training error and testing error is minimal or reasonable then the model is right fit or if the training error is low and testing error is high then model is over fitted (Variance) or if training error is high and testing error is also high then model is under fitted (bias). When model is over fitted then need to implement regularization technique (e.g. linear – lasso, ridge regression, Decision tree – pre-pruning, post-pruning, Knn – K value, Naïve Bays – Laplace, Neural network – dropout, drop connect, batch normalization, SVM –  kernel trick)

When data is balance then split the data training, validation and testing and here training is larger dataset then validation and testing. If data set is imbalance then need to use random resampling (over and under) by artificially increases training dataset. On random resampling by randomly partitioning data and for each partition implement the model and taking the average of accuracy. Under K fold cross validation creating K times cross dataset and creating model for every dataset and validate, after validation taking the average of accuracy of all model. There is more technique for imbalance dataset like SMOTH (synthetic minority oversampling technique), cluster based sampling, ensemble techniques e.g. Bagging, Boosting (Ada Boost, XGBoost).

2.4.3 Model evaluation and Tuning

On this stage model evaluate according to errors and accuracy and tune the error and accuracy for acceptable manner. For continuous outcome variable there are several way to measure the error like mean error, mean absolute deviation, Mean squared error, Root mean squared error, Mean percentage error and Mean absolute percentage error but more acceptable way is Mean absolute percentage error. For this continuous data if error is known then it is easy to find out the accuracy because accuracy and error combining value is one. The error function also called cost function or loss function.

For discrete output variable model, for evaluation and tuning need to use confusion matrix or cross table. From confusion matrix, by measuring accuracy, error, precision, sensitivity, specificity, F1 help to take decision about model fitness. ROC curve (Receiver operating characteristic curve), AUC curve (Area under the ROC curve) also evaluate the discrete output variable. AUC and ROC curve plot of sensitivity (true positive rate) vs 1-specificity (false positive rate).  Here sensitivity is a positive recall and  recall is basically out of all positive samples, how sample classifier able to identify. Specificity is negative recall here recall is out of all negative samples, how many sample classifier able to identify.  On AUC where more the area under the ROC is represent better accuracy. On ROC were step bend it’s indicate the cut off value.

2.4.4 Model Assessment

There is several ways to assess the model. First it is need to verify model performance and success according to desire achievement. It needs to identify the implemented model result according to accuracy where accuracy is repeatable and reproducible. It is also need to identify that the model is scalable, maintainable, robust and easy to deploy. On assessment identify that the model evaluation about satisfactory results (identify the precision, recall, sensitivity are balance) and meet business requirements.

2.5 Evaluation

On evaluation steps, all models which are built with same dataset, given a rank to find out the best model by assessing model quality of result and simplicity of algorithm and also cost of deployment. Evaluation part contains the data sufficiency report according to model result and also contain suggestion, feedback and recommendation from solutions team and SMEs (Subject matter experts) and record all these under OPA (organizational process assets).

2.6 Deployment

Deployment process needs to monitor under PEST (political economical social technological) changes within the organization and outside of the organization. PEST is similar to SWOT (strength weakness opportunity and thread) where SW represents the changes of internal and OT represents external changes.

On this deployment steps model should be seamless (like same environment, same result etc.) from development to production. Deployment plan contain the details of human resources, hardware, software requirements. Deployment plan also contain maintenance and monitoring plan by checking the model result and validity and if required then implement retire, replace and update plan.

3 Summaries

CRISP-DM implementation is costly and time consuming. But CRISP-DM methodology is an umbrella for data mining process. CRISP-DM has six phases, Business understanding, Data understanding, Modelling, Evaluation and Deployment. Every phase has several individual criteria, standard and process. CRISP-DM is Guideline for data mining process so if CRISP-DM is going to implement in any project it is necessary to follow each and every single guideline and maintain standard and criteria to get required result.

4 References

  1. Fu, Y., (1997), “Data Mining: Tasks, Techniques and Applications”, Potentials, IEEE, 16: 4, 18–20.
  2. Hand, D. J., (1999), “Statistics and Data Mining: Intersecting Disciplines”, ACM SIGKDD Explorations Newsletter, 1: 1, 16 – 19.
  3. Kantardzic, M., (2003), “Data Mining: Concepts, Models, Methods, and Algorithms” John Wiley and Sons, Inc., Hoboken, New Jersey
  4. Martínez-Plumed, F., Contreras-Ochando, L., Ferri, C., Orallo, J.H., Kull, M., Lachiche, N., Quintana, M.J.R. and Flach, P.A., 2019. CRISP-DM Twenty Years Later: From Data Mining Processes to Data Science Trajectories. IEEE Transactions on Knowledge and Data Engineering.
  5. Read, B.J., (1999), “Data Mining and Science? Knowledge discovery in science as opposed to business”, 12th ERCIM Workshop on Database Research.

How the Pandemic is Changing the Data Analytics Outsourcing Industry

While media pundits have largely focused on the impact of COVID-19 as far as human health is concerned, it hasn’t been particularly good for the health of automated systems either. As cybersecurity budgets plummet in the face of dwindling finances, computer criminals have taken the opportunity to increase attacks against high value targets.

In June, an online antique store suffered a data breach that contained over 3 million records, and it’s likely that a number of similar attacks have simply gone unpublished. Fortunately, data scientists are hard at work developing new methods of fighting back against these kinds of breaches. Budget constraints and a lack of personnel as a result of the pandemic continues to be a problem, but automation has helped to assuage the issue to some degree.

AI-Driven Data Storage Systems

Big data experts have long promoted the cloud as an ideal metaphor for the way that data is stored remotely, but as a result few people today consider the physical locations that this information is stored at. All data has to be located on some sort of physical storage device. Even so-called serverless apps have to be distributed from a server unless they’re fully deployed using P2P services.

Since software can never truly replace hardware, researchers are looking at refining the various abstraction layers that exist between servers and the clients who access them. Data warehousing software has enabled computer scientists to construct centralized data storage solutions that look like traditional disk locations. This gives users the ability to securely interact with resources that are encrypted automatically.

Background services based on artificial intelligence monitor virtual data warehouse locations, which gives specialists the freedom to conduct whatever analytics they deem necessary. In some cases, a data warehouse can even anonymize information as it’s stored, which can streamline workflows involved with the analysis process.

While this level of automation has proven useful, it’s still subject to some of the problems that have occurred as a result of the pandemic. Traditional supply chains are in shambles and a large percentage of technical workers are now telecommuting. If there’s a problem with any existing big data plans, then there’s often nobody around to do any work in person.

Living with Shifting Digital Priorities

Many businesses were in the process of outsourcing their data operations even before the pandemic, and the current situation is speeding this up considerably. Initial industry estimates had projected steady growth numbers for the data analytics sector through 2025. While the current figures might not be quite as bullish, it’s likely that sales of outsourcing contracts will remain high.

That being said, firms are also shifting a large percentage of their IT spending dollars into cybersecurity projects. A recent survey found that 37 percent of business leaders said they were already going to cut their IT department budgets. The same study found that 28 percent of businesses are going to move at least some part of their data analytics programs abroad.

Those companies that can’t find an attractive outsourcing contract might start to patch their remote systems over a virtual private network. Unfortunately, this kind of technology has been strained to some degree in recent months. The virtual servers that power VPNs are flooded with requests, which in turn has brought them down in some instances. Neural networks, which utilize deep learning technology to improve themselves as time goes on, have proven more than capable of predicting when these problems are most likely to arise.

That being said, firms that deploy this kind of technology might find that it still costs more to work with automated technology on-premise compared to simply investing in an outsourcing program that works with these kinds of algorithms at an outside location.

Saving Money in the Time of Corona

Experts from Think Big Analytics pointed out how specialist organizations can deal with a much wider array of technologies than a small business ever could. Since these companies specialize in providing support for other organizations, they have a tendency to offer support for a large number of platforms.

These representatives recently opined that they could provide support for NoSQL, Presto, Apache Spark and several other emerging platforms at the same time. Perhaps most importantly, these organizations can work with Hadoop and other traditional data analysis languages.

Staffers working on data mining operations have long relied on languages like Hadoop and R to write scripts that they later use to automate the process of collecting and analyzing data. By working with an organization that already supports a language that companies rely on, they can avoid the need of changing up their existing operations.

This can help to drastically reduce the cost of migration, which is extremely important since many of the firms that need to migrate to a remote system are already suffering from budget problems. Assuming that some issues related to the pandemic continue to plague businesses for some time, it’s likely that these budget constraints will force IT departments to consider a migration even if they would have otherwise relied solely on a traditional colocation arrangement.

IT department staffers were already moving away from many rare platforms even before the COVID-19 pandemic hit, however, so this shouldn’t be as much of a herculean task as it sounds. For instance, the KNIME Analytics Platform has increased in popularity exponentially since it’s release in 2006. The fact that it supports over 1,000 plug-in modules has made it easy for smaller businesses to move toward the platform.

The road ahead isn’t going to be all that pleasant, however. COBOL and other antiquated languages still rule the roost at many governmental big data processing centers. At the same time, some small businesses have never even been able to put a big data plan into play in the first place. As the pandemic continues to wreak havoc on the world’s economy, however, it’s likely that there will be no shortage of organizations continuing to migrate to more secure third-party platforms backed by outsourcing contracts.

Six properties of modern Business Intelligence

Regardless of the industry in which you operate, you need information systems that evaluate your business data in order to provide you with a basis for decision-making. These systems are commonly referred to as so-called business intelligence (BI). In fact, most BI systems suffer from deficiencies that can be eliminated. In addition, modern BI can partially automate decisions and enable comprehensive analyzes with a high degree of flexibility in use.


Read this article in German:
“Sechs Eigenschaften einer modernen Business Intelligence“


Let us discuss the six characteristics that distinguish modern business intelligence, which mean taking technical tricks into account in detail, but always in the context of a great vision for your own company BI:

1. Uniform database of high quality

Every managing director certainly knows the situation that his managers do not agree on how many costs and revenues actually arise in detail and what the margins per category look like. And if they do, this information is often only available months too late.

Every company has to make hundreds or even thousands of decisions at the operational level every day, which can be made much more well-founded if there is good information and thus increase sales and save costs. However, there are many source systems from the company’s internal IT system landscape as well as other external data sources. The gathering and consolidation of information often takes up entire groups of employees and offers plenty of room for human error.

A system that provides at least the most relevant data for business management at the right time and in good quality in a trusted data zone as a single source of truth (SPOT). SPOT is the core of modern business intelligence.

In addition, other data on BI may also be made available which can be useful for qualified analysts and data scientists. For all decision-makers, the particularly trustworthy zone is the one through which all decision-makers across the company can synchronize.

2. Flexible use by different stakeholders

Even if all employees across the company should be able to access central, trustworthy data, with a clever architecture this does not exclude that each department receives its own views of this data. Many BI systems fail due to company-wide inacceptance because certain departments or technically defined employee groups are largely excluded from BI.

Modern BI systems enable views and the necessary data integration for all stakeholders in the company who rely on information and benefit equally from the SPOT approach.

3. Efficient ways to expand (time to market)

The core users of a BI system are particularly dissatisfied when the expansion or partial redesign of the information system requires too much of patience. Historically grown, incorrectly designed and not particularly adaptable BI systems often employ a whole team of IT staff and tickets with requests for change requests.

Good BI is a service for stakeholders with a short time to market. The correct design, selection of software and the implementation of data flows / models ensures significantly shorter development and implementation times for improvements and new features.

Furthermore, it is not only the technology that is decisive, but also the choice of organizational form, including the design of roles and responsibilities – from the technical system connection to data preparation, pre-analysis and support for the end users.

4. Integrated skills for Data Science and AI

Business intelligence and data science are often viewed and managed separately from each other. Firstly, because data scientists are often unmotivated to work with – from their point of view – boring data models and prepared data. On the other hand, because BI is usually already established as a traditional system in the company, despite the many problems that BI still has today.

Data science, often referred to as advanced analytics, deals with deep immersion in data using exploratory statistics and methods of data mining (unsupervised machine learning) as well as predictive analytics (supervised machine learning). Deep learning is a sub-area of ​​machine learning and is used for data mining or predictive analytics. Machine learning is a sub-area of ​​artificial intelligence (AI).

In the future, BI and data science or AI will continue to grow together, because at the latest after going live, the prediction models flow back into business intelligence. BI will probably develop into ABI (Artificial Business Intelligence). However, many companies are already using data mining and predictive analytics in the company, using uniform or different platforms with or without BI integration.

Modern BI systems also offer data scientists a platform to access high-quality and more granular raw data.

5. Sufficiently high performance

Most readers of these six points will probably have had experience with slow BI before. It takes several minutes to load a daily report to be used in many classic BI systems. If loading a dashboard can be combined with a little coffee break, it may still be acceptable for certain reports from time to time. At the latest, however, with frequent use, long loading times and unreliable reports are no longer acceptable.

One reason for poor performance is the hardware, which can be almost linearly scaled to higher data volumes and more analysis complexity using cloud systems. The use of cloud also enables the modular separation of storage and computing power from data and applications and is therefore generally recommended, but not necessarily the right choice for all companies.

In fact, performance is not only dependent on the hardware, the right choice of software and the right choice of design for data models and data flows also play a crucial role. Because while hardware can be changed or upgraded relatively easily, changing the architecture is associated with much more effort and BI competence. Unsuitable data models or data flows will certainly bring the latest hardware to its knees in its maximum configuration.

6. Cost-effective use and conclusion

Professional cloud systems that can be used for BI systems offer total cost calculators, such as Microsoft Azure, Amazon Web Services and Google Cloud. With these computers – with instruction from an experienced BI expert – not only can costs for the use of hardware be estimated, but ideas for cost optimization can also be calculated. Nevertheless, the cloud is still not the right solution for every company and classic calculations for on-premise solutions are necessary.

Incidentally, cost efficiency can also be increased with a good selection of the right software. Because proprietary solutions are tied to different license models and can only be compared using application scenarios. Apart from that, there are also good open source solutions that can be used largely free of charge and can be used for many applications without compromises.

However, it is wrong to assess the cost of a BI only according to its hardware and software costs. A significant part of cost efficiency is complementary to the aspects for the performance of the BI system, because suboptimal architectures work wastefully and require more expensive hardware than neatly coordinated architectures. The production of the central data supply in adequate quality can save many unnecessary processes of data preparation and many flexible analysis options also make redundant systems unnecessary and lead to indirect savings.

In any case, a BI for companies with many operational processes is always cheaper than no BI. However, if you take a closer look with BI expertise, cost efficiency is often possible.

Customer Journey Mapping: The data-driven approach to understanding your users

Businesses across the globe are on a mission to know their customers inside out – something commonly referred to as customer-centricity. It’s an attempt to better understand the needs and wants of customers in order to provide them with a better overall experience.

But while this sounds promising in theory, it’s much harder to achieve in practice. To really know your customer you must not only understand what they want, but you also need to hone in on how they want it, when they want it and how often as well.

In essence, your business should use customer journey mapping. It allows you to visualise customer feelings and behaviours through the different stages of their journey – from the first interaction, right up until the point of purchase and beyond.

The Data-Driven Approach 

To ensure your customer journey mapping is successful, you must conduct some extensive research on your customers. You can’t afford to make decisions based on feelings and emotions alone. There are two types of research that you should use for customer journey mapping – quantitative and qualitative research.

Quantitative data is best for analysing the behaviour of your customers as it identifies their habits over time. It’s also extremely useful for confirming any hypotheses you may have developed. That being so, relying solely upon quantitative data can present one major issue – it doesn’t provide you with the specific reason behind those behaviours.

That’s where qualitative data comes to the rescue. Through data collection methods like surveys, interviews and focus groups, you can figure out the reasoning behind some of your quantitative data trends. The obvious downside to qualitative data is its lack of evidence and its tendency to be subjective. Therefore, a combination of both quantitative and qualitative research is most effective.

Creating A Customer Persona

A customer persona is designed to help businesses understand the key traits of specific groups of people. For example, those defined by their age range or geographic location. A customer persona can help improve your customer journey map by providing more insight into the behavioural trends of your “ideal” customer. 

The one downside to using customer personas is that they can be over-generalised at times. Just because a group of people shares a similar age, for example, it does not mean they all share the same beliefs and interests. Nevertheless, creating a customer persona is still beneficial to customer journey mapping – especially if used in combination with the correct customer journey analytics tools.

All Roads Lead To Customer-centricity 

To achieve customer-centricity, businesses must consider using a data-driven approach to customer journey mapping. First, it requires that you achieve a balance between both quantitative and qualitative research. Quantitative research will provide you with definitive trends while qualitative data gives you the reasoning behind those trends. 

To further increase the effectiveness of your customer journey map, consider creating customer personas. They will give you further insight into the behavioural trends within specific groups. 

This article was written by TAP London. Experts in the Adobe Experience Cloud, TAP London help brands organise data to provide meaningful insight and memorable customer experiences. Find out more at wearetaplondon.com.

Stop processing the same mistakes! Four steps to business & IT alignment

Digitization. Agility. Tech-driven. Just three strategy buzzwords that promise IT transformation and business alignment, but often fade out into merely superficial change. In fact, aligning business and IT still vexes many organizations because company leaders often forget that transformation is not a move from A to B, or even from A to Z––it’s a move from a fixed starting point, to a state of continual change.


Read this article in German:

Mit den richtigen Prozessen zum Erfolg: vier Schritte zum Business-IT Alignment


Within this state of perpetual flux, adaptive technology is necessary, not only to keep up with industry developments but also with the expansion of technology-enabled customer experiences. After all, alignment assumes that business and technology are separate entities, when in fact they are inextricably linked!

Metrics that matter: From information technology to business technology

Information technology is continuing to challenge the way companies organize their business processes, communicate with customers and potential customers, and deliver services. Although there is no single dominant reorganization strategy, common company structures lean towards decentralizing IT, shifting it closer to end-users and melding the knowledge-base with business strategy. Business-IT alignment is more than ever vital for market impact and growth.

This tactic means as business goals pivot, IT can more readily respond with permanent solutions to support and maintain enterprise momentum. In turn, technological advances and improvements are hardwired into current and future strategies and initiatives. As working ecosystems replace strict organizational structures, the traditional question “Which department do you work in?” has been replaced by, “How do you work?”

But how does IT prove its value and win the trust of the C-suite? Well, according to Gartner, almost 20% of companies have already invested in tools capable of monitoring business-relevant metrics, with this number predicted to reach 60% by 2021. The problem is many infrastructure and operations (I&O) leaders don’t know where to begin when initiating an IT monitoring strategy.

Reach beyond the everyday: Four challenges to alignment

With this, CIOs are under mounting pressure to address digital needs that grow and transform, as well as to renovate the operational environment with new functions. They also must still demonstrate how IT is meeting a given business strategy. So looking forward, no matter how big or small your business is, technology can deliver tangible and intangible benefits (like speed and performance) to hit revenue and operational targets efficiently, and meet your customers’ expectations of innovation.

Put simply, having a good technological infrastructure enriches the culture, efficiency, and relationships of your business.

Business and IT alignment: The rate of change

This continuous strategic loop means enterprises function better, make more profit, and see better ROI because they achieve their goals with less effort. And while there may be no standard way to align successfully, an organization where IT and business strategy are in lock-step can further improve agility and operational efficiencies. This battle of the ‘effs’, efficiency vs. effectiveness, has never been so critical to business survival.

In fact, successful companies are those that dive deeper; such is the importance of this synergy. Amazon and Apple are prime examples—technology and technological innovation is embedded and aligned within their operational structure. In several cases, they created the integral technology and business strategies themselves!

Convergence and Integration

These types of aligned companies have also increased the efficiency of technology investments and significantly reduced the financial and operational risks associated with business and technical change.

However, if this rate of change and business agility is as fast as we continually say, we need to be talking about convergence and integration, not just alignment. In other words, let’s do the research and learn, but empower next-level thinking so we can focus on the co-creation of “true value” and respond quickly to customers and users.

Granular strategies

Without this granular strategy, companies may spend too much on technology without ever solving the business challenges they face, simply due to differing departmental objectives, cultures, and incentives. Simply put, business-IT alignment integrates technology with the strategy, mission, and goals of an organization. For example:

  • Faster time-to-market
  • Increased profitability
  • Better customer experience
  • Improved collaboration
  • Greater industry and IT agility
  • Strategic technological transformation

Hot topic

View webinar recording Empowering Collaboration Between Business and IT, with Fabio Gammerino, Signavio Pre-Sales Consultant.

The power of process: Four steps to better business-IT alignment

While it may seem intuitive, many organizations struggle to achieve the elusive goal of business-IT alignment. This is not only because alignment is a cumbersome and lengthy process, but because the overall process is made up of many smaller sub-processes. Each of these sub-processes lacks a definitive start and endpoint. Instead, each one comprises some “learn and do” cycles that incrementally advance the overall goal.

These cycles aren’t simple fixes, and this explains why issues still exist in the modern digital world. But by establishing a common language, building internal business relationships, ensuring transparency, and developing precise corporate plans of action, the bridge between the two stabilizes.

Four steps to best position your business-IT alignment strategy:

  1. Plan: Translate business objectives into measurable IT services, so resources are effectively allocated to maximize turnover and ROI – This step requires ongoing communication between business and IT leaders.
  2. Model: IT designs infrastructure to increase business value and optimize operations – IT must understand business needs and ensure that they are implementing systems critical to business services.
  3. Manage: Service is delivered based on company objectives and expectations – IT must act as a single point-of-service request, and prioritize those requests based on pre-defined priorities.
  4. Measure: Improvement of cross-organization visibility and service level commitments – While metrics are essential, it is crucial that IT ensures a business context to what they are measuring, and keeps a clear relationship between the measured parameter and business goals.

Signavio Says

Temporarily rotating IT employees within business operations is a top strategy in reaching business-IT alignment because it circulates company knowledge. This cross-pollination encourages better relationships between the IT department and other silos and broadens skill-sets, especially for entry-level employees. Better knowledge depth gives the organization more flexibility with well-rounded employees who can fill various roles as demand arises.

Get in touch

Discover how Signavio can lead your business to IT transformation and operational excellence with the  Signavio Business Transformation Suite. Try it for yourself by registering now for a free 30-day trial.

How Data Analytics In The Cloud Transforms Your Business

Businesses have started to turn to cloud-based technology to solve their growing data problems. But before we dive deep into the reason behind it, let’s look at some reasons why data analytics is such a powerful tool. It all falls back to businesses like Netflix, Amazon, Google, and Facebook. All of these businesses are using data analytics to understand their customers and are making an absolute fortune. They also have so much data coming in that they needed to mitigate it somehow, so they turned to the cloud.

Let’s use Netflix as an example here. They have over 115 million subscribers and have become the absolute king of the online streaming industry. Their rise to the top was no fluke. They developed state-of-the-art methods of data analytics and then gathered the information needed to provide the right entertainment to the right people.

Amazon uses data to learn about its customers. They analyze all behavior on their website and then target customers based on that data.

Cloud-based technologies are designed to reduce costs associated with older data analytical methods. Businesses like Netflix, Amazon, Google, and Facebook have all started underpinning the cloud because they know it’s the future. They based their entire business models around it.

But smaller businesses still have a long way to go. Only 40% of businesses are using data as the core piece of their business strategy.

Now let’s look at some ways that data analytics has transformed business.

It Gave Birth to Strategic Analytics

Strategic analytics is the backbone of your entire data plan. It is a detailed analysis of the entire system that is used to determine how you are funneling customers into your system. It will reveal weak points and show you the strengths so that you can develop data-driven strategies moving forward. It also helps you understand the behavior of your market.

Strategic analytics follows a three-step process:

  1. Identify your business model’s strengths and weaknesses in comparison with your competition.
  2. Diagnose all of your business processes to determine areas that might need to be improved.
  3. Analyze individuals within the company to make sure you are properly using them. You would be surprised at the number of businesses wasting their employees’ talents on inefficient tasks.

At the end of it all, your business should be able to determine areas of your marketing where you can pull out more value, as well as data that you need to start gathering.

Fuel your Decisions with Platform Analytics

The goal here is to combine data analytics with your decision-making processes so that your business operates more efficiently at its very core. If money is the lifeblood of your business, then decisions are the heart that keeps that money flowing. So think of analytics as a healthy diet. It keeps every area of your business healthy and operating at peak efficiency. Platform analytics asks some important questions like:

  • How can data analytics be efficiently added to our everyday business processes?
  • Are there any areas that we can automate that will improve efficiency?
  • What will back end systems benefit from learning more about our customers?

In most cases, businesses will find that the cloud will enhance their overall data plan, no matter which point they have reached in their growth. Think of it like checking your blood pressure. If there are problems, then you know that you’ll need a diagnosis.

Helps Businesses Transform their Model

Businesses will need to use data in parallel with their model to stay caught up with the changing times as we move forward. In layman’s terms, businesses need to update their core business processes in a way so that it uses data to create opportunities. This opens up a whole new world for their customers, products, and services.

Companies that can forecast using data will see improvements across the board – from their recruitment to their marketing. But there is a specific data-centric approach that must be taken.

  • Must possess an overall vision that includes data and capitalizes on the opportunities presented.
  • Develop a culture that is centered on data and is not afraid to experiment with it.
  • Leverage new technologies to manage their data. Right now, the latest technology is cloud-based so businesses must learn to leverage it.
  • Use data to build trust with consumers.
  • Find innovative ways to gain insight into upcoming trends and tap into there as quickly as possible.

Management of Enterprise Information

Enterprise information management (known as EIM) is an important part of data-driven processes. Most data in businesses is stored in an unmanaged location like a server or some other in-house database. Cloud-based technologies have created a more secure way to store data, but you will still need a data management system in place.

By developing agile data management systems, you will be able to gather and distribute data more efficiently. EIM systems allow businesses to:

  • Streamline all of their processes in a way that simplifies everyone’s job.
  • Improve collaboration among different teams.
  • Improve the productivity of employees.

Creates a Data-Centric Business

This is the most important factor in business today, and it’s the reason why all businesses must start using the latest data analytics strategies. The more useful data a business can generate, the more of an advantage they are going to have. Again, look at leaders like Netflix and Amazon to see this in action. They are generating essential information from everyone who browses their systems. Their entire business models are centered on data, and it’s the number one reason why they are at the top of their respective industries.

Insight, optimization, and innovation are the three main categories of data analytics.

Final Thoughts

The Research Optimus Team understands that having the right data migration system is going to benefit all businesses, both large and small. It’s why their focus has turned to cloud-based technologies. Could-enabled businesses gain a competitive advantage over those who are still relying on older data technologies.

Business moves at supersonic speeds now so if you are not staying current with the latest technology, then you are going to fall behind.


AI For Advertisers: How Data Analytics Can Change The Maths Of Advertising?

All Images Credit: Freepik

The task of understanding a customer’s journey and designing your marketing strategy accordingly can be difficult in this data-driven world. Today, the customer expresses their needs in myriad forms of requests.

Consumers express their needs and want attitudes, and values in various forms through search, comments, blogs, Tweets, “likes,” videos, and conversations and access such data across many channels like web, mobile, and face to face. Volume, variety, velocity and veracity of the data accumulated through these customer interactions are huge.

BigData and data analytics can be leveraged to understand several phases of the customer journey. There are risks involved in using Artificial Intelligence for the marketing data analysis of data breach and even manipulation. But, AI do have brighter prospects when it comes to marketing and advertiser applications.

As the CEO of a technology firm Chop Dawg and marketer, Joshua Davidson puts it, “AI-powered apps are going to be the future for us, and there are several industries that are ripe for this.” The mobile-first strategy of many enterprises has powered the use of AI for digital marketing and developing technologies and innovations to power industries with intelligent systems.

How AI and Machine learning are affecting customer journeys?

Any consumer journey begins with the recognition of a problem and then stages like initial consideration, active evaluation, purchase, and postpurchase come through up till the consumer journey is over. The need for identifying the purchasing and need patterns of the consumers and finding the buyer personas to strategize the marketing for them.

Need and Want Recognition:

Identifying a need is quite difficult as it is the most initial level of a consumer’s journey and it is more on the category level than at a brand level. Marketers and advertisers are relying on techniques like market research, web analytics, and data mining to build consumer profiles and buyer’s persona for understanding the needs and influencing the purchase of products. AI can help identify these wants and needs in real-time as the consumers usually express their needs and wants online and help build profiles more quickly.

AI technologies offered by several firms help in consumer profiling. Firms like Microsoft offers Azure that crunches billions of data points in seconds to determine the needs of consumers. It then personalizes web content on specific platforms in real-time to align with those status-updates. Consumer digital footprints are evolving through social media status updates, purchasing behavior, online comments and posts. Ai tends to update these profiles continuously through machine learning techniques.

Initial Consideration:

A key objective of advertising is to insert a brand into the consideration set of the consumers when they are looking for deliberate offerings. Advertising includes increasing the visibility of brands and emphasize on the key reasons for consideration. Advertisers currently use search optimization, paid search advertisements, organic search, or advertisement retargeting for finding the consideration and increase the probability of consumer consideration.

AI can leverage machine learning and data analytics to help with search, identify and rank functions of consumer consideration that can match the real-time considerations at any specific time. Take an example of Google Adwords, it analyzes the consumer data and helps advertisers make clearer distinctions between qualified and unqualified leads for better targeting.

Google uses AI to analyze the search-query data by considering, not only the keywords but also context words and phrases, consumer activity data and other BigData. Then, Google identifies valuable subsets of consumers and more accurate targeting.

Active Evaluation: 

When consumers narrow it down to a few choices of brands, advertisers need to insert trust and value among the consumers for brands. A common technique is to identify the higher purchase consumers and persuade them through persuasive content and advertisement. AI can support these tasks using some techniques:

Predictive Lead Scoring: Predictive lead scoring by leveraging machine learning techniques of predictive analytics to allow marketers to make accurate predictions related to the intent of purchase for consumers. A machine learning algorithm runs through a database of existing consumer data, then recognize trends and patterns and after processing the external data on consumer activities and interests, creates robust consumer profiles for advertisers.

Natural Language Generation: By leveraging the image, speech recognition and natural language generation, machine learning enables marketers to curate content while learning from the consumer behavior in real-time scenarios and adjusts the content according to the profiles on the fly.

Emotion AI: Marketers use emotion AI to understand consumer sentiment and feel about the brand in general. By tapping into the reviews, blogs or videos they understand the mood of customers. Marketers also use emotion AI to pretest advertisements before its release. The famous example of Kelloggs, which used emotion AI to help devise an advertising campaign for their cereal, eliminating the advertisement executions whenever the consumer engagement dropped.

Purchase: 

As the consumers decide which brands to choose and what it’s worth, advertising aims to move them out of the decision process and push for the purchase by reinforcing the value of the brand compared with its competition.

Advertisers can insert such value by emphasizing convenience and information about where to buy the product, how to buy the product and reassuring the value through warranties and guarantees. Many marketers also emphasize on rapid return policies and purchase incentives.

AI can completely change the purchase process through dynamic pricing, which encompasses real-time price adjustments on the basis of information such as demand and other consumer-behavior variables, seasonality, and competitor activities.

Post-Purchase: 

Aftersales services can be improved through intelligent systems using AI technologies and machine learning techniques. Marketers and advertisers can hire dedicated developers to design intelligent virtual agents or chatbots that can reinforce the value and performance of a brand among consumers.

Marketers can leverage an intelligent technique known as Propensity modeling to identify the most valuable customers on the basis of lifetime value, likelihood of reengagement, propensity to churn, and other key performance measures of interest. Then advertisers can personalize their communication with these customers on the basis of these data.

Conclusion:

AI has shifted the focus of advertisers and marketers towards the customer-first strategies and enhanced the heuristics of customer engagement. Machine learning and IoT(Internet of Things) has already changed the way customer interact with the brands and this transition has come at a time when advertisers and marketers are looking for new ways to tap into the customer mindset and buyer’s persona.

All Images Credit: Freepik

Process Paradise by the Dashboard Light

The right questions drive business success. Questions like, “How can I make sure my product is the best of its kind?” “How can I get the edge over my competitors?” and “How can I keep growing my organization?” Modern businesses take their questions further, focusing on the details of how they actually function. At this level, the questions become, “How can I make my business as efficient as possible?” “How can I improve the way my company does business?” and even, “Why aren’t my company’s processes working as they should?”


Read this article in German:

Mit Dashboards zur Prozessoptimierung


To discover the answers to these questions (and many others!), more and more businesses are turning to process mining. Process mining helps organizations unlock hidden value by automatically collecting information on process models from across the different IT systems operating within a business. This allows for continuous monitoring of an organization’s end-to-end process landscape, meaning managers and staff gain specific operational insights into potential risks—as well as ongoing improvement opportunities.

However, process mining is not a silver bullet that turns data into insights at the push of a button. Process mining software is simply a tool that produces information, which then must be analyzed and acted upon by real people. For this to happen, the information produced must be available to decision-makers in an understandable format.

For most process mining tools, the emphasis remains on the sophistication of analysis capabilities, with the resulting data needing to be interpreted by a select group of experts or specialists within an organization. This necessarily creates a delay between the data being produced, the analysis completed, and actions taken in response.

Process mining software that supports a more collaborative approach by reducing the need for specific expertise can help bridge this gap. Only if hypotheses, analysis, and discoveries are shared, discussed, and agreed upon with a wide range of people can really meaningful insights be generated.

Of course, process mining software is currently capable of generating standardized reports and readouts, but in a business environment where the pace of change is constantly increasing, this may not be sufficient for very much longer. For truly effective process mining, the secret to success will be anticipating challenges and opportunities, then dealing with them as they arise in real time.

Dashboards of the future

To think about how process mining could improve, let’s consider an analog example. Technology evolves to make things easier—think of the difference between keeping track of expenditure using a written ledger vs. an electronic spreadsheet. Now imagine the spreadsheet could tell you exactly when you needed to read it, and where to start, as well as alerting you to errors and omissions before you were even aware you’d made them.

Advances in process mining make this sort of enhanced assistance possible for businesses seeking to improve the way they work. With the right process mining software, companies can build tailored operational cockpits that unite real-time operational data with process management. This allows for the usual continuous monitoring of individual processes and outcomes, but it also offers even clearer insights into an organization’s overall process health.

Combining process mining with an organization’s existing process models in the right way turns these models from static representations of the way a particular process operates, into dynamic dashboards that inform, guide and warn managers and staff about problems in real time. And remember, dynamic doesn’t have to mean distracting—the right process mining software cuts into your processes to reveal an all-new analytical layer of process transparency, making things easier to understand, not harder.

As a result, business transformation initiatives and other improvement plans and can be adapted and restructured on the go, while decision-makers can create automated messages to immediately be advised of problems and guided to where the issues are occurring, allowing corrective action to be completed faster than ever. This rapid evaluation and response across any process inefficiencies will help organizations save time and money by improving wasted cycle times, locating bottlenecks, and uncovering non-compliance across their entire process landscape.

Dynamic dashboards with Signavio

To see for yourself how the most modern and advanced process mining software can help you reveal actionable insights into the way your business works, give Signavio Process Intelligence a try. With Signavio’s Live Insights, all your process information can be visualized in one place, represented through a traffic light system. Simply decide which processes and which activities within them you want to monitor or understand, place the indicators, choose the thresholds, and let Signavio Process Intelligence connect your process models to the data.

Banish multiple tabs and confusing layouts, amaze your colleagues and managers with fact-based insights to support your business transformation, and reduce the time it takes to deliver value from your process management initiatives. To find out more about Signavio Process Intelligence, or sign up for a free 30-day trial, visit www.signavio.com/try.

Process mining is a powerful analysis tool, giving you the visibility, quantifiable numbers, and information you need to improve your business processes. Would you like to read more? With this guide to managing successful process mining initiatives, you will learn that how to get started, how to get the right people on board, and the right project approach.

The importance of being Data Scientist

Header-Image by Clint Adair on Unsplash.

The incredible results of Machine Learning and Artificial Intelligence, Deep Learning in particular, could give the impression that Data Scientist are like magician. Just think of it. Recognising faces of people, translating from one language to another, diagnosing diseases from images, computing which product should be shown for us next to buy and so on from numbers only. Numbers which existed for centuries. What a perfect illusion. But it is only an illusion, as Data Scientist existed as well for centuries. However, there is a difference between the one from today compared to the one from the past: evolution.

The main activity of Data Scientist is to work with information also called data. Records of data are as old as mankind, but only within the 16 century did it include also numeric forms — as numbers started to gain more and more ground developing their own symbols. Numerical data, from a given phenomenon — being an experiment or the counts of sheep sold by week over the year –, was from early on saved in tabular form. Such a way to record data is interlinked with the supposition that information can be extracted from it, that knowledge — in form of functions — is hidden and awaits to be discovered. Collecting data and determining the function best fitting them let scientist to new insight into the law of nature right away: Galileo’s velocity law, Kepler’s planetary law, Newton theory of gravity etc.

Such incredible results where not possible without the data. In the past, one was able to collect data only as a scientist, an academic. In many instances, one needed to perform the experiment by himself. Gathering data was tiresome and very time consuming. No sensor which automatically measures the temperature or humidity, no computer on which all the data are written with the corresponding time stamp and are immediately available to be analysed. No, everything was performed manually: from the collection of the data to the tiresome computation.

More then that. Just think of Michael Faraday and Hermann Hertz and there experiments. Such endeavour where what we will call today an one-man-show. Both of them developed parts of the needed physics and tools, detailed the needed experiment settings, conducting the experiment and collect the data and, finally, computing the results. The same is true for many other experiments of their time. In biology Charles Darwin makes its case regarding evolution from the data collected in his expeditions on board of the Beagle over a period of 5 years, or Gregor Mendel which carry out a study of pea regarding the inherence of traits. In physics Blaise Pascal used the barometer to determine the atmospheric pressure or in chemistry Antoine Lavoisier discovers from many reaction in closed container that the total mass does not change over time. In that age, one person was enough to perform everything and was the reason why the last part, of a data scientist, could not be thought of without the rest. It was inseparable from the rest of the phenomenon.

With the advance of technology, theory and experimental tools was a specialisation gradually inescapable. As the experiments grow more and more complex, the background and condition in which the experiments were performed grow more and more complex. Newton managed to make first observation on light with a simple prism, but observing the line and bands from the light of the sun more than a century and half later by Joseph von Fraunhofer was a different matter. The small improvements over the centuries culminated in experiments like CERN or the Human Genome Project which would be impossible to be carried out by one person alone. Not only was it necessary to assign a different person with special skills for a separate task or subtask, but entire teams. CERN employs today around 17 500 people. Only in such a line of specialisation can one concentrate only on one task alone. Thus, some will have just the knowledge about the theory, some just of the tools of the experiment, other just how to collect the data and, again, some other just how to analyse best the recorded data.

If there is a specialisation regarding every part of the experiment, what makes Data Scientist so special? It is impossible to validate a theory, deciding which market strategy is best without the work of the Data Scientist. It is the reason why one starts today recording data in the first place. Not only the size of the experiment has grown in the past centuries, but also the size of the data. Gauss manage to determine the orbit of Ceres with less than 20 measurements, whereas the new picture about the black hole took 5 petabytes of recorded data. To put this in perspective, 1.5 petabytes corresponds to 33 billion photos or 66.5 years of HD-TV videos. If one includes also the time to eat and sleep, than 5 petabytes would be enough for a life time.

For Faraday and Hertz, and all the other scientist of their time, the goal was to find some relationship in the scarce data they painstakingly recorded. Due to time limitations, no special skills could be developed regarding only the part of analysing data. Not only are Data Scientist better equipped as the scientist of the past in analysing data, but they managed to develop new methods like Deep Learning, which have no mathematical foundation yet in spate of their success. Data Scientist developed over the centuries to the seldom branch of science which bring together what the scientific specialisation was forced to split.

What was impossible to conceive in the 19 century, became more and more a reality at the end of the 20 century and developed to a stand alone discipline at the beginning of the 21 century. Such a development is not only natural, but also the ground for the development of A.I. in general. The mathematical tools needed for such an endeavour where already developed by the half of the 20 century in the period when computing power was scars. Although the mathematical methods were present for everyone, to understand them and learn how to apply them developed quite differently within every individual field in which Machine Learning/A.I. was applied. The way the same method would be applied by a physicist, a chemist, a biologist or an economist would differ so radical, that different words emerged which lead to different langues for similar algorithms. Even today, when Data Science has became a independent branch, two different Data Scientists from different application background could find it difficult to understand each other only from a language point of view. The moment they look at the methods and code the differences will slowly melt away.

Finding a universal language for Data Science is one of the next important steps in the development of A.I. Then it would be possible for a Data Scientist to successfully finish a project in industry, turn to a new one in physics, then biology and returning to industry without much need to learn special new languages in order to be able to perform each tasks. It would be possible to concentrate on that what a Data Scientist does best: find the best algorithm. In other words, a Data Scientist could resolve problems independent of the background the problem was stated.

This is the most important aspect that distinguish the Data Scientist. A mathematician is limited to solve problems in mathematics alone, a physicist is able to solve problems only in physics, a biologist problems only in biology. With a unique language regarding the methods and strategies to solve Machine Learning/A.I. problems, a Data Scientist can solve a problem independent of the field. Specialisation put different branches of science at drift from each other, but it is the evolution of the role of the Data Scientist to synthesize from all of them and find the quintessence in a language which transpire beyond all the field of science. The emerging language of Data Science is a new building block, a new mathematical language of nature.

Although such a perspective does not yet exists, the principal component of Machine Learning/A.I. already have such proprieties partially in form of data. Because predicting for example the numbers of eggs sold by a company or the numbers of patients which developed immune bacteria to a specific antibiotic in all hospital in a country can be performed by the same prediction method. The data do not carry any information about the entities which are being predicted. It does not matter anymore if the data are from Faraday’s experiment, CERN of Human Genome. The same data set and its corresponding prediction could stand literary for anything. Thus, the result of the prediction — what we would call for a human being intuition and/or estimation — would be independent of the domain, the area of knowledge it originated.

It also lies at the very heart of A.I., the dream of researcher to create self acting entities, that is machines with consciousness. This implies that the algorithms must be able to determine which task, model is relevant at a given moment. It would be to cumbersome to have a model for every task and and every field and then try to connect them all in one. The independence of scientific language, like of data, is thus a mandatory step. It also means that developing A.I. is not only connected to develop a new consciousness, but, and most important, to the development of our one.

Glorious career paths of a Big Data Professional

Are you wondering about the career profiles you may get to fill if you get into Big Data industry? If yes, then Bingo! This is the post that will inform you just about that. Big data is just an umbrella term. There are a lot of profiles and career paths that are covered under this umbrella term. Let us have a look at some of these profiles.

Data Visualisation Specialist

The process of visualizing data is turning out to be critical in guaranteeing information-driven representatives get the upfront investment required to actualize goal-oriented and significant Big Data extends in their organization. Making your data to tell a story and the craft of envisioning information convincingly has turned into a significant piece of the Big Data world and progressively associations need to have these capacities in-house. Besides, as a rule, these experts are relied upon to realize how to picture in different instruments, for example, Spotfire, D3, Carto, and Tableau – among numerous others. Information Visualization Specialists should be versatile and inquisitive to guarantee they stay aware of most recent patterns and answers for a recount to their information stories in the most intriguing manner conceivable with regards to the board room. 


Big Data Architect

This is the place the Hadoop specialists come in. Ordinarily, a Big Data planner tends to explicit information issues and necessities, having the option to portray the structure and conduct of a Big Data arrangement utilizing the innovation wherein they practice – which is, as a rule, mostly Hadoop.

These representatives go about as a significant connection between the association (and its specific needs) and Data Scientists and Engineers. Any organization that needs to assemble a Big Data condition will require a Big Data modeler who can serenely deal with the total lifecycle of a Hadoop arrangement – including necessity investigation, stage determination, specialized engineering structure, application plan, and advancement, testing the much-dreaded task of deploying lastly.

Systems Architect 

This Big data professional is in charge of how your enormous information frameworks are architected and interconnected. Their essential incentive to your group lies in their capacity to use their product building foundation and involvement with huge scale circulated handling frameworks to deal with your innovation decisions and execution forms. You’ll need this individual to construct an information design that lines up with the business, alongside abnormal state anticipating the improvement. The person in question will consider different limitations, adherence to gauges, and varying needs over the business.

Here are some responsibilities that they play:

    • Determine auxiliary prerequisites of databases by investigating customer tasks, applications, and programming; audit targets with customers and assess current frameworks.
    • Develop database arrangements by planning proposed framework; characterize physical database structure and utilitarian abilities, security, back-up and recuperation particulars.
    • Install database frameworks by creating flowcharts; apply ideal access methods, arrange establishment activities, and record activities.
    • Maintain database execution by distinguishing and settling generation and application advancement issues, figuring ideal qualities for parameters; assessing, incorporating, and putting in new discharges, finishing support and responding to client questions.
    • Provide database support by coding utilities, reacting to client questions, and settling issues.


Artificial Intelligence Developer

The certain promotion around Artificial Intelligence is additionally set to quicken the number of jobs publicized for masters who truly see how to apply AI, Machine Learning, and Deep Learning strategies in the business world. Selection representatives will request designers with broad learning of a wide exhibit of programming dialects which loan well to AI improvement, for example, Lisp, Prolog, C/C++, Java, and Python.

All said and done; many people estimate that this popular demand for AI specialists could cause a something like what we call a “Brain Drain” organizations poaching talented individuals away from the universe of the scholarly world. A month ago in the Financial Times, profound learning pioneer and specialist Yoshua Bengio, of the University of Montreal expressed: “The industry has been selecting a ton of ability — so now there’s a lack in the scholarly world, which is fine for those organizations. However, it’s not extraordinary for the scholarly world.” It ; howeverusiasm to perceive how this contention among the scholarly world and business is rotated in the following couple of years.

Data Scientist

The move of Big Data from tech publicity to business reality may have quickened, yet the move away from enrolling top Data Scientists isn’t set to change in 2020. An ongoing Deloitte report featured that the universe of business will require three million Data Scientists by 2021, so if their expectations are right, there’s a major ability hole in the market. This multidisciplinary profile requires specialized logical aptitudes, specialized software engineering abilities just as solid gentler abilities, for example, correspondence, business keenness, and scholarly interest.

Data Engineer

Clean and quality data is crucial in the accomplishment of Big Data ventures. Consequently, we hope to see a lot of opening in 2020 for Data Engineers who have a predictable and awesome way to deal with information transformation and treatment. Organizations will search for these special data masters to have broad involvement in controlling data with SQL, T-SQL, R, Hadoop, Hive, Python and Spark. Much like Data Scientists. They are likewise expected to be innovative with regards to contrasting information with clashing information types with have the option to determine issues. They additionally frequently need to make arrangements which enable organizations to catch existing information in increasingly usable information groups – just as performing information demonstrations and their modeling.

IT/Operations Manager Job Description

In Big data industry, the IT/Operations Manager is a profitable expansion to your group and will essentially be in charge of sending, overseeing, and checking your enormous information frameworks. You’ll depend on this colleague to plan and execute new hardware and administrations. The person in question will work with business partners to comprehend the best innovation ventures to address their procedures and concerns—interpreting business necessities to innovation plans. They’ll likewise work with venture chiefs to actualize innovation and be in charge of effective progress and general activities.

Here are some responsibilities that they play:

  • Manage and be proactive in announcing, settling and raising issues where required 
  • Lead and co-ordinate issue the executive’s exercises, notwithstanding ceaseless procedure improvement activities  
  • Proactively deal with our IT framework 
  • Supervise and oversee IT staffing, including enrollment, supervision, planning, advancement, and assessment
  • Verify existing business apparatuses and procedures remain ideally practical and worth included 
  • Benchmark, dissect, report on and make suggestions for the improvement and development of the IT framework and IT frameworks 
  • Advance and keep up a corporate SLA structure

Conclusion

These are some of the best career paths that big data professionals can play after entering the industry. Honesty and hard work can always take you to the zenith of any field that you choose to be in. Also, keep upgrading your skills by taking newer certifications and technologies. Good Luck