Tag Archive for: Tool

process.science presents a new release

Advertisement

Process Mining Tool provider process.science presents a new release

process.science, specialist in the development of process mining plugins for BI systems, presents its upgraded version of their product ps4pbi. Process.science has added the following improvements to their plug-in for Microsoft Power BI. Identcal upgrades will soon also be released for ps4qlk, the corresponding plug-in for Qlik Sense:

  • 3x faster performance: By improvement of the graph library the graph built got approx. 300% more performant. This is particularly noticeable in complex processes
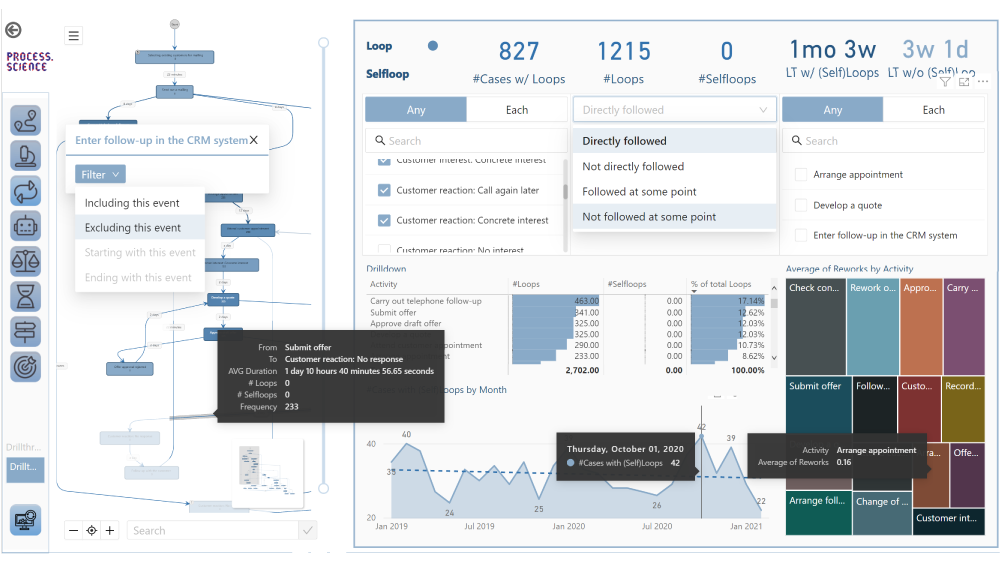
  • Navigator window: For a better overview in complex graphs, an overview window has been added, in which the entire graph and the respective position of the viewed area within the overall process is displayed
  • Activities legend: This allows activities to be assigned to specific categories and highlighted in different colors, for example in which source system an activity was carried out
  • Activity drill-through: This makes it possible to take filters that have been set for selected activities into other dashboards
  • Value Color Scale: Activity values ​​can be color-coded and assigned to freely selectable groupings, which makes the overview easier at first sight
process.science Process Mining on Power BI

process.science Process Mining on Power BI

Process mining is a business data analysis technique. The software used for this extracts the data that is already available in the source systems and visualizes them in a process graph. The aim is to ensure continuous monitoring in real time in order to identify optimization measures for processes, to simulate them and to continuously evaluate them after implementation.

The process mining tools from process.science are integrated directly into Microsoft Power BI and Qlik Sense. A corresponding plug-in for Tableau is already in development. So it is not a complicated isolated solution requires a new set up in addition to existing systems. With process.science the existing know-how on the BI system already implemented and the existing infrastructure framework can be adapted.

The integration of process.science in the BI systems has no influence on day-to-day business and bears absolutely no risk of system failures, as process.science does not intervene in the the source system or any other program but extends the respective business intelligence tool by the process perspective including various functionalities.

Contact person for inquiries:

process.science GmbH & Co. KG
Gordon Arnemann
Tel .: + 49 (231) 5869 2868
Email: ga@process.science
https://de.process.science/

Data Analytics and Mining for Dummies

Data Analytics and Mining is often perceived as an extremely tricky task cut out for Data Analysts and Data Scientists having a thorough knowledge encompassing several different domains such as mathematics, statistics, computer algorithms and programming. However, there are several tools available today that make it possible for novice programmers or people with no absolutely no algorithmic or programming expertise to carry out Data Analytics and Mining. One such tool which is very powerful and provides a graphical user interface and an assembly of nodes for ETL: Extraction, Transformation, Loading, for modeling, data analysis and visualization without, or with only slight programming is the KNIME Analytics Platform.

KNIME, or the Konstanz Information Miner, was developed by the University of Konstanz and is now popular with a large international community of developers. Initially KNIME was originally made for commercial use but now it is available as an open source software and has been used extensively in pharmaceutical research since 2006 and also a powerful data mining tool for the financial data sector. It is also frequently used in the Business Intelligence (BI) sector.

KNIME as a Data Mining Tool

KNIME is also one of the most well-organized tools which enables various methods of machine learning and data mining to be integrated. It is very effective when we are pre-processing data i.e. extracting, transforming, and loading data.

KNIME has a number of good features like quick deployment and scaling efficiency. It employs an assembly of nodes to pre-process data for analytics and visualization. It is also used for discovering patterns among large volumes of data and transforming data into more polished/actionable information.

Some Features of KNIME:

  • Free and open source
  • Graphical and logically designed
  • Very rich in analytics capabilities
  • No limitations on data size, memory usage, or functionalities
  • Compatible with Windows ,OS and Linux
  • Written in Java and edited with Eclipse.

A node is the smallest design unit in KNIME and each node serves a dedicated task. KNIME contains graphical, drag-drop nodes that require no coding. Nodes are connected with one’s output being another’s input, as a workflow. Therefore end-to-end pipelines can be built requiring no coding effort. This makes KNIME stand out, makes it user-friendly and make it accessible for dummies not from a computer science background.

KNIME workflow designed for graduate admission prediction

KNIME workflow designed for graduate admission prediction

KNIME has nodes to carry out Univariate Statistics, Multivariate Statistics, Data Mining, Time Series Analysis, Image Processing, Web Analytics, Text Mining, Network Analysis and Social Media Analysis. The KNIME node repository has a node for every functionality you can possibly think of and need while building a data mining model. One can execute different algorithms such as clustering and classification on a dataset and visualize the results inside the framework itself. It is a framework capable of giving insights on data and the phenomenon that the data represent.

Some commonly used KNIME node groups include:

  • Input-Output or I/O:  Nodes in this group retrieve data from or to write data to external files or data bases.
  • Data Manipulation: Used for data pre-processing tasks. Contains nodes to filter, group, pivot, bin, normalize, aggregate, join, sample, partition, etc.
  • Views: This set of nodes permit users to inspect data and analysis results using multiple views. This gives a means for truly interactive exploration of a data set.
  • Data Mining: In this group, there are nodes that implement certain algorithms (like K-means clustering, Decision Trees, etc.)

Comparison with other tools 

The first version of the KNIME Analytics Platform was released in 2006 whereas Weka and R studio were released in 1997 and 1993 respectively. KNIME is a proper data mining tool whereas Weka and R studio are Machine Learning tools which can also do data mining. KNIME integrates with Weka to add machine learning algorithms to the system. The R project adds statistical functionalities as well. Furthermore, KNIME’s range of functions is impressive, with more than 1,000 modules and ready-made application packages. The modules can be further expanded by additional commercial features.