A Gentle Introduction to Precision and Recall.
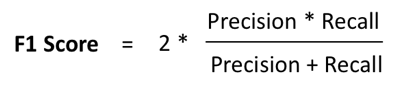
The idea of this blog is to give an intuitive understanding of Precision and Recall for a binary classification problem. I will shy away from explaining it in a textbook way but rather will try to give an intuition. Nevertheless, let me write the textbook formula first:
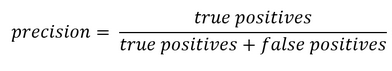
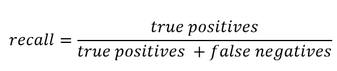
The problem with this nomenclature is that despite being correct, it can be a bit confusing, especially for beginners. For example ‘False Positives’ could be understood from a classifier point of view or from a population point of view.
Visualizing with an example
Let’s suppose we have a classifier to differentiate jeans from a T-shirts in a lot of cloths. This lot has 100 pieces altogether with 70 jeans and 30 T-shirts. Let us see this visually. Until this point, we just have a collection of clothes and have no classifier.
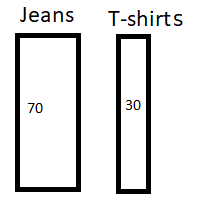
We already know that altogether we truly have 70 Jeans and 30 T-shirts.
Now let’s run the classifier to identify the jeans from T-shirts. We can assume the result of the classifier is following (number inside the box is the result of classifier):
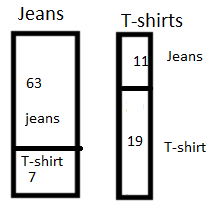
We see that out of 70 jeans the classifier identifies 63 correctly as jeans and the remaining 7 as non-Jeans. Out of 30 T-shirts, the classifier identifies 11 falsely as jeans the remaining 19 correctly as non-Jeans.
So Recall is nothing but the proportion of identified jeans out of total jeans, which is
Recall = 63 / 70
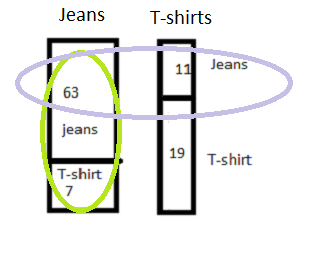
Precision is the true jeans identified out of the total number of classified jeans. Which is:
Precision = 63 / (63+11)
Hence we see, in a way Recall has to do with the ability of classifier to deal with jeans and precision has to do with ability to deal with both Jeans and Non-Jeans.
This seems to provide better intuition than the textbook formula.
Diving Deeper with another example
Let us go through one more example to cement the idea. Let’s imagine there is a village which has a notoriously high number of criminals. A special cop arrives to tackle the law and order situation. He interviews every resident and locks some residents based on hunches.
If there are still many criminals roaming on the street the recall is bad, as recall deals with the ability to deal with the quantity which classifier is supposed to find (in this case criminals).
If there are too many innocents rotting in jail the precision is bad. As precision has also to do with the ability to deal with ‘others‘ that is not the quantity which the classifier is supposed to find (in this case these are the innocents).
Now we see, we don’t want too many criminals roaming on the street nor do we want many innocents rotting in the jail. Hence we need both recall and precision to be high or in other words, their mean to be high. But this cannot be arithmetic mean. Let’s see why using an example.
If for a village of 2000 residents there are 100 criminals. And if the cop straight away locks all 2000 residents, the confusion matrix looks like this:
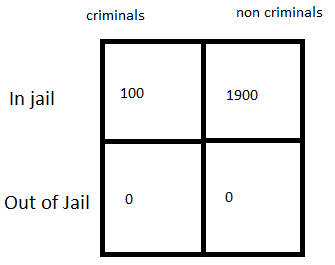
Recall= 100/ (100+0) = 1
Precision = 100/ (100+1900) = 0.05
Arithmetic mean for Precision and Recall = (1+.05)/2 = 0.525
This would look like a pretty good classifier even though we know that in reality it’s a bad classifier (or a bad cop who just locks up every person he meets). It can be shown that the same happens in reverse. If the cop does not lock up anyone, the arithmetic mean does not show the true picture again.
That’s why we use harmonic mean. We call it F1 Score and it is calculated as follows: (2 * 1 * 0.05) / (1 + 0.05) = 0.0952
Now, this looks like a more realistic score. So, the performance of a classifier can be judged with a harmonic mean between precision and recall.
Let’s try to understand one more thing.
Often, classifiers work by returning probabilities of positives and negatives. One way to turn them into a confusion matrix is to use a threshold of 0.5. This means that if the probability of being positive is more than 0.5, we consider the case as positive (in our case a criminal). Otherwise, it is a negative.
But there might be cases where we want our recall to be very high. For example, if there is a classifier for identifying Ebola. We do not want any of the cases to be missed because otherwise we are risking an outbreak of the decease with disastrous consequences.
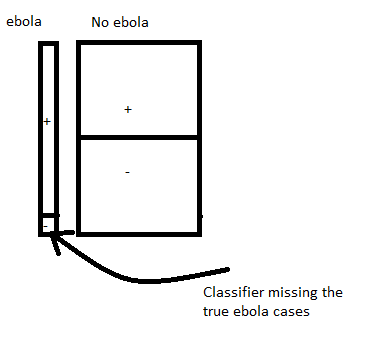
In this case, the threshold needs to be kept really low (maybe near .1 or smaller) so that we raise a flag for every case that has at least 10 % probability and get this person retested. This is an important measure in order to prevent an outbreak, despite the fact that there are a lot of false cases that needs to be rechecked.
There might be other cases where there are many false alarms (maybe fraud transaction in banks) which may be of low risk and it would be expensive to investigate all those cases. In those case, we might want to have a threshold higher than 0.5.
This gives us a taste of things to come. A classifiers efficiency can be plotted for different thresholds which gives us something called a ROC curve. But let’s save that for another post.