Tag Archive for: ETL

Mainframe Modernization: Making It Happen

In the fast-paced world of technology and business, it can be hard to keep up with what’s new. What’s new today can be obsolete in a few weeks, and adapting to this ever-changing landscape can become a challenge if an organization isn’t well prepared or equipped. Modernization of systems doesn’t necessarily mean transitioning to an entirely new system or platform; often, all it takes is actual modernization of existing tools to help them adapt to new business demands and requirements.

The mainframe is one system that has stood the test of time. A number of naysayers taut the system as “legacy” or obsolete, but the fact that mainframes handle 68% of the world’s production IT workloads indicate otherwise. Mainframes are proof that the latest isn’t always the greatest, standing firm as one of the foundations of business systems in today’s most successful businesses around the world. What some don’t realize is that the race toward digital transformation is not reliant on the system or platform an organization has in place; digital transformation initiatives rise and fall depending on how they approach data. Regardless of the platform used, data analysts who work with irrelevant or stale data are prone to achieve false or misleading results. Access to real-time data is key, and data gathered days or hours—even minutes—ago isn’t a current representation of the current situation. This can lead to an organization acting on miscalculations and opportunities that no longer exist. Actionable insights need to come from real-time data to ensure that your organization can make sound business decisions in a timely manner.

The Old vs. the New

Conventional methodologies have kept mainframe data and real-time data separate due to issues with accessibility. Most businesses traditionally use Extract, Transform, and Load (ETL) processes for data analysis, a logistically complex and time-consuming process that’s prone to errors and stale data because it’s performed only periodically. This can lead to hours or even weeks of delay that’s simply unacceptable in today’s always-connected, always-on digital business landscape. Today’s businesses depend largely on real-time business intelligence—and access to it—to get a competitive edge.

In light of this perceived separation between mainframes and real-time data analytics, data scientists have found that the creation of analytic models can be too slow at times due to the conventional process of offloading data from the mainframe to other platforms for analysis. Organizations should move away from ETL processes and find ways to make real-time data analytics from the mainframe quicker and more efficient for their business. Mainframe modernization is key in making mainframe systems work with modern solutions because it allows for data virtualization, integrating all disparate enterprise data into a logical data layer. This layer manages the unified data and provides centralized governance while delivering the required data in real-time to business users.

Depending on the industry, mainframe modernization can optimize key business processes like order processing, payment gateways, and internal business operations queries. Mainframes are known for performing high-volume transaction processing, and these transactions can make or break a business. Managed in real-time, it will help organizations battle fraud and manage business risks as they arise, or even before they do. The data gathered can also help paint a more accurate representation of who a company’s customers are, allowing them to better plan resources and come up with more personalized initiatives.

Making IT Happen

Mainframe modernization is a major undertaking that presents a host of options for every organization. These options will vary depending on a number of factors, including business size, tenure, and industry. The following, however, are a few of the key considerations in modernization.

  • Look for quick wins
    As all businesses know by now, time is of the essence in every undertaking, even mainframe modernization. Its success is dependent on how quickly it can deliver the desired results.
  • Automate migration to avoid disruption
    Accelerating modernization efforts means leveraging modern tools API’s. The platforms available today are designed to minimize the effects of the modernization process if not avoid disruption completely.
  • Focus on total cost of ownership (TCO)
    It’s a mistake to view the initial cost of modernization at face value. Amore accurate view of costs involves a focus on the total cost of ownership. Calculating the TCO, or the purchase costs plus operation costs, will help minimize it even before modernization initiatives commence.
  • Don’t just leave everything to IT
    The modern IT team is one that includes everyone in the organization. Mainframe modernization is more a business initiative than an IT concern, and as such, should involve decision makers and business leaders. System integrations and updates remain the responsibility of IT specialists, but choosing the appropriate modernization approach and ensuring that the initiative succeeds should be a responsibility shared by the entire organization.
  • Create business value
    Mainframe modernization isn’t simply the implementation of technology upgrades or migration to a new system; it should also be an opportunity to combine the old with the new. Improve existing business processes or create new ones accordingly while capturing institutional knowledge from mainframe systems to gain a competitive edge.

Options abound when it comes to mainframe modernization, but that doesn’t mean that you should apply them all or choose the latest and greatest. Choosing the right approach to modernization entails re-examining your business and its goals and deciding which solution will take you there—and take you there fast. There exists an “imaginary” gap between digital innovators and mainframes because of the challenges and costs in data accessibility and system availability. The goal of mainframe modernization is to bridge this gap in the best, and fastest, way possible.

Web Scraping Using R..!

In this blog, I’ll show you, How to Web Scrape using R..?

What is R..?

R is a programming language and its environment built for statistical analysis, graphical representation & reporting. R programming is mostly preferred by statisticians, data miners, and software programmers who want to develop statistical software.

R is also available as Free Software under the terms of the Free Software Foundation’s GNU General Public License in source code form.

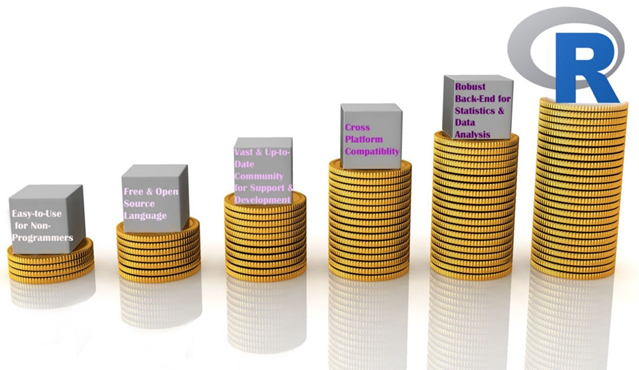
Reasons to choose R

Reasons to choose R

Let’s begin our topic of Web Scraping using R.

Step 1- Select the website & the data you want to scrape.

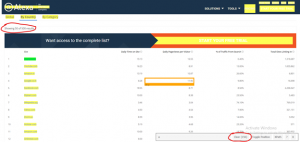
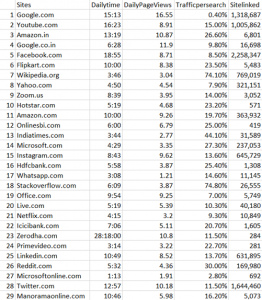
I picked this website “https://www.alexa.com/topsites/countries/IN” and want to scrape data of Top 50 sites in India.

Data we want to scrape

Data we want to scrape

Step 2- Get to know the HTML tags using SelectorGadget.

In my previous blog, I already discussed how to inspect & find the proper HTML tags. So, now I’ll explain an easier way to get the HTML tags.

You have to go to Google chrome extension (chrome://extensions) & search SelectorGadget. Add it to your browser, it’s a quite good CSS selector.

Step 3- R Code

Evoking Important Libraries or Packages

I’m using RVEST package to scrape the data from the webpage; it is inspired by libraries like Beautiful Soup. If you didn’t install the package yet, then follow the code in the snippet below.

Step 4- Set the url of the website

Step 5- Find the HTML tags using SelectorGadget

It’s quite easy to find the proper HTML tags in which your data is present.

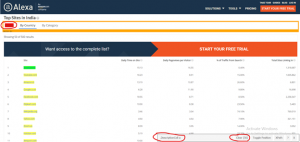
Firstly, I have to click on data using SelectorGadget which I want to scrape, it automatically selects the data which are similar to selected HTML tags. Before going forward, cross-check the selected values, are they correct or some junk data is also gets selected..? If you noticed our page has only 50 values, but you can see 156 values are selected.

Selection by SelectorGadget

Selection by SelectorGadget

So I need to remove unwanted values who get selected, once you click on them to deselect it, it turns red and others will turn yellow except our primary selection which turn to green. Now you can see only 50 values are selected as per our primary requirement but it’s not enough. I have to again cross-check that some required values are not exchanged with junk values.

If we satisfy with our selection then copy the HTML tag & include it into the code, else repeat this exercise.

Modified Selection by SelectorGadget

Step 6- Include the tag in our Code

After including the tags, our code is like this.

Code Snippet

If I run the code, values in each list object will be 50.

Data Stored in List Objects

Step 7- Creating DataFrame

Now, we create a dataframe with our list-objects. So for creating a dataframe, we always need to remember one thumb rule that is the number of rows (length of all the lists) should be equal, else we get an error.

Error appears when number of rows differs

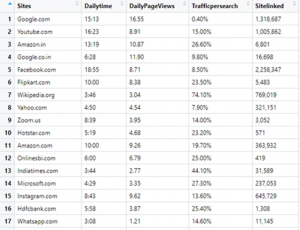
Finally, Our DataFrame will look like this:

Our Final Data

Step 8- Writing our DataFrame to CSV file

We need our scraped data to be available locally for further analysis & model building or other purposes.

Our final piece of code to write it in CSV file is:

Writing to CSV file

Step 9- Check the CSV file

Data written in CSV file

Conclusion-

I tried to explain Web Scraping using R in a simple way, Hope this will help you in understanding it better.

Find full code on

https://github.com/vgyaan/Alexa/blob/master/webscrap.R

If you have any questions about the code or web scraping in general, reach out to me on LinkedIn!

Okay, we will meet again with the new exposer.

Till then,

Happy Coding..!

Determining Your Data Pipeline Architecture and Its Efficacy

Data analytics has become a central part of how many businesses operate. If you hope to stay competitive in today’s market, you need to take advantage of all your available data. For that, you’ll need an efficient data pipeline, which is often easier said than done.

If your pipeline is too slow, your data will be all but useless by the time it’s usable. Successful analytics require an optimized pipeline, and that looks different for every company. No matter your specific circumstances, though, a traditional approach will result in inefficiencies.

Creating the most efficient pipeline architecture will require you to change how you look at the process. By understanding each stage’s role and how they serve your goals, you can optimize your data analytics.

Understanding Your Data Needs

You can’t build an optimal data pipeline if you don’t know what you need from your data. If you spend too much time collecting and organizing information you won’t use, you’ll take time away from what you need. Similarly, if you only work to meet one team’s needs, you’ll have to go back and start over to help others.

Data analytics involves multiple stakeholders, all with individual needs and expectations that you should consider. Your data engineers need your pipeline to be accessible and scalable, while analysts require visual, relevant datasets. If you consider these aspects from the beginning, you can build a pipeline that works for everyone.

Start at the earliest stage — collection. You may be collecting data from every channel you can, which could result in an information overload. Focus instead on gathering things from the most relevant sources. At the same time, ensure you can add more channels if necessary in the future.

As you reorganize your pipeline, remember that analytics are only as good as your datasets. If you put more effort into organizing and scrubbing data, helpful analytics will follow. Focus on preparing data well, and the last few stages will be smoother.

Creating a Collaborative Pipeline

When structuring your pipeline, it’s easy to focus too much on the individual stages. While seeing things as rigid steps can help you visualize them, you need something more fluid in practice. If you want the process to run as smoothly as possible, it needs to be collaborative.

Look at the software development practice of DevOps, which doubles a team’s likelihood of exceeding productivity goals. This strategy focuses on collaboration across separate teams instead of passing things back and forth between them. You can do the same thing with your data pipeline.

Instead of dividing steps between engineers and analysts, make it a single, cohesive process. Teams will still focus on different areas according to their expertise, but they’ll reduce disruption by working together instead of independently. If workers can collaborate along every step, they don’t have to go back and forth.

Simultaneously, everyone should have clearly defined responsibilities. Collaboration doesn’t mean overstepping your areas of expertise. The goal here isn’t to make everyone handle everything but to ensure they understand each other’s needs.

Eliminating the time between steps also applies to your platform. Look for or build software that integrates both refinement and data preparation. If you have to export data to various programs, it will cause unnecessary bottlenecks.

Enabling Continuous Improvement

Finally, understand that restructuring your data pipeline isn’t a one-and-done job. Another principle you can adopt from DevOps is continuous development across all sides of the process. Your engineers should keep looking for better ways to structure data as your analysts search for new applications for this information.

Make sure you always measure your throughput and efficiency. If you tweak something and you notice the process starts to slow, revert to the older method. If your changes improve the pipeline, try something similar in another area.

Optimize Your Data Pipeline

Remember to start slow when optimizing your data pipeline. Changing too much at once can cause more disruptions than it avoids, so start small with an emphasis on scalability.

The specifics of your pipeline will vary depending on your needs and circumstances. No matter what these are, though, you can benefit from collaboration and continuous development. When you start breaking down barriers between different steps and teams, you unclog your pipeline.

How the Pandemic is Changing the Data Analytics Outsourcing Industry

While media pundits have largely focused on the impact of COVID-19 as far as human health is concerned, it hasn’t been particularly good for the health of automated systems either. As cybersecurity budgets plummet in the face of dwindling finances, computer criminals have taken the opportunity to increase attacks against high value targets.

In June, an online antique store suffered a data breach that contained over 3 million records, and it’s likely that a number of similar attacks have simply gone unpublished. Fortunately, data scientists are hard at work developing new methods of fighting back against these kinds of breaches. Budget constraints and a lack of personnel as a result of the pandemic continues to be a problem, but automation has helped to assuage the issue to some degree.

AI-Driven Data Storage Systems

Big data experts have long promoted the cloud as an ideal metaphor for the way that data is stored remotely, but as a result few people today consider the physical locations that this information is stored at. All data has to be located on some sort of physical storage device. Even so-called serverless apps have to be distributed from a server unless they’re fully deployed using P2P services.

Since software can never truly replace hardware, researchers are looking at refining the various abstraction layers that exist between servers and the clients who access them. Data warehousing software has enabled computer scientists to construct centralized data storage solutions that look like traditional disk locations. This gives users the ability to securely interact with resources that are encrypted automatically.

Background services based on artificial intelligence monitor virtual data warehouse locations, which gives specialists the freedom to conduct whatever analytics they deem necessary. In some cases, a data warehouse can even anonymize information as it’s stored, which can streamline workflows involved with the analysis process.

While this level of automation has proven useful, it’s still subject to some of the problems that have occurred as a result of the pandemic. Traditional supply chains are in shambles and a large percentage of technical workers are now telecommuting. If there’s a problem with any existing big data plans, then there’s often nobody around to do any work in person.

Living with Shifting Digital Priorities

Many businesses were in the process of outsourcing their data operations even before the pandemic, and the current situation is speeding this up considerably. Initial industry estimates had projected steady growth numbers for the data analytics sector through 2025. While the current figures might not be quite as bullish, it’s likely that sales of outsourcing contracts will remain high.

That being said, firms are also shifting a large percentage of their IT spending dollars into cybersecurity projects. A recent survey found that 37 percent of business leaders said they were already going to cut their IT department budgets. The same study found that 28 percent of businesses are going to move at least some part of their data analytics programs abroad.

Those companies that can’t find an attractive outsourcing contract might start to patch their remote systems over a virtual private network. Unfortunately, this kind of technology has been strained to some degree in recent months. The virtual servers that power VPNs are flooded with requests, which in turn has brought them down in some instances. Neural networks, which utilize deep learning technology to improve themselves as time goes on, have proven more than capable of predicting when these problems are most likely to arise.

That being said, firms that deploy this kind of technology might find that it still costs more to work with automated technology on-premise compared to simply investing in an outsourcing program that works with these kinds of algorithms at an outside location.

Saving Money in the Time of Corona

Experts from Think Big Analytics pointed out how specialist organizations can deal with a much wider array of technologies than a small business ever could. Since these companies specialize in providing support for other organizations, they have a tendency to offer support for a large number of platforms.

These representatives recently opined that they could provide support for NoSQL, Presto, Apache Spark and several other emerging platforms at the same time. Perhaps most importantly, these organizations can work with Hadoop and other traditional data analysis languages.

Staffers working on data mining operations have long relied on languages like Hadoop and R to write scripts that they later use to automate the process of collecting and analyzing data. By working with an organization that already supports a language that companies rely on, they can avoid the need of changing up their existing operations.

This can help to drastically reduce the cost of migration, which is extremely important since many of the firms that need to migrate to a remote system are already suffering from budget problems. Assuming that some issues related to the pandemic continue to plague businesses for some time, it’s likely that these budget constraints will force IT departments to consider a migration even if they would have otherwise relied solely on a traditional colocation arrangement.

IT department staffers were already moving away from many rare platforms even before the COVID-19 pandemic hit, however, so this shouldn’t be as much of a herculean task as it sounds. For instance, the KNIME Analytics Platform has increased in popularity exponentially since it’s release in 2006. The fact that it supports over 1,000 plug-in modules has made it easy for smaller businesses to move toward the platform.

The road ahead isn’t going to be all that pleasant, however. COBOL and other antiquated languages still rule the roost at many governmental big data processing centers. At the same time, some small businesses have never even been able to put a big data plan into play in the first place. As the pandemic continues to wreak havoc on the world’s economy, however, it’s likely that there will be no shortage of organizations continuing to migrate to more secure third-party platforms backed by outsourcing contracts.

Simplify Vendor Onboarding with Automated Data Integration

Vendor onboarding is a key business process that involves collecting and processing large data volumes from one or multiple vendors. Business users need vendor information in a standardized format to use it for subsequent data processes. However, consolidating and standardizing data for each new vendor requires IT teams to write code for custom integration flows, which can be a time-consuming and challenging task.

In this blog post, we will talk about automated vendor onboarding and how it is far more efficient and quicker than manually updating integration flows.

Problems with Manual Integration for Vendor Onboarding

During the onboarding process, vendor data needs to be extracted, validated, standardized, transformed, and loaded into the target system for further processing. An integration task like this involves coding, updating, and debugging manual ETL pipelines that can take days and even weeks on end.

Every time a vendor comes on board, this process is repeated and executed to load the information for that vendor into the unified business system. Not just this, but because vendor data is often received from disparate sources in a variety of formats (CSV, Text, Excel), these ETL pipelines frequently break and require manual fixes.

All this effort is not suitable, particularly for large-scale businesses that onboard hundreds of vendors each month. Luckily, there is a faster alternative available that involves no code-writing.

Automated Data Integration

The manual onboarding process can be automated using purpose-built data integration tools.

To help you better understand the advantages, here is a step-by-step guide on how automated data integration for vendor onboarding works:

  1. Vendor data is retrieved from heterogeneous sources such as databases, FTP servers, and web APIs through built-in connectors available in the solution.
  2. The data from each file is validated by passing it through a set of predefined quality rules – this step helps in eliminating records with missing, duplicate, or incorrect data.
  3. Transformations are applied to convert input data into the desired output format or screen vendors based on business criteria. For example, if the vendor data is stored in Excel sheets and the business uses SQL Server for data storage, then the data has to be mapped to the relevant fields in the SQL Server database, which is the destination.
  4. The standardized, validated data is then loaded into a unified enterprise database that you can use as the source of information for business processes. In some cases, this can be a staging database where you can perform further filtering and aggregation to build a consolidated vendor database.
  5. This entire ETL pipeline (Step 1 through Step 4) can then be automated through event-based or time-based triggers in a workflow. For instance, you may want to run the pipeline once every day, or once a new file/data point is available in your FTP server.

Why Build a Consolidated Database for Vendors?

Once the ETL pipeline runs, you will end up with a consolidated database with complete vendor information. The main benefit of having a unified database is that it would have filtered information regarding vendors.

Most businesses have a strict process for screening vendors that follows a set of predefined rules. For example, you may want to reject vendors that have a poor credit history automatically. With manual data integration, you would need to perform this filtering by writing code. Automated data integration allows you to apply pre-built filters directly within your ETL pipeline to flag or remove vendors with a credit score lower than the specified threshold.

This is just one example; you can perform a wide range of tasks at this level in your ETL pipeline including vendor scoring (calculated based on multiple fields in your data), filtering (based on rules applied to your data), and data aggregation (to add measures to your data) to build a robust vendor database for decision-making and subsequent processes.

Conclusion

Automated vendor onboarding offers cost-and-time benefits to your organization. Making use of enterprise-grade data integration tools ensures a seamless business-to-vendor data exchange without the need for reworking and upgrading your ETL pipelines.