Geschriebene Artikel über Big Data Analytics

Scaling Up Your Process Management

Any new business faces questions: have we found the right product/market fit? Does the business model work? Have we got enough money to keep the doors open? Typically, new businesses are focused on staying afloat, meaning anything that isn’t immediately relevant to that goal is left until later—whenever that might be!   


Read this article in German:

Machen Sie mehr aus Ihrem Prozessmanagement


However, most businesses soon realize that staying afloat means finding the most efficient way to deliver their products or services to customers. As a result, the way a business functions starts to move into focus, with managers and staff looking to achieve the same outcome, in the same way, over and over. The quickest route to this? Establishing efficient processes. 

Once a business has clarified the responsibilities of all staff, and identified their business process framework, they are better able to minimize waste and errors, avoid misunderstandings, reduce the number of questions asked during the day-to-day business, and generally operate more smoothly and at a greater pace.

Expanding your business with process management

Of course, no new business wants to remain new for long—becoming firmly established is the immediate goal, with a focus on expansion to follow, leading to new markets, new customers, and increased profitability. Effectively outlining processes takes on even more importance when companies seek to expand. Take recruitment and onboarding, for example. 

Ad hoc employment processes may work for a start-up, but a small business looking to take the next step needs to introduce new staff members frequently and ensure they have the right information to get started immediately. The solution is a documented, scalable, and repeatable process that can be carried out as many times as needed, no matter the location or the role being filled. 

When new staff are employed, they’ll need to know how their new workplace actually functions. Once again, a clear process framework means all the daily processes needed are accessible to all staff, no matter where the employee is based. As the business grows, more and more people will come on board, each with their own skills, and very likely their own ideas and suggestions about how the business could be improved… 

Collaborative process management

Capturing the wisdom of the crowd is also a crucial factor in a successful business—ensuring all employees have a chance to contribute to improving the way the company operates. In a business with an effective process modeling framework, this means providing all staff with the capability to design and model processes themselves. 

Traditionally, business process modeling is a task for the management or particular experts, but this is an increasingly outdated view. Nobody wants to pass up the valuable knowledge of individuals; after all, the more knowledge there is available about a process, the more efficiently the processes can be modeled and optimized. Using a single source of process truth for the entire organization means companies can promote collaborative and transparent working environments, leading to happier staff, more efficient work, and better overall outcomes for the business. 

Collaborative process management helps to grow organizations avoid cumbersome, time-consuming email chains, or sifting through folders for the latest version of documents, as well as any number of other hand brakes on growth. 

Instead, process content can be created and shared by anyone, any time, helping drive a company’s digital and cloud strategies, enhance investigations and process optimization efforts, and support next-gen business transformation initiatives. In short, this radical transparency can serve as the jumping-off point for the next stage of a company’s growth. 

Want to find out more about professional process management? Read our White Paper 7-Step Guide to Effective Business Transformation!

Seeing the Big Picture: Combining Enterprise Architecture with Process Management

Ever tried watching a 3D movie without those cool glasses people like to take home? Two hours of blurred flashing images is no-one’s idea of fun. But with the right equipment, you get an immersive experience, with realistic, clear, and focused images popping out of the screen. In the same way, the right enterprise architecture brings the complex structure of an organization into focus.

We know that IT environments in today’s modern businesses consist of a growing number of highly complex, interconnected, and often difficult-to-manage IT systems. Balancing customer service and efficiency imperatives associated with social, mobile, cloud, and big data technologies, along with effective day-to-day IT functions and support, can often feel like an insurmountable challenge.

Enterprise architecture can help organizations achieve this balance, all while managing risk, optimizing costs, and implementing innovations. Its main aim is to support reform and transformation programs. To do this, enterprise architecture relies on the accuracy of an enterprise’s complex data systems, and takes into account changing standards, regulations, and strategic business demands.

Components of effective enterprise architecture

In general, most widely accepted enterprise architecture frameworks consist of four interdependent domains:

  • Business Architecture

A blueprint of the enterprise that provides a common understanding of the organization, and used to align strategic objectives and tactical demands. An example would be representing business processes using business process management notation.

  • Data Architecture

The domain that shows the dependencies and connections between an organization’s data, rules, models, and standards.

  • Applications Architecture

The layer that shows a company’s complete set of software solutions and their relationships with each other.

  • Infrastructure Architecture

Positioned at the lowest level, this component shows the relationships and connections of an organization’s existing hardware solutions.

Effective EA implementation means employees within a business can build a clear understanding of the way their company’s IT systems execute their specific work processes, as well as how they interact and relate to each other. It allows users to identify and analyze application and business performance, with the goal of enabling underperforming IT systems to be promptly and efficiently managed.

In short, EA helps businesses answer questions like:

  • Which IT systems are in use, and where, and by whom?
  • Which business processes relate to which IT systems?
  • Who is responsible for which IT systems?
  • How well are privacy protection requirements upheld?
  • Which server is each application run on?

The same questions, shifted slightly to refer to business processes rather than IT systems, are what drive enterprise-level business process management as well. Is it any wonder the two disciplines go together like popcorn and a good movie?

Combining enterprise architecture with process management

Successful business/IT alignment involves effectively leveraging an organization’s IT to achieve company goals and requirements. Standardized language and images (like flow charts and graphs) are often helpful in fostering mutual understanding between highly technical IT services and the business side of an organization.

In the same way, combining EA with collaborative business process management establishes a common language throughout a company. Once this common ground is established, misunderstandings can be avoided, and the business then has the freedom to pursue organizational or technical transformation goals effectively.

At this point, strengthened links between management, IT specialists, and a process-aware workforce mean more informed decisions become the norm. A successful pairing of process management, enterprise architecture, and IT gives insight into how changes in any one area impact the others, ultimately resulting in a clearer understanding of how the organization actually functions. This translates into an easier path to optimized business processes, and therefore a corresponding improvement in customer satisfaction.

Effective enterprise architecture provides greater transparency inside IT teams, and allows for efficient management of IT systems and their respective interfaces. Along with planning continual IT landscape development, EA supports strategic development of an organization’s structure, just as process management does.

Combining the two leads to a quantum leap in the efficiency and effectiveness of IT systems and business processes, and locks them into a mutually-reinforcing cycle of optimization, meaning improvements will continue over time. Both user communities can contribute to creating a better understanding using a common tool, and the synergy created from joining EA and business process management adds immediate value by driving positive changes company-wide.

Want to find out more? Put on your 3D glasses, and test your EA initiatives with Signavio! Sign up for your free 30-day trial of the Signavio Business Transformation Suite today.

AI For Advertisers: How Data Analytics Can Change The Maths Of Advertising?

All Images Credit: Freepik

The task of understanding a customer’s journey and designing your marketing strategy accordingly can be difficult in this data-driven world. Today, the customer expresses their needs in myriad forms of requests.

Consumers express their needs and want attitudes, and values in various forms through search, comments, blogs, Tweets, “likes,” videos, and conversations and access such data across many channels like web, mobile, and face to face. Volume, variety, velocity and veracity of the data accumulated through these customer interactions are huge.

BigData and data analytics can be leveraged to understand several phases of the customer journey. There are risks involved in using Artificial Intelligence for the marketing data analysis of data breach and even manipulation. But, AI do have brighter prospects when it comes to marketing and advertiser applications.

As the CEO of a technology firm Chop Dawg and marketer, Joshua Davidson puts it, “AI-powered apps are going to be the future for us, and there are several industries that are ripe for this.” The mobile-first strategy of many enterprises has powered the use of AI for digital marketing and developing technologies and innovations to power industries with intelligent systems.

How AI and Machine learning are affecting customer journeys?

Any consumer journey begins with the recognition of a problem and then stages like initial consideration, active evaluation, purchase, and postpurchase come through up till the consumer journey is over. The need for identifying the purchasing and need patterns of the consumers and finding the buyer personas to strategize the marketing for them.

Need and Want Recognition:

Identifying a need is quite difficult as it is the most initial level of a consumer’s journey and it is more on the category level than at a brand level. Marketers and advertisers are relying on techniques like market research, web analytics, and data mining to build consumer profiles and buyer’s persona for understanding the needs and influencing the purchase of products. AI can help identify these wants and needs in real-time as the consumers usually express their needs and wants online and help build profiles more quickly.

AI technologies offered by several firms help in consumer profiling. Firms like Microsoft offers Azure that crunches billions of data points in seconds to determine the needs of consumers. It then personalizes web content on specific platforms in real-time to align with those status-updates. Consumer digital footprints are evolving through social media status updates, purchasing behavior, online comments and posts. Ai tends to update these profiles continuously through machine learning techniques.

Initial Consideration:

A key objective of advertising is to insert a brand into the consideration set of the consumers when they are looking for deliberate offerings. Advertising includes increasing the visibility of brands and emphasize on the key reasons for consideration. Advertisers currently use search optimization, paid search advertisements, organic search, or advertisement retargeting for finding the consideration and increase the probability of consumer consideration.

AI can leverage machine learning and data analytics to help with search, identify and rank functions of consumer consideration that can match the real-time considerations at any specific time. Take an example of Google Adwords, it analyzes the consumer data and helps advertisers make clearer distinctions between qualified and unqualified leads for better targeting.

Google uses AI to analyze the search-query data by considering, not only the keywords but also context words and phrases, consumer activity data and other BigData. Then, Google identifies valuable subsets of consumers and more accurate targeting.

Active Evaluation: 

When consumers narrow it down to a few choices of brands, advertisers need to insert trust and value among the consumers for brands. A common technique is to identify the higher purchase consumers and persuade them through persuasive content and advertisement. AI can support these tasks using some techniques:

Predictive Lead Scoring: Predictive lead scoring by leveraging machine learning techniques of predictive analytics to allow marketers to make accurate predictions related to the intent of purchase for consumers. A machine learning algorithm runs through a database of existing consumer data, then recognize trends and patterns and after processing the external data on consumer activities and interests, creates robust consumer profiles for advertisers.

Natural Language Generation: By leveraging the image, speech recognition and natural language generation, machine learning enables marketers to curate content while learning from the consumer behavior in real-time scenarios and adjusts the content according to the profiles on the fly.

Emotion AI: Marketers use emotion AI to understand consumer sentiment and feel about the brand in general. By tapping into the reviews, blogs or videos they understand the mood of customers. Marketers also use emotion AI to pretest advertisements before its release. The famous example of Kelloggs, which used emotion AI to help devise an advertising campaign for their cereal, eliminating the advertisement executions whenever the consumer engagement dropped.

Purchase: 

As the consumers decide which brands to choose and what it’s worth, advertising aims to move them out of the decision process and push for the purchase by reinforcing the value of the brand compared with its competition.

Advertisers can insert such value by emphasizing convenience and information about where to buy the product, how to buy the product and reassuring the value through warranties and guarantees. Many marketers also emphasize on rapid return policies and purchase incentives.

AI can completely change the purchase process through dynamic pricing, which encompasses real-time price adjustments on the basis of information such as demand and other consumer-behavior variables, seasonality, and competitor activities.

Post-Purchase: 

Aftersales services can be improved through intelligent systems using AI technologies and machine learning techniques. Marketers and advertisers can hire dedicated developers to design intelligent virtual agents or chatbots that can reinforce the value and performance of a brand among consumers.

Marketers can leverage an intelligent technique known as Propensity modeling to identify the most valuable customers on the basis of lifetime value, likelihood of reengagement, propensity to churn, and other key performance measures of interest. Then advertisers can personalize their communication with these customers on the basis of these data.

Conclusion:

AI has shifted the focus of advertisers and marketers towards the customer-first strategies and enhanced the heuristics of customer engagement. Machine learning and IoT(Internet of Things) has already changed the way customer interact with the brands and this transition has come at a time when advertisers and marketers are looking for new ways to tap into the customer mindset and buyer’s persona.

All Images Credit: Freepik

Best machine learning algorithms you should know

Machine learning is a key technology tool businesses use to build tools that enhance their operations. To do that, they take advantage of machine learning algorithms that come in different shapes and sizes, servicing different purposes and working on different data sets. Choosing the right algorithm for the job is what makes machine learning and deep learning projects successful. That’s why being aware of all the different types of machine learning algorithms is so important – that’s how you get better results and build more advanced solutions.

Here’s an overview of the best machine learning algorithms you should know before starting your project.

What is meant by machine learning algorithms?

First things first, what is machine learning and how do algorithms fit into the picture? A machine learning (ML) algorithm is a process or set of procedures that allow a model to adapt to the data with a specific objective set as the goal.

An ML algorithm specifies how the data is transformed from the input to output, helping the model to learn the appropriate mapping from input to output. That model specifies the mapping functions and holds the parameters in place, while the machine learning algorithm updates the parameters to help the model match its goal.

What are the algorithms used in machine learning?

Algorithms can model problems in many different ways. The easiest way to differentiate between different ML algorithms is by comparing them by learning styles that they can adapt. Generally, machine learning algorithms can adapt to several learning styles that help to solve different problems.

Here are four learning styles in machine learning you need to know:

1 Supervised learning

In supervised learning, the input data serves as training data and comes with a known label or result – for example, the price at a time or spam/not-spam.

In this variant, the training process is critical for preparing a model that makes predictions and then is corrected when the predictions are wrong. The training process continues until the model achieves the appropriate level of accuracy. Classification and regression are examples of problems for this learning type.


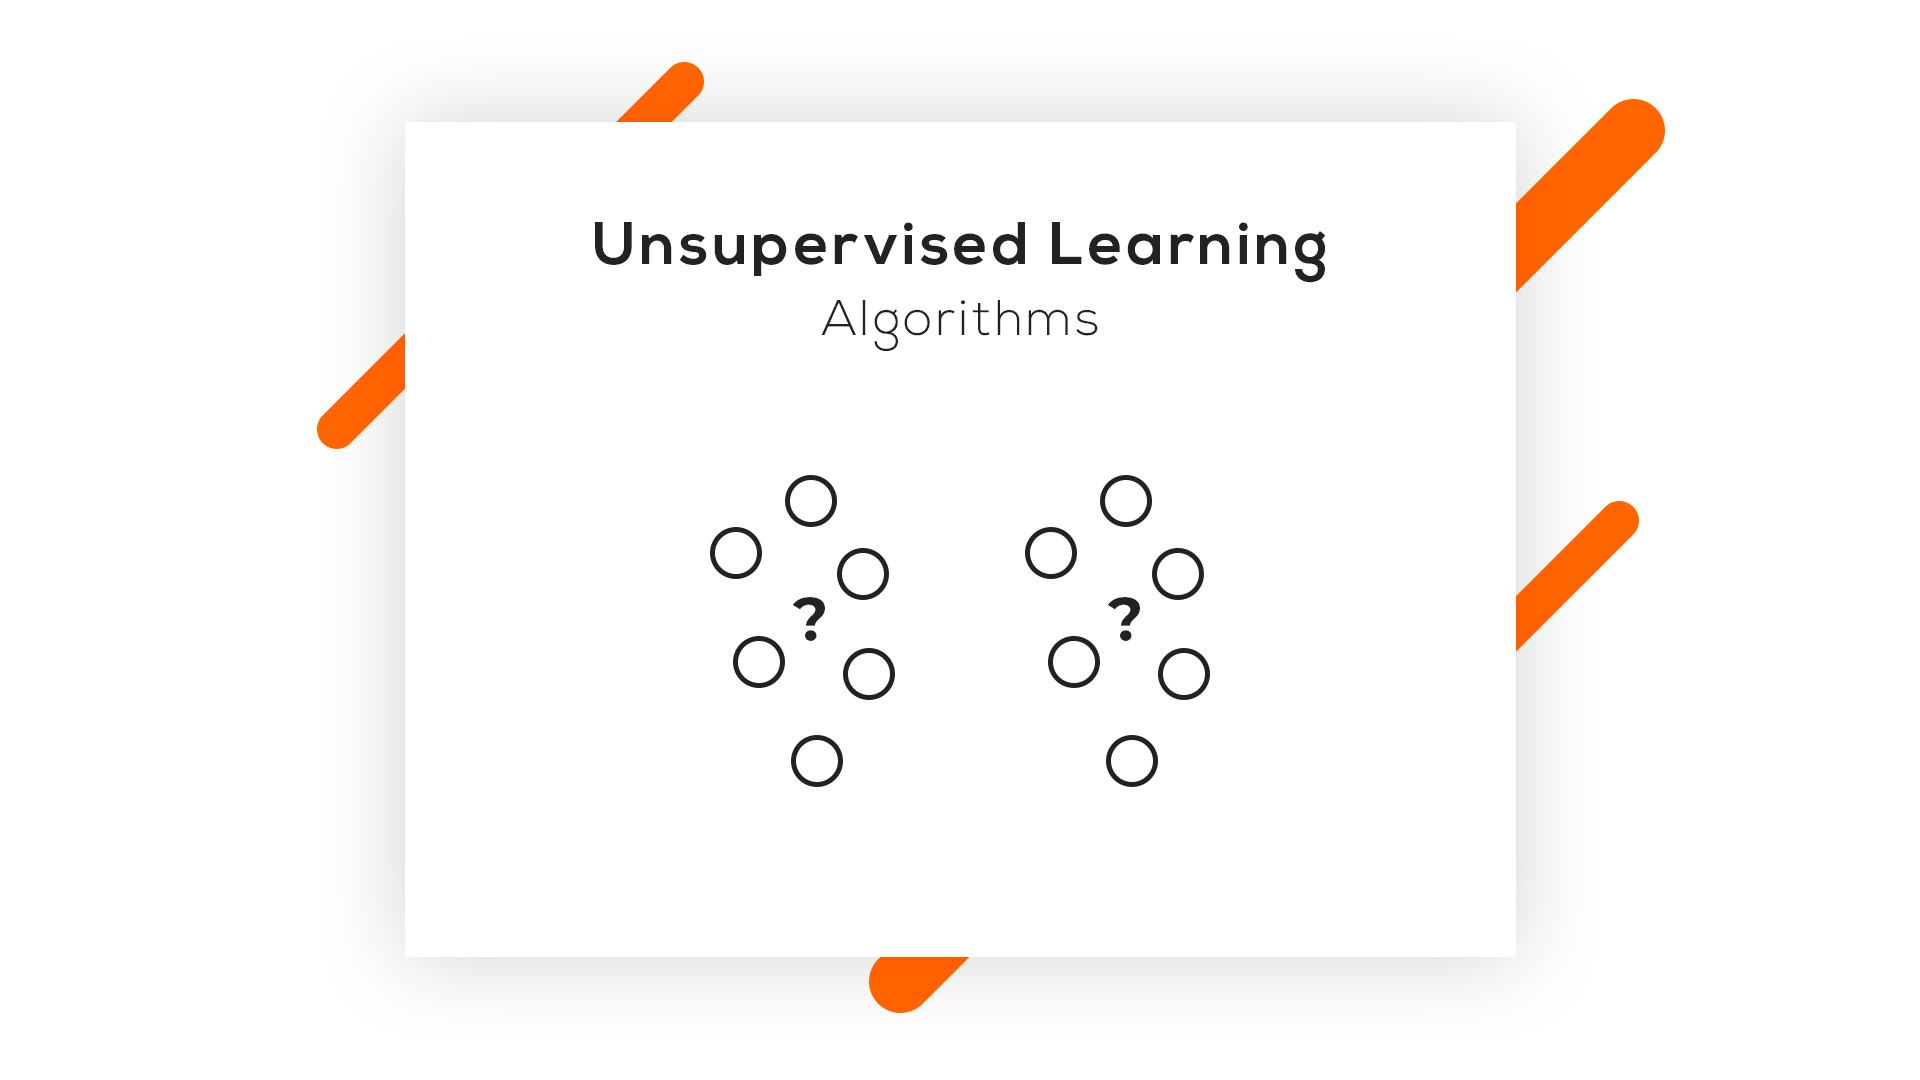
2 Unsupervised learning

In unsupervised learning, input data isn’t labeled and doesn’t come with a known result. Data scientists prepare models by deducing the structures in the input data to extract general rules or reduce redundancy through mathematical processes. Unsupervised learning addresses problems such as association rule learning, dimensionality reduction, and clustering.

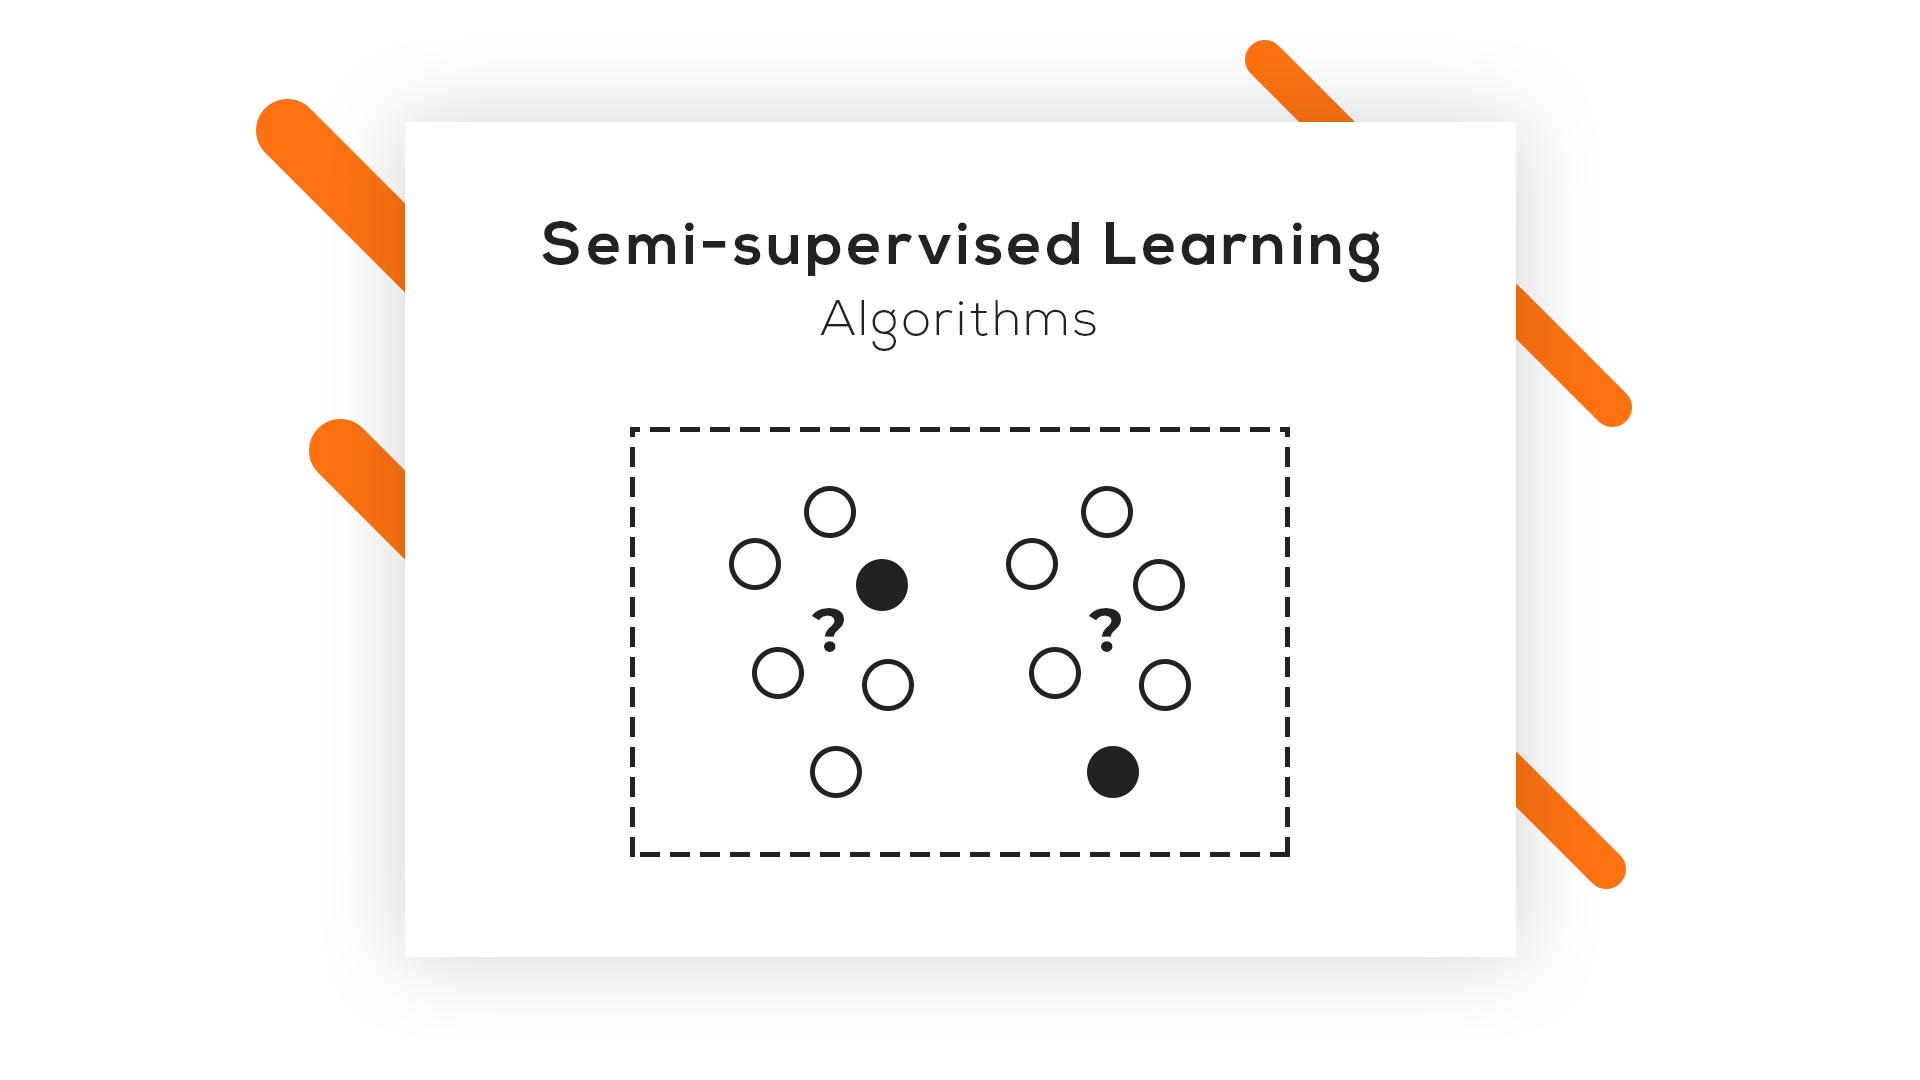
3 Semi-supervised learning

In this learning style, the input data is a mixture of labeled and unlabeled examples. The prediction problem is known, but the model needs to learn the structures for organizing data and making predictions on its own. This learning style is used to address problems such as regression and classification.

4 Reinforcement learning

One of three basic machine learning paradigms together with supervised learning and unsupervised learning, reinforcement learning (RL) is an area of machine learning that focuses on the ways in which software agents should take actions to maximize a specified notion of cumulative reward in a given environment.

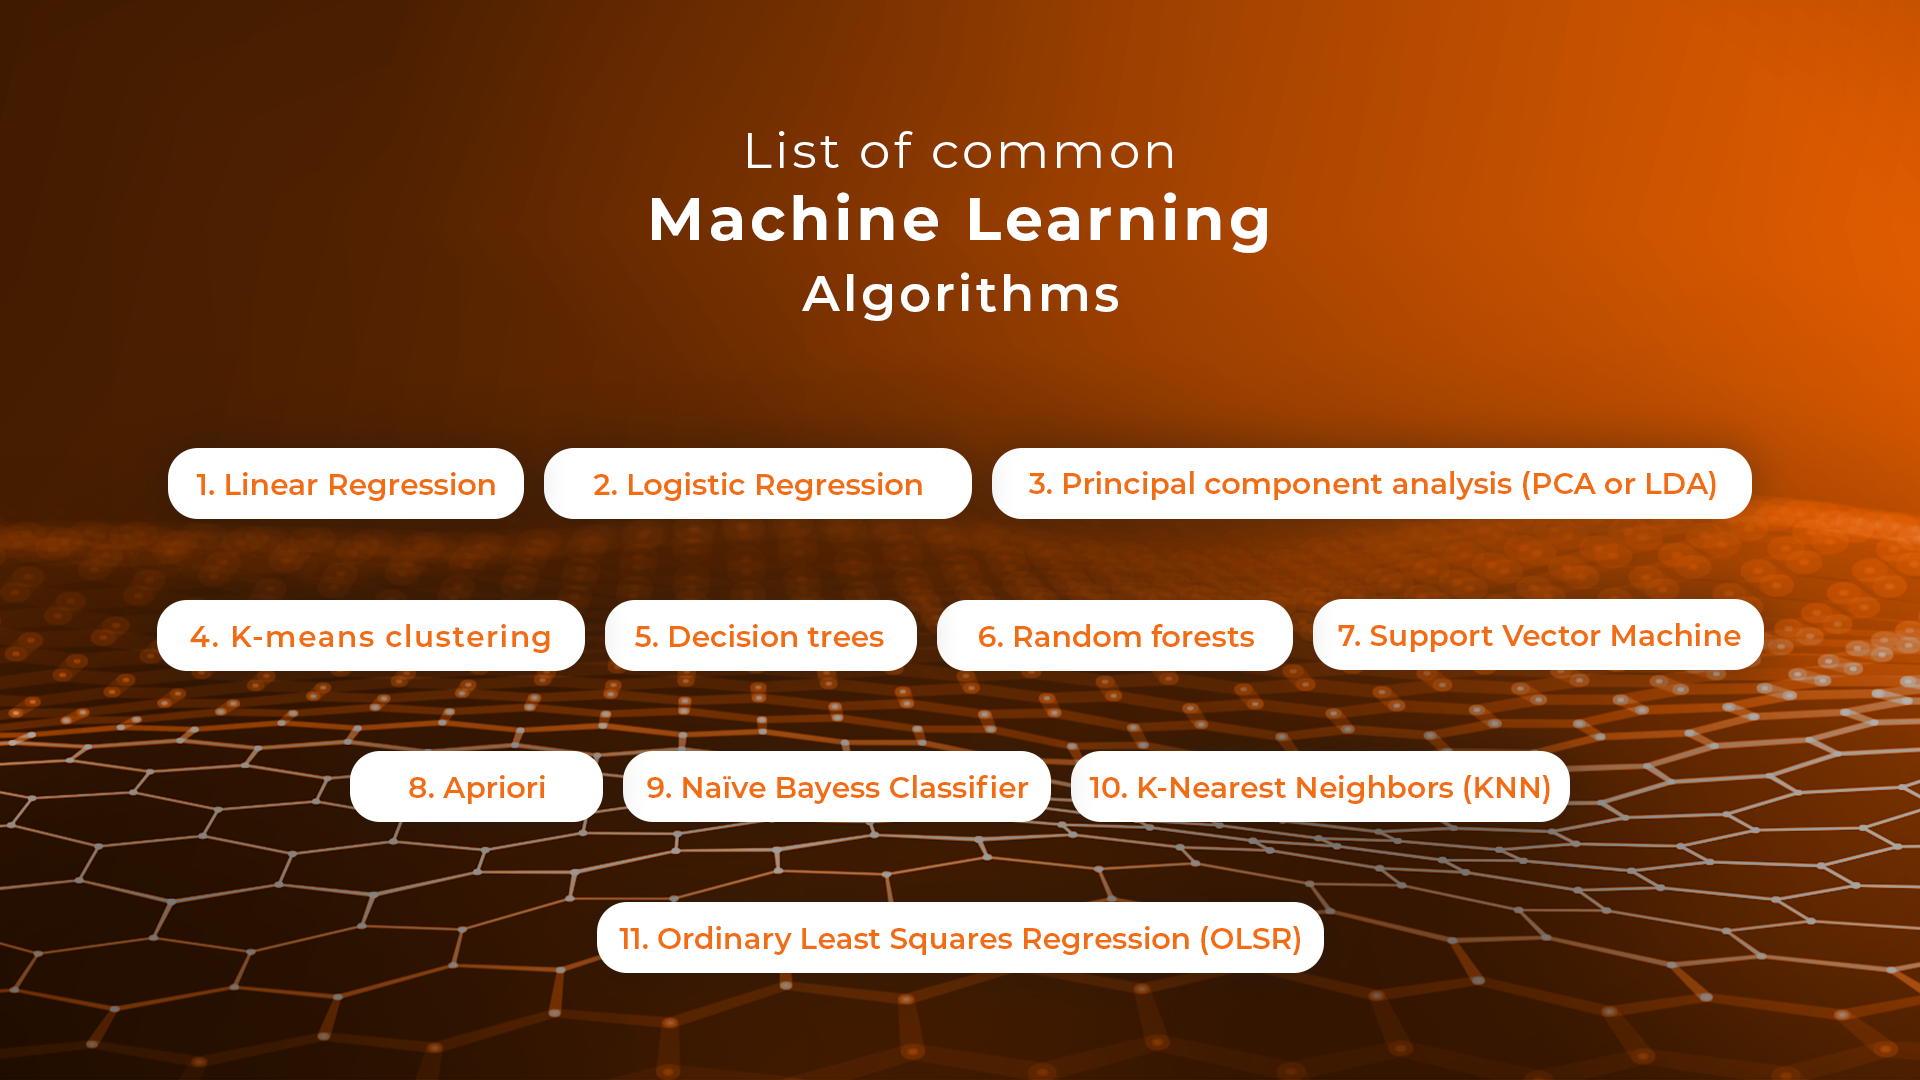
The best machine learning algorithms you should know

1 Linear Regression

Linear regression is an algorithm that correlates between two variables in the data set, examining the input and output sets to show a relationship between them. For example, the algorithm can show how changing one of the input variables affects the other variable. The relationship is represented by plotting a line on the graph.

Linear regression is one of the most popular algorithms in machine learning because it’s transparent and requires no tuning to work. Practical applications of this algorithm are risk assessment or sales forecasting solutions.

2 Logistic regression

Logistic regression is a type of constrained Linear Regression with a non-linearity application after you apply weights. Note that this algorithm is used for classification, not regression. The algorithm restricts the outputs close to +/- classes (and 1 and 0 in the case of sigmoid) and can be trained with Gradient Descent or L-BFGS.

Logistic regression is used in Natural Language Processing (NLP) applications, where it often appears under the name of Maximum Entropy Classifier.

3 Principal component analysis (PCA or LDA)

Principal component analysis is an unsupervised method that helps data scientists to understand better the global properties of a data set that consists of vectors. It analyzes the covariance matrix of data points to learn which dimensions/data points have high variance among themselves and low covariance with others. The algorithm helps data scientists to get data points with reduced dimensions.

4 K-means clustering

K- means clustering is a type of unsupervised clustering algorithm that sorts data sets through defined clusters. It offers results in the form of groups based on internal patterns.

For example, you can use a K-means algorithm for sorting web results for the word “cat,” and it will show all the results in the form of groups. The main advantage of this algorithm is its accuracy as it provides data groupings faster than other algorithms.
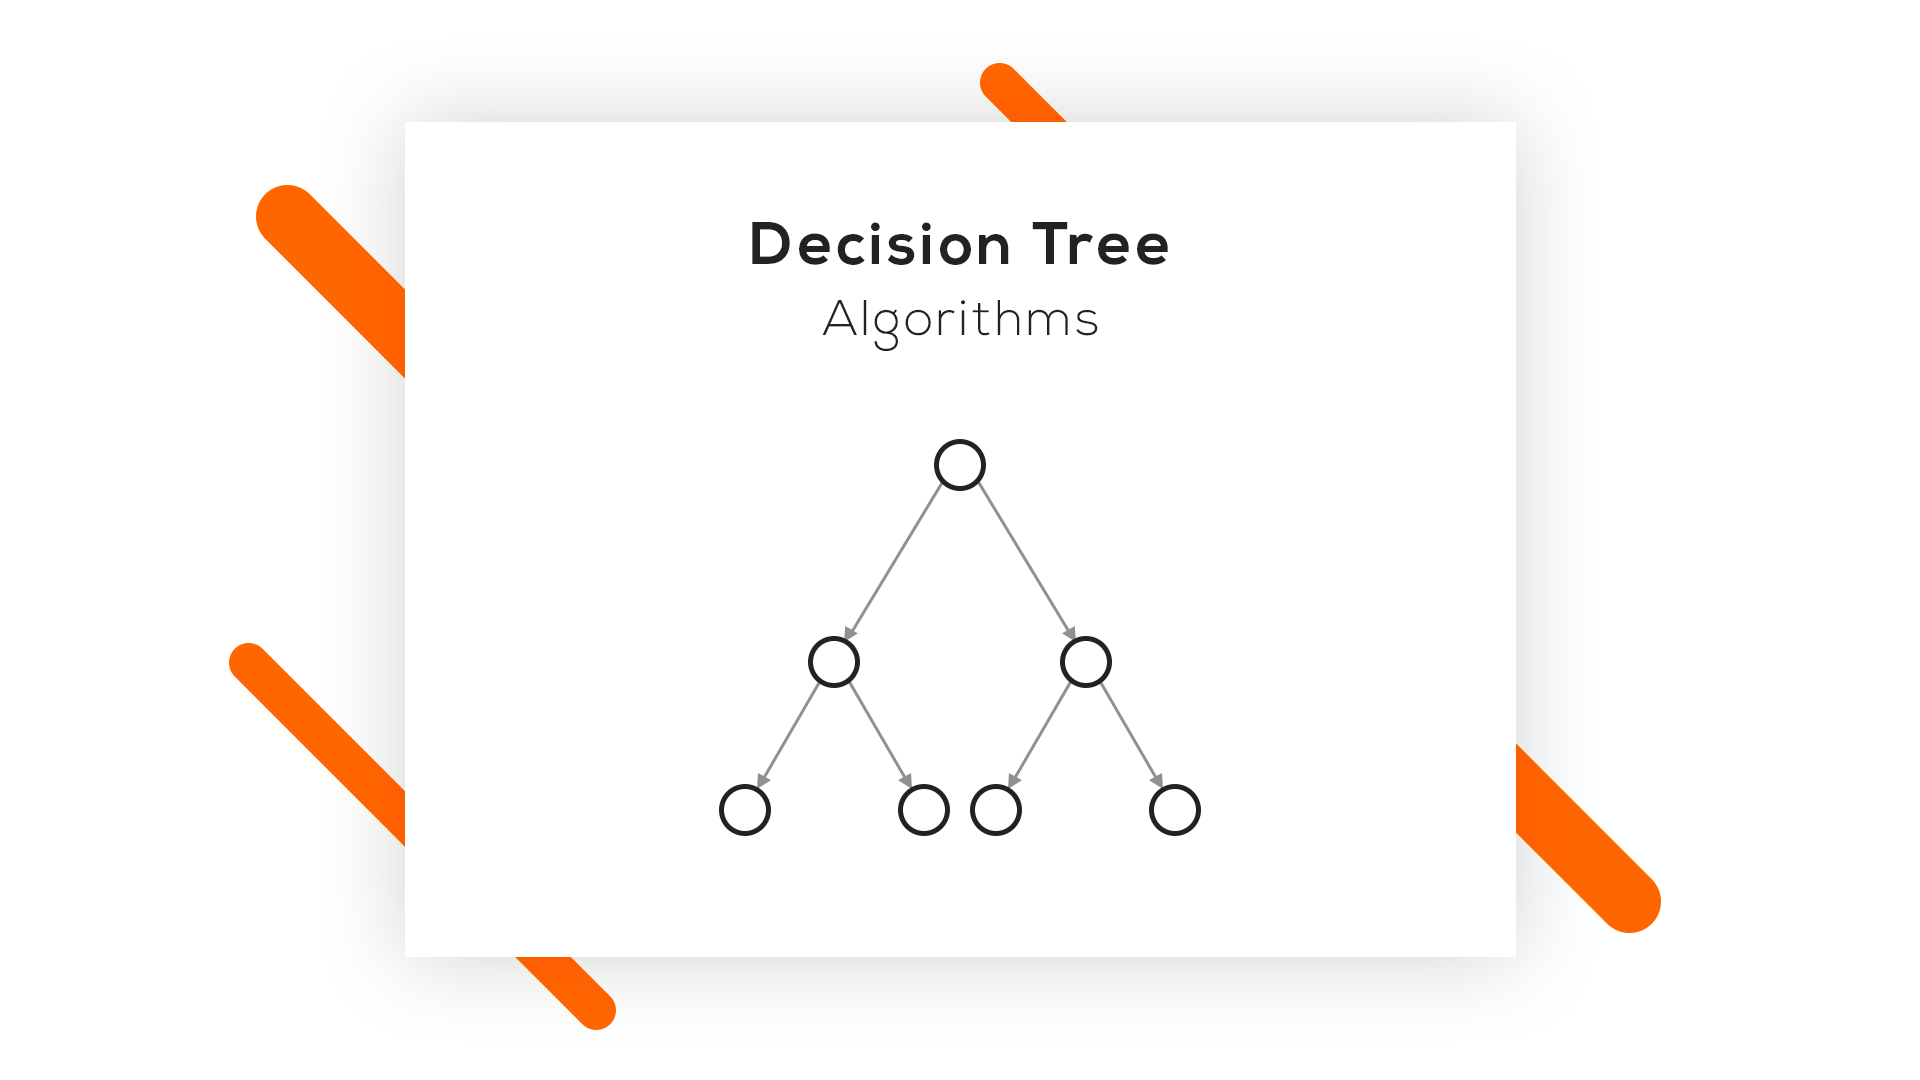
 

5 Decision trees

A decision tree is made of various branches that represent the outcome of many decisions. This algorithm collects and graphs data in multiple branches to predict response variables on the basis of past decisions. It comes in handy for mapping our decisions and presents results visually to communicate findings easily.

Decision trees work best for smaller data sets and relatively low-stake decisions – otherwise, the long-tail visuals can be hard to decipher. The key advantage of this algorithm is that it allows showing multiple outcomes and tests without having to involve data scientists – it’s easy to use.

6 Random forests

A random forest consists of a great number of individual decision trees where they all operate as an ensemble. An individual tree in the random forest generates a class prediction – the class which receives the highest number of votes becomes the model’s prediction. Having many relatively uncorrelated models (trees) operating as a committee easily outperforms individual constituent models.

The low correlation between these models is the strength of this approach because it allows producing ensemble predictions that are far more accurate than individual predictions. Note that decisions trees protect each other from individual errors. While some trees may generate false predictions, others will generate the right ones – as a group; they will be able to move in the right direction.

7 Support Vector Machine

Support Vector Machines (SVMs) are linear models similar to linear or logistic regression we’ve discussed earlier. However, there’s one difference – they have a different margin-based loss function, which can be optimized by using methods such as L-BFGS or SGD. SVMs internally analyze data sets into classes, which is helpful for future classifications.

The main idea behind SVM is separating data into classes and maximizing the margins of entering future data into classes. This type of algorithm works best for training data. However, it can also serve as a tool for processing nonlinear data. The financial sector makes use of Support Vector Machines thanks to its accuracy in classifying both current and future data sets.

8 Apriori

The Apriori algorithm is used a lot in market analysis. It’s based on the principle of Apriori and checks for positive and negative correlations between products after analyzing values in data sets.

For example, if two values often correlate in a data set, the algorithm will conclude that A will often lead to B, referring to the information in data sets. For example, if customers often buy product A and product B together, this relation will hold a high percentage and help companies like Google or Amazon to predict product searches and purchases.

9 Naive Bayes Classifier

This handy classification technique is based on Bayes’ Theorem, which assumes independence among predictors. The algorithm will assume that the presence of a specific feature in a class is not related to the presence of any other feature in the same class.

For example, a fruit may be considered a banana if it’s yellow, curved, and about 15 cm long. These features depend on each other, and on the existence of hooter features, they all independently contribute to the probability that this fruit is a banana. That’s why the algorithm bears the name “Naive.”

The algorithm offers a model that is easy to build and helpful in handling very large data sets. It can outperform the most sophisticated classification methods.

10 K-Nearest Neighbors (KNN)

This is one of the simplest algorithm types used in machine learning for classification and regression. KNN algorithms classify new data points on the basis of similarity measures, such as the distance function. They perform classification by using a majority vote of the data points’ neighbors. They then assign data to the class, which has the nearest neighbors. Together with increasing the number of nearest neighbors (the value of k), the accuracy may increase as well.

11 Ordinary Least Squares Regression (OLSR)

Ordinary Least Squares Regression (OLSR) is a generalized linear modeling technique data scientists use for estimating unknown parameters that are part of a linear regression model. OLSR describes the relationship between a dependent variable and one or more of its independent variables.

The algorithm is applied in diverse fields such as economics, finance, medicine, and social sciences. Companies use it in machine learning and predictive analytics to dynamically predict specific outcomes on the basis of variables that change dynamically.

We hope that this machine learning algorithms list helps you pick the right tools of the trade for your next machine learning project. If you’d like to learn more about Machine Learning, Data Science and Web Development, visit the Sunscrapers company blog.

Process Paradise by the Dashboard Light

The right questions drive business success. Questions like, “How can I make sure my product is the best of its kind?” “How can I get the edge over my competitors?” and “How can I keep growing my organization?” Modern businesses take their questions further, focusing on the details of how they actually function. At this level, the questions become, “How can I make my business as efficient as possible?” “How can I improve the way my company does business?” and even, “Why aren’t my company’s processes working as they should?”


Read this article in German:

Mit Dashboards zur Prozessoptimierung


To discover the answers to these questions (and many others!), more and more businesses are turning to process mining. Process mining helps organizations unlock hidden value by automatically collecting information on process models from across the different IT systems operating within a business. This allows for continuous monitoring of an organization’s end-to-end process landscape, meaning managers and staff gain specific operational insights into potential risks—as well as ongoing improvement opportunities.

However, process mining is not a silver bullet that turns data into insights at the push of a button. Process mining software is simply a tool that produces information, which then must be analyzed and acted upon by real people. For this to happen, the information produced must be available to decision-makers in an understandable format.

For most process mining tools, the emphasis remains on the sophistication of analysis capabilities, with the resulting data needing to be interpreted by a select group of experts or specialists within an organization. This necessarily creates a delay between the data being produced, the analysis completed, and actions taken in response.

Process mining software that supports a more collaborative approach by reducing the need for specific expertise can help bridge this gap. Only if hypotheses, analysis, and discoveries are shared, discussed, and agreed upon with a wide range of people can really meaningful insights be generated.

Of course, process mining software is currently capable of generating standardized reports and readouts, but in a business environment where the pace of change is constantly increasing, this may not be sufficient for very much longer. For truly effective process mining, the secret to success will be anticipating challenges and opportunities, then dealing with them as they arise in real time.

Dashboards of the future

To think about how process mining could improve, let’s consider an analog example. Technology evolves to make things easier—think of the difference between keeping track of expenditure using a written ledger vs. an electronic spreadsheet. Now imagine the spreadsheet could tell you exactly when you needed to read it, and where to start, as well as alerting you to errors and omissions before you were even aware you’d made them.

Advances in process mining make this sort of enhanced assistance possible for businesses seeking to improve the way they work. With the right process mining software, companies can build tailored operational cockpits that unite real-time operational data with process management. This allows for the usual continuous monitoring of individual processes and outcomes, but it also offers even clearer insights into an organization’s overall process health.

Combining process mining with an organization’s existing process models in the right way turns these models from static representations of the way a particular process operates, into dynamic dashboards that inform, guide and warn managers and staff about problems in real time. And remember, dynamic doesn’t have to mean distracting—the right process mining software cuts into your processes to reveal an all-new analytical layer of process transparency, making things easier to understand, not harder.

As a result, business transformation initiatives and other improvement plans and can be adapted and restructured on the go, while decision-makers can create automated messages to immediately be advised of problems and guided to where the issues are occurring, allowing corrective action to be completed faster than ever. This rapid evaluation and response across any process inefficiencies will help organizations save time and money by improving wasted cycle times, locating bottlenecks, and uncovering non-compliance across their entire process landscape.

Dynamic dashboards with Signavio

To see for yourself how the most modern and advanced process mining software can help you reveal actionable insights into the way your business works, give Signavio Process Intelligence a try. With Signavio’s Live Insights, all your process information can be visualized in one place, represented through a traffic light system. Simply decide which processes and which activities within them you want to monitor or understand, place the indicators, choose the thresholds, and let Signavio Process Intelligence connect your process models to the data.

Banish multiple tabs and confusing layouts, amaze your colleagues and managers with fact-based insights to support your business transformation, and reduce the time it takes to deliver value from your process management initiatives. To find out more about Signavio Process Intelligence, or sign up for a free 30-day trial, visit www.signavio.com/try.

Process mining is a powerful analysis tool, giving you the visibility, quantifiable numbers, and information you need to improve your business processes. Would you like to read more? With this guide to managing successful process mining initiatives, you will learn that how to get started, how to get the right people on board, and the right project approach.

The importance of being Data Scientist

Header-Image by Clint Adair on Unsplash.

The incredible results of Machine Learning and Artificial Intelligence, Deep Learning in particular, could give the impression that Data Scientist are like magician. Just think of it. Recognising faces of people, translating from one language to another, diagnosing diseases from images, computing which product should be shown for us next to buy and so on from numbers only. Numbers which existed for centuries. What a perfect illusion. But it is only an illusion, as Data Scientist existed as well for centuries. However, there is a difference between the one from today compared to the one from the past: evolution.

The main activity of Data Scientist is to work with information also called data. Records of data are as old as mankind, but only within the 16 century did it include also numeric forms — as numbers started to gain more and more ground developing their own symbols. Numerical data, from a given phenomenon — being an experiment or the counts of sheep sold by week over the year –, was from early on saved in tabular form. Such a way to record data is interlinked with the supposition that information can be extracted from it, that knowledge — in form of functions — is hidden and awaits to be discovered. Collecting data and determining the function best fitting them let scientist to new insight into the law of nature right away: Galileo’s velocity law, Kepler’s planetary law, Newton theory of gravity etc.

Such incredible results where not possible without the data. In the past, one was able to collect data only as a scientist, an academic. In many instances, one needed to perform the experiment by himself. Gathering data was tiresome and very time consuming. No sensor which automatically measures the temperature or humidity, no computer on which all the data are written with the corresponding time stamp and are immediately available to be analysed. No, everything was performed manually: from the collection of the data to the tiresome computation.

More then that. Just think of Michael Faraday and Hermann Hertz and there experiments. Such endeavour where what we will call today an one-man-show. Both of them developed parts of the needed physics and tools, detailed the needed experiment settings, conducting the experiment and collect the data and, finally, computing the results. The same is true for many other experiments of their time. In biology Charles Darwin makes its case regarding evolution from the data collected in his expeditions on board of the Beagle over a period of 5 years, or Gregor Mendel which carry out a study of pea regarding the inherence of traits. In physics Blaise Pascal used the barometer to determine the atmospheric pressure or in chemistry Antoine Lavoisier discovers from many reaction in closed container that the total mass does not change over time. In that age, one person was enough to perform everything and was the reason why the last part, of a data scientist, could not be thought of without the rest. It was inseparable from the rest of the phenomenon.

With the advance of technology, theory and experimental tools was a specialisation gradually inescapable. As the experiments grow more and more complex, the background and condition in which the experiments were performed grow more and more complex. Newton managed to make first observation on light with a simple prism, but observing the line and bands from the light of the sun more than a century and half later by Joseph von Fraunhofer was a different matter. The small improvements over the centuries culminated in experiments like CERN or the Human Genome Project which would be impossible to be carried out by one person alone. Not only was it necessary to assign a different person with special skills for a separate task or subtask, but entire teams. CERN employs today around 17 500 people. Only in such a line of specialisation can one concentrate only on one task alone. Thus, some will have just the knowledge about the theory, some just of the tools of the experiment, other just how to collect the data and, again, some other just how to analyse best the recorded data.

If there is a specialisation regarding every part of the experiment, what makes Data Scientist so special? It is impossible to validate a theory, deciding which market strategy is best without the work of the Data Scientist. It is the reason why one starts today recording data in the first place. Not only the size of the experiment has grown in the past centuries, but also the size of the data. Gauss manage to determine the orbit of Ceres with less than 20 measurements, whereas the new picture about the black hole took 5 petabytes of recorded data. To put this in perspective, 1.5 petabytes corresponds to 33 billion photos or 66.5 years of HD-TV videos. If one includes also the time to eat and sleep, than 5 petabytes would be enough for a life time.

For Faraday and Hertz, and all the other scientist of their time, the goal was to find some relationship in the scarce data they painstakingly recorded. Due to time limitations, no special skills could be developed regarding only the part of analysing data. Not only are Data Scientist better equipped as the scientist of the past in analysing data, but they managed to develop new methods like Deep Learning, which have no mathematical foundation yet in spate of their success. Data Scientist developed over the centuries to the seldom branch of science which bring together what the scientific specialisation was forced to split.

What was impossible to conceive in the 19 century, became more and more a reality at the end of the 20 century and developed to a stand alone discipline at the beginning of the 21 century. Such a development is not only natural, but also the ground for the development of A.I. in general. The mathematical tools needed for such an endeavour where already developed by the half of the 20 century in the period when computing power was scars. Although the mathematical methods were present for everyone, to understand them and learn how to apply them developed quite differently within every individual field in which Machine Learning/A.I. was applied. The way the same method would be applied by a physicist, a chemist, a biologist or an economist would differ so radical, that different words emerged which lead to different langues for similar algorithms. Even today, when Data Science has became a independent branch, two different Data Scientists from different application background could find it difficult to understand each other only from a language point of view. The moment they look at the methods and code the differences will slowly melt away.

Finding a universal language for Data Science is one of the next important steps in the development of A.I. Then it would be possible for a Data Scientist to successfully finish a project in industry, turn to a new one in physics, then biology and returning to industry without much need to learn special new languages in order to be able to perform each tasks. It would be possible to concentrate on that what a Data Scientist does best: find the best algorithm. In other words, a Data Scientist could resolve problems independent of the background the problem was stated.

This is the most important aspect that distinguish the Data Scientist. A mathematician is limited to solve problems in mathematics alone, a physicist is able to solve problems only in physics, a biologist problems only in biology. With a unique language regarding the methods and strategies to solve Machine Learning/A.I. problems, a Data Scientist can solve a problem independent of the field. Specialisation put different branches of science at drift from each other, but it is the evolution of the role of the Data Scientist to synthesize from all of them and find the quintessence in a language which transpire beyond all the field of science. The emerging language of Data Science is a new building block, a new mathematical language of nature.

Although such a perspective does not yet exists, the principal component of Machine Learning/A.I. already have such proprieties partially in form of data. Because predicting for example the numbers of eggs sold by a company or the numbers of patients which developed immune bacteria to a specific antibiotic in all hospital in a country can be performed by the same prediction method. The data do not carry any information about the entities which are being predicted. It does not matter anymore if the data are from Faraday’s experiment, CERN of Human Genome. The same data set and its corresponding prediction could stand literary for anything. Thus, the result of the prediction — what we would call for a human being intuition and/or estimation — would be independent of the domain, the area of knowledge it originated.

It also lies at the very heart of A.I., the dream of researcher to create self acting entities, that is machines with consciousness. This implies that the algorithms must be able to determine which task, model is relevant at a given moment. It would be to cumbersome to have a model for every task and and every field and then try to connect them all in one. The independence of scientific language, like of data, is thus a mandatory step. It also means that developing A.I. is not only connected to develop a new consciousness, but, and most important, to the development of our one.

Glorious career paths of a Big Data Professional

Are you wondering about the career profiles you may get to fill if you get into Big Data industry? If yes, then Bingo! This is the post that will inform you just about that. Big data is just an umbrella term. There are a lot of profiles and career paths that are covered under this umbrella term. Let us have a look at some of these profiles.

Data Visualisation Specialist

The process of visualizing data is turning out to be critical in guaranteeing information-driven representatives get the upfront investment required to actualize goal-oriented and significant Big Data extends in their organization. Making your data to tell a story and the craft of envisioning information convincingly has turned into a significant piece of the Big Data world and progressively associations need to have these capacities in-house. Besides, as a rule, these experts are relied upon to realize how to picture in different instruments, for example, Spotfire, D3, Carto, and Tableau – among numerous others. Information Visualization Specialists should be versatile and inquisitive to guarantee they stay aware of most recent patterns and answers for a recount to their information stories in the most intriguing manner conceivable with regards to the board room. 


Big Data Architect

This is the place the Hadoop specialists come in. Ordinarily, a Big Data planner tends to explicit information issues and necessities, having the option to portray the structure and conduct of a Big Data arrangement utilizing the innovation wherein they practice – which is, as a rule, mostly Hadoop.

These representatives go about as a significant connection between the association (and its specific needs) and Data Scientists and Engineers. Any organization that needs to assemble a Big Data condition will require a Big Data modeler who can serenely deal with the total lifecycle of a Hadoop arrangement – including necessity investigation, stage determination, specialized engineering structure, application plan, and advancement, testing the much-dreaded task of deploying lastly.

Systems Architect 

This Big data professional is in charge of how your enormous information frameworks are architected and interconnected. Their essential incentive to your group lies in their capacity to use their product building foundation and involvement with huge scale circulated handling frameworks to deal with your innovation decisions and execution forms. You’ll need this individual to construct an information design that lines up with the business, alongside abnormal state anticipating the improvement. The person in question will consider different limitations, adherence to gauges, and varying needs over the business.

Here are some responsibilities that they play:

    • Determine auxiliary prerequisites of databases by investigating customer tasks, applications, and programming; audit targets with customers and assess current frameworks.
    • Develop database arrangements by planning proposed framework; characterize physical database structure and utilitarian abilities, security, back-up and recuperation particulars.
    • Install database frameworks by creating flowcharts; apply ideal access methods, arrange establishment activities, and record activities.
    • Maintain database execution by distinguishing and settling generation and application advancement issues, figuring ideal qualities for parameters; assessing, incorporating, and putting in new discharges, finishing support and responding to client questions.
    • Provide database support by coding utilities, reacting to client questions, and settling issues.


Artificial Intelligence Developer

The certain promotion around Artificial Intelligence is additionally set to quicken the number of jobs publicized for masters who truly see how to apply AI, Machine Learning, and Deep Learning strategies in the business world. Selection representatives will request designers with broad learning of a wide exhibit of programming dialects which loan well to AI improvement, for example, Lisp, Prolog, C/C++, Java, and Python.

All said and done; many people estimate that this popular demand for AI specialists could cause a something like what we call a “Brain Drain” organizations poaching talented individuals away from the universe of the scholarly world. A month ago in the Financial Times, profound learning pioneer and specialist Yoshua Bengio, of the University of Montreal expressed: “The industry has been selecting a ton of ability — so now there’s a lack in the scholarly world, which is fine for those organizations. However, it’s not extraordinary for the scholarly world.” It ; howeverusiasm to perceive how this contention among the scholarly world and business is rotated in the following couple of years.

Data Scientist

The move of Big Data from tech publicity to business reality may have quickened, yet the move away from enrolling top Data Scientists isn’t set to change in 2020. An ongoing Deloitte report featured that the universe of business will require three million Data Scientists by 2021, so if their expectations are right, there’s a major ability hole in the market. This multidisciplinary profile requires specialized logical aptitudes, specialized software engineering abilities just as solid gentler abilities, for example, correspondence, business keenness, and scholarly interest.

Data Engineer

Clean and quality data is crucial in the accomplishment of Big Data ventures. Consequently, we hope to see a lot of opening in 2020 for Data Engineers who have a predictable and awesome way to deal with information transformation and treatment. Organizations will search for these special data masters to have broad involvement in controlling data with SQL, T-SQL, R, Hadoop, Hive, Python and Spark. Much like Data Scientists. They are likewise expected to be innovative with regards to contrasting information with clashing information types with have the option to determine issues. They additionally frequently need to make arrangements which enable organizations to catch existing information in increasingly usable information groups – just as performing information demonstrations and their modeling.

IT/Operations Manager Job Description

In Big data industry, the IT/Operations Manager is a profitable expansion to your group and will essentially be in charge of sending, overseeing, and checking your enormous information frameworks. You’ll depend on this colleague to plan and execute new hardware and administrations. The person in question will work with business partners to comprehend the best innovation ventures to address their procedures and concerns—interpreting business necessities to innovation plans. They’ll likewise work with venture chiefs to actualize innovation and be in charge of effective progress and general activities.

Here are some responsibilities that they play:

  • Manage and be proactive in announcing, settling and raising issues where required 
  • Lead and co-ordinate issue the executive’s exercises, notwithstanding ceaseless procedure improvement activities  
  • Proactively deal with our IT framework 
  • Supervise and oversee IT staffing, including enrollment, supervision, planning, advancement, and assessment
  • Verify existing business apparatuses and procedures remain ideally practical and worth included 
  • Benchmark, dissect, report on and make suggestions for the improvement and development of the IT framework and IT frameworks 
  • Advance and keep up a corporate SLA structure

Conclusion

These are some of the best career paths that big data professionals can play after entering the industry. Honesty and hard work can always take you to the zenith of any field that you choose to be in. Also, keep upgrading your skills by taking newer certifications and technologies. Good Luck 

Visual Question Answering with Keras – Part 2: Making Computers Intelligent to answer from images

Making Computers Intelligent to answer from images

This is my second blog on Visual Question Answering, in the last blog, I have introduced to VQA, available datasets and some of the real-life applications of VQA. If you have not gone through then I would highly recommend you to go through it. Click here for more details about it.

In this blog post, I will walk through the implementation of VQA in Keras.

You can download the dataset from here: https://visualqa.org/index.html. All my experiments were performed with VQA v2 and I have used a very tiny subset of entire dataset i.e all samples for training and testing from the validation set.

Table of contents:

  1. Preprocessing Data
  2. Process overview for VQA
  3. Data Preprocessing – Images
  4. Data Preprocessing through the spaCy library- Questions
  5. Model Architecture
  6. Defining model parameters
  7. Evaluating the model
  8. Final Thought
  9. References

NOTE: The purpose of this blog is not to get the state-of-art performance on VQA. But the idea is to get familiar with the concept. All my experiments were performed with the validation set only.

Full code on my Github here.


1. Preprocessing Data:

If you have downloaded the dataset then the question and answers (called as annotations) are in JSON format. I have provided the code to extract the questions, annotations and other useful information in my Github repository. All extracted information is stored in .txt file format. After executing code the preprocessing directory will have the following structure.

All text files will be used for training.


2. Process overview for VQA:

As we have discussed in previous post visual question answering is broken down into 2 broad-spectrum i.e. vision and text.  I will represent the Neural Network approach to this problem using the Convolutional Neural Network (for image data) and Recurrent Neural Network(for text data). 

If you are not familiar with RNN (more precisely LSTM) then I would highly recommend you to go through Colah’s blog and Andrej Karpathy blog. The concepts discussed in this blogs are extensively used in my post.

The main idea is to get features for images from CNN and features for the text from RNN and finally combine them to generate the answer by passing them through some fully connected layers. The below figure shows the same idea.


I have used VGG-16 to extract the features from the image and LSTM layers to extract the features from questions and combining them to get the answer.

3. Data Preprocessing – Images:

Images are nothing but one of the input to our model. But as you already may know that before feeding images to the model we need to convert into the fixed-size vector.

So we need to convert every image into a fixed-size vector then it can be fed to the neural network. For this, we will use the VGG-16 pretrained model. VGG-16 model architecture is trained on millions on the Imagenet dataset to classify the image into one of 1000 classes. Here our task is not to classify the image but to get the bottleneck features from the second last layer.

Hence after removing the softmax layer, we get a 4096-dimensional vector representation (bottleneck features) for each image.

Image Source: https://www.cs.toronto.edu/~frossard/post/vgg16/


For the VQA dataset, the images are from the COCO dataset and each image has unique id associated with it. All these images are passed through the VGG-16 architecture and their vector representation is stored in the “.mat” file along with id. So in actual, we need not have to implement VGG-16 architecture instead we just do look up into file with the id of the image at hand and we will get a 4096-dimensional vector representation for the image.

4. Data Preprocessing through the spaCy library- Questions:

spaCy is a free, open-source library for advanced Natural Language Processing (NLP) in Python. As we have converted images into a fixed 4096-dimensional vector we also need to convert questions into a fixed-size vector representation. For installing spaCy click here

You might know that for training word embeddings in Keras we have a layer called an Embedding layer which takes a word and embeds it into a higher dimensional vector representation. But by using the spaCy library we do not have to train the get the vector representation in higher dimensions.


This model is actually trained on billions of tokens of the large corpus. So we just need to call the vector method of spaCy class and will get vector representation for word.

After fitting, the vector method on tokens of each question will get the 300-dimensional fixed representation for each word.

5. Model Architecture:

In our problem the input consists of two parts i.e an image vector, and a question, we cannot use the Sequential API of the Keras library. For this reason, we use the Functional API which allows us to create multiple models and finally merge models.

The below picture shows the high-level architecture idea of submodules of neural network.

After concatenating the 2 different models the summary will look like the following.

The below plot helps us to visualize neural network architecture and to understand the two types of input:


6. Defining model parameters:

The hyperparameters that we are going to use for our model is defined as follows:

If you know what this parameter means then you can play around it and can get better results.

Time Taken: I used the GPU on https://colab.research.google.com and hence it took me approximately 2 hours to train the model for 5 epochs. However, if you train it on a PC without GPU, it could take more time depending on the configuration of your machine.

7. Evaluating the model:

Since I have used the very small dataset for performing these experiments I am not able to get very good accuracy. The below code will calculate the accuracy of the model.


Since I have trained a model multiple times with different parameters you will not get the same accuracy as me. If you want you can directly download mode.h5 file from my google drive.


8. Final Thoughts:

One of the interesting thing about VQA is that it a completely new field. So there is absolutely no end to what you can do to solve this problem. Below are some tips while replicating the code.

  1. Start with a very small subset of data: When you start implementing I suggest you start with a very small amount of data. Because once you are ready with the whole setup then you can scale it any time.
  2. Understand the code: Understanding code line by line is very much helpful to match your theoretical knowledge. So for that, I suggest you can take very few samples(maybe 20 or less) and run a small chunk (2 to 3 lines) of code to get the functionality of each part.
  3. Be patient: One of the mistakes that I did while starting with this project was to do everything at one go. If you get some error while replicating code spend 4 to 5 days harder on that. Even after that if you won’t able to solve, I would suggest you resume after a break of 1 or 2 days. 

VQA is the intersection of NLP and CV and hopefully, this project will give you a better understanding (more precisely practically) with most of the deep learning concepts.

If you want to improve the performance of the model below are few tips you can try:

  1. Use larger datasets
  2. Try Building more complex models like Attention, etc
  3. Try using other pre-trained word embeddings like Glove 
  4. Try using a different architecture 
  5. Do more hyperparameter tuning

The list is endless and it goes on.

In the blog, I have not provided the complete code you can get it from my Github repository.

9. References:

  1. https://blog.floydhub.com/asking-questions-to-images-with-deep-learning/
  2. https://tryolabs.com/blog/2018/03/01/introduction-to-visual-question-answering/
  3. https://github.com/sominwadhwa/vqamd_floyd

6 Important Reasons for the Java Experts to learn Hadoop Skills

You must be well aware of the fact that Java and Hadoop Skills are in high demand these days. Gone are the days when advancement work moved around Java and social database. Today organizations are managing big information. It is genuinely big. From gigabytes to petabytes in size and social databases are exceptionally restricted to store it. Additionally, organizations are progressively outsourcing the Java development jobs to different groups who are as of now having big data experts.

Ever wondered what your future would have in store for you if you possess Hadoop as well as Java skills? No? Let us take a look. Today we shall discuss the point that why is it preferable for Java Developers to learn Hadoop.

Hadoop is the Future Java-based Framework that Leads the Industry

Data analysis is the current marketing strategy that the companies are adopting these days. What’s more, Hadoop is to process and comprehend all the Big Data that is generated all the time. As a rule, Hadoop is broadly utilized by practically all organizations from big and small and in practically all business spaces. It is an open-source stage where Java owes a noteworthy segment of its success

The processing channel of Hadoop, which is MapReduce, is written in Java. Thus, a Hadoop engineer needs to compose MapReduce contents in Java for Big data analysis. Notwithstanding that, HDFS, which is the record arrangement of Hadoop, is additionally Java-based programming language at its core. Along these lines, a Hadoop developer needs to compose documents from local framework to HDFS through deployment, which likewise includes Java programming.

Learn Hadoop: It is More Comfortable for a Java Developer

Hadoop is more of an environment than a standalone innovation. Also, Hadoop is a Java-based innovation. Regardless of whether it is Hadoop 1 which was about HDFS and MapReduce or Hadoop2 biological system that spreads HDFS, Spark, Yarn, MapReduce, Tez, Flink, Giraph, Storm, JVM is the base for all. Indeed, even a portion of the broadly utilized programming languages utilized in a portion of the Hadoop biological system segments like Spark is JVM based. The run of the mill models is Scala and Clojure.

Consequently, if you have a Java foundation, understanding Hadoop is progressively easier for you. Also, here, a Hadoop engineer needs Java programming information to work in MapReduce or Spark structure. Thus, if you are as of now a Java designer with a logical twist of the brain, you are one stage ahead to turn into a Hadoop developer.

IT Industry is looking for Professionals with Java and Hadoop Skills

If you pursue the expected set of responsibilities and range of abilities required for a Hadoop designer in places of work, wherever you will watch the reference of Java. As Hadoop needs solid Java foundation, from this time forward associations are searching for Java designers as the best substitution for Hadoop engineers. It is savvy asset usage for organizations as they don’t have to prepare Java for new recruits to learn Hadoop for tasks.

Nonetheless, the accessible market asset for Hadoop is less. Therefore, there is a noteworthy possibility for Java designers in the Hadoop occupation field. Henceforth, as a Java designer, on the off chance that you are not yet arrived up in your fantasy organization, learning Hadoop, will without a doubt help you to discover the chance to one of your top picks.

Combined Java and Hadoop Skills Means Better Pay Packages

You will be progressively keen on learning Hadoop on the off chance that you investigate Gartner report on big information industry. According to the report, the Big Data industry has just come to the $50 billion points. Additionally, over 64% of the main 720 organizations worldwide are prepared to put resources into big information innovation. Notwithstanding that when you are a mix of a Java and Hadoop engineer, you can appreciate 250% pay climb with a normal yearly compensation of $150,000.It is about the yearly pay of a senior Hadoop developer.

Besides, when you change to Big Data Hadoop, it very well may be useful to improve the nature of work. You will manage unpredictable and greater tasks. It does not just give you a better extension to demonstrate your expertise yet, in addition, to set up yourself as a profitable asset who can have any kind of effect.

Adapting Big Data Hadoop can be exceptionally advantageous because it will assist you in dealing with greater, complex activities a lot simpler and convey preferable yield over your associates. To be considered for examinations, you should be somebody who can have any kind of effect in the group, and that is the thing that Hadoop lets you be.

Learning Hadoop will open New Opportunities to Other Lucrative Fields

Big data is only not going to learn Hadoop. When you are in Big information space, you have sufficient chance to jump other Java and Hadoop engineer. There are different exceedingly requesting zones in big information like Artificial Intelligence, Machine Learning, Data Science. You can utilize your Java and Hadoop engineer expertise as a springboard to take your vocation to the following level. In any case, the move will give you the best outcome once you move from Java to Hadoop and increase fundamental working knowledge.

Java with Hadoop opens new skylines of occupation jobs, for example, data scientist, data analyst business intelligence analyst, DBA, etc.

Premier organizations prefer Hadoop Developers with Java skills

Throughout the years the Internet has been the greatest driver of information, and the new data produced in 2012 remained at 2500 Exabyte. The computerized world developed by 62% a year ago to 800K petabytes and will keep on developing to the tune of 1.2 zeta bytes during the present year. Gartner gauges the market of Hadoop Ecosystem to $77 million and predicts it will come to the $813 million marks by 2016.

A review of LinkedIn profiles referencing Hadoop as their abilities uncovered that just about 17000 individuals are working in Companies like Cisco, HP, TCS, Oracle, Amazon, Yahoo, and Facebook, and so on. Aside from this Java proficient who learn Hadoop can begin their vocations with numerous new businesses like Platfora, Alpine information labs, Trifacta, Datatorrent, and so forth.

Conclusion

You can see that combining your Java skills with Hadoop skills can open the doors of several new opportunities for you. You can get better remuneration for your efforts, and you will always be in high demand. It is high time to learn Hadoop online now if you are a java developer.

How to Ensure Data Quality in an Organization?

Introduction to Data Quality

Today, the world is filled with data. It is everywhere. And, the value of any organization can be measured by the quality of its data. So, what actually is the quality of data or data quality, and why is it important? Well, data quality refers to the capability of a set of data to serve an intended purpose. 

Data quality is important to any organization because it provides timely and accurate information to manage accountability and services. It also helps to ensure and prioritize the best use of resources. Thus, high-quality data will lead to appropriate insights and valuable information for any organization. We can evaluate the quality of data in certain aspects. They include accuracy, relevancy, completeness, and uniqueness. 

Data Quality Problems

As the organizations are collecting vast amounts of data, managing its quality becomes more important every single day. In the year 2016, the costs of problems caused due to poor data quality were estimated by IBM, and it turned out to be $3.1 trillion across the U.S economy. Also, a Forrester report has stated that almost 30 percent of analysts spend 40 percent of their time validating and vetting their data prior to its utilization for strategic decision-making. These statistics indicate that the scale of the problems with data quality is vast.

So, why do these data quality problems occur? The main reasons include manual entry of data, software updates, integration of data sources, skills shortages, and insufficient testing time. Wrong decisions can be taken due to poor data management processes and poor quality of data. Because of this, many organizations lose their clients and customers. So, ensuring data quality must be given utmost importance in an organization. 

How to Ensure Data Quality?

Data quality management helps by combining data, technology, and organizational culture to deliver useful and accurate results. Good management of data quality builds a foundation for all the initiatives of a business. Now, let’s see how we can improve the data quality in an organization.

The first aspect of improving the quality of data is monitoring and cleansing data. This verifies data against standard statistical measures, validates data against matching descriptions, and uncovers relationships. This also checks the uniqueness of data and analyzes the data for its reusability. 

The second one is managing metadata centrally. Multiple people gather and clean data very often and they may work in different countries or offices. Therefore, you require clear policies on how data is gathered and managed as people in different parts of a company may misinterpret certain data terms and concepts. Centralized management of metadata is the solution to this problem as it reduces inconsistent interpretations and helps in establishing corporate standards.  

The next one is to ensure all the requirements are available and offer documentation for data processors and data providers. You have to format the specifications and offer a data dictionary and also provide training for the providers of data and all other new staff. Make sure you offer immediate help for all the data providers.

Very often, data is gathered from different sources and may include distinct spelling options. Hence, segmentation, scoring, smart lists, and many others are impacted by this. So, for entering a data point, a singular approach is essential, and data normalization provides this approach. The goal of this approach is to eliminate redundancy in data. Its advantages include easier object-to-data mapping and increased consistency.

The last aspect is to verify whether the data is consistent with the data rules and business goals, and this has to be done at regular intervals. You have to communicate the current status and data quality metrics to every stakeholder regularly to ensure the maintenance of data quality discipline across the organization.

Conclusion

Data quality is a continuous process but not a one-time project which needs the entire company to be data-focused and data-driven. It is much more than reliability and accuracy. High level of data quality can be achieved when the decision-makers have confidence in data and rely upon it. Follow the above-mentioned steps to ensure a high level of data quality in your organization.