Graphical understanding of dynamic programming and the Bellman equation: taking a typical approach at first

This is the second article of the series My elaborate study notes on reinforcement learning.

1, Before getting down on business

As the title of this article suggests, this article is going to be mainly about the Bellman equation and dynamic programming (DP), which are to be honest very typical and ordinary topics. One typical way of explaining DP in contexts of reinforcement learning (RL) would be explaining the Bellman equation, value iteration, and policy iteration, in this order. If you would like to merely follow pseudocode of them and implement them, to be honest that is not a big deal. However even though I have studied RL only for some weeks, I got a feeling that these algorithms, especially policy iteration are more than just single algorithms. In order not to miss the points of DP, rather than typically explaining value iteration and policy iteration, I would like to take a different approach. Eventually I am going to introduce DP in RL as a combination of the following key terms: the Bellman operator, the fixed point of a policy, policy evaluation, policy improvement, and existence of the optimal policy. But first, in this article I would like to cover basic and typical topics of DP in RL.

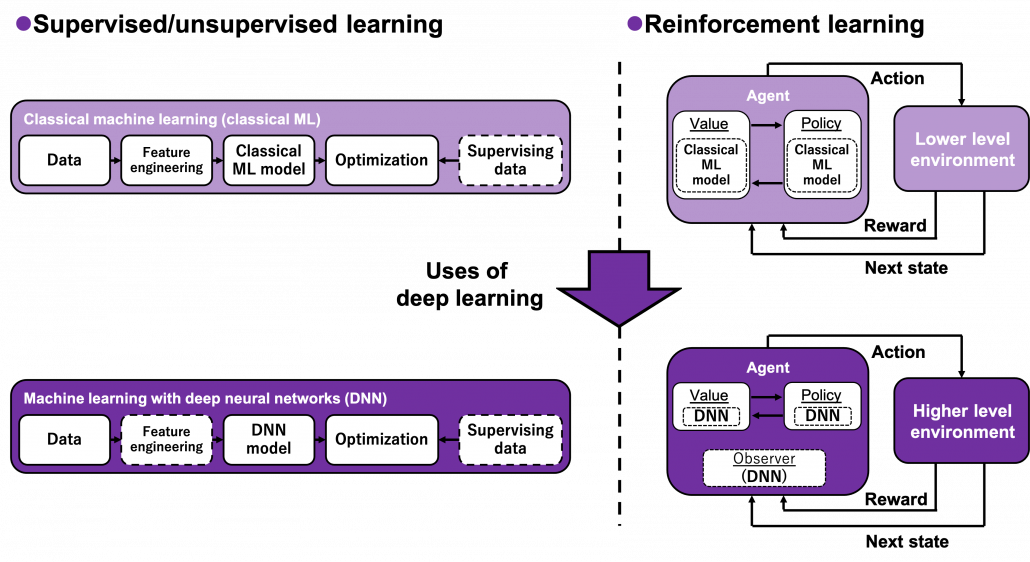
Many machine learning algorithms which use supervised/unsupervised learning more or less share the same ideas. You design a model and a loss function and input samples from data, and you adjust parameters of the model so that the loss function decreases. And you usually use optimization techniques like stochastic gradient descent (SGD) or ones derived from SGD. Actually feature engineering is needed to extract more meaningful information from raw data. Or especially in this third AI boom, the models are getting more and more complex, and I would say the efforts of feature engineering was just replaced by those of designing neural networks. But still, once you have the whole picture of supervised/unsupervised learning, you would soon realize other various algorithms is just a matter of replacing each component of the workflow. However reinforcement learning has been another framework of training machine learning models. Richard E. Bellman’s research on DP in 1950s is said to have laid a foundation for RL. RL also showed great progress thanks to development of deep neural networks (DNN), but still you have to keep it in mind that RL and supervised/unsupervised learning are basically different frameworks. DNN are just introduced in RL frameworks to enable richer expression of each component of RL. And especially when RL is executed in a higher level environment, for example screens of video games or phases of board games, DNN are needed to process each state of the environment. Thus first of all I think it is urgent to see ideas unique to RL in order to effectively learn RL. In the last article I said RL is an algorithm to enable planning by trial and error in an environment, when the model of the environment is not known. And DP is a major way of solving planning problems. But in this article and the next article, I am mainly going to focus on a different aspect of RL: interactions of policies and values.
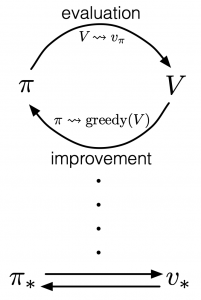
According to a famous Japanese textbook on RL named “Machine Learning Professional Series: Reinforcement Learning,” most study materials on RL lack explanations on mathematical foundations of RL, including the book by Sutton and Barto. That is why many people who have studied machine learning often find it hard to get RL formulations at the beginning. The book also points out that you need to refer to other bulky books on Markov decision process or dynamic programming to really understand the core ideas behind algorithms introduced in RL textbooks. And I got an impression most of study materials on RL get away with the important ideas on DP with only introducing value iteration and policy iteration algorithms. But my opinion is we should pay more attention on policy iteration. And actually important RL algorithms like Q learning, SARSA, or actor critic methods show some analogies to policy iteration. Also the book by Sutton and Barto also briefly mentions “Almost all reinforcement learning methods are well described as GPI (generalized policy iteration). That is, all have identifiable policies and value functions, with the policy always being improved with respect to the value function and the value function always being driven toward the value function for the policy, as suggested by the diagram to the right side.

Even though I arrogantly, as a beginner in this field, emphasized “simplicity” of RL in the last article, in this article I am conversely going to emphasize the “profoundness” of DP over two articles. But I do not want to cover all the exhaustive mathematical derivations for dynamic programming, which would let many readers feel reluctant to study RL. I tried as hard as possible to visualize the ideas in DP in simple and intuitive ways, as far as I could understand. And as the title of this article series shows, this article is also a study note for me. Any corrections or advice would be appreciated via email or comment pots below.

2, Taking a look at what DP is like

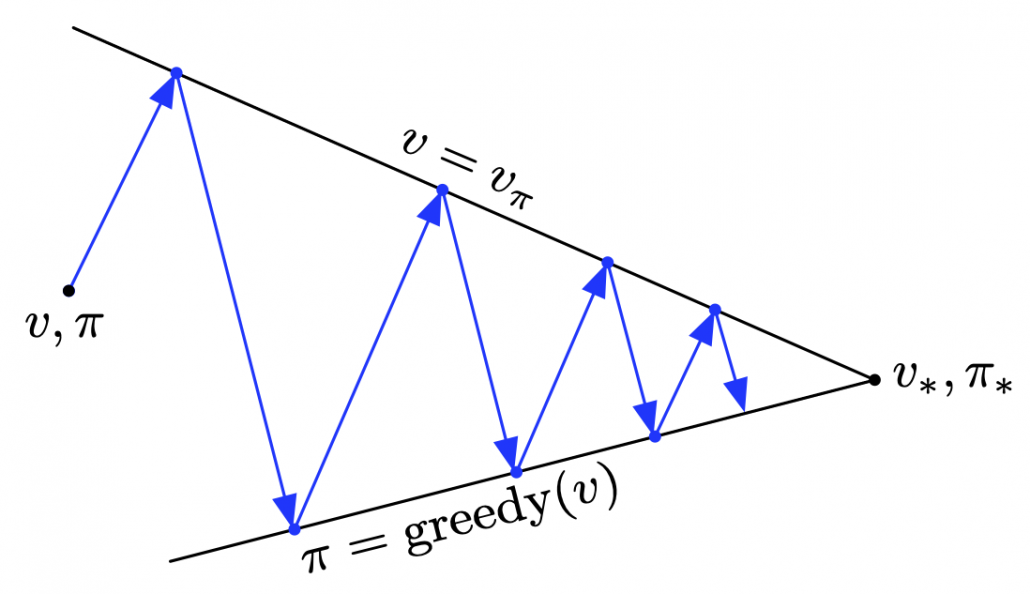
In the last article, I said that planning or RL is a problem of finding an optimal policy \pi(a|s) for choosing which actions to take depending on where you are. Also in the last article I displayed flows of blue arrows for navigating a robot as intuitive examples of optimal policies in planning or RL problems. But you cannot directly calculate those policies. Policies have to be evaluated in the long run so that they maximize returns, the sum of upcoming rewards. Then in order to calculate a policy p(a|s), you need to calculate a value functions v_{\pi}(s). v_{\pi}(s) is a function of how good it is to be in a given state s, under a policy \pi. That means it is likely you get higher return starting from s, when v_{\pi}(s) is high. As illustrated in the figure below, values and policies, which are two major elements of RL, are updated interactively until they converge to an optimal value or an optimal policy. The optimal policy and the optimal value are denoted as v_{\ast} and \pi_{\ast} respectively.

Dynamic programming (DP) is a family of algorithms which is effective for calculating the optimal value v_{\ast} and the optimal policy \pi_{\ast} when the complete model of the environment is given. Whether in my articles or not, the rest of discussions on RL are more or less based on DP. RL can be viewed as a method of achieving the same effects as DP when the model of the environment is not known. And I would say the effects of imitating DP are often referred to as trial and errors in many simplified explanations on RL. If you have studied some basics of computer science, I am quite sure you have encountered DP problems. With DP, in many problems on textbooks you find optimal paths of a graph from a start to a goal, through which you can maximizes the sum of scores of edges you pass. You might remember you could solve those problems in recursive ways, but I think many people have just learnt very limited cases of DP. For the time being I would like you to forget such DP you might have learned and comprehend it as something you newly start learning in the context of RL.

*As a more advances application of DP, you might have learned string matching. You can calculated how close two strings of characters are with DP using string matching.

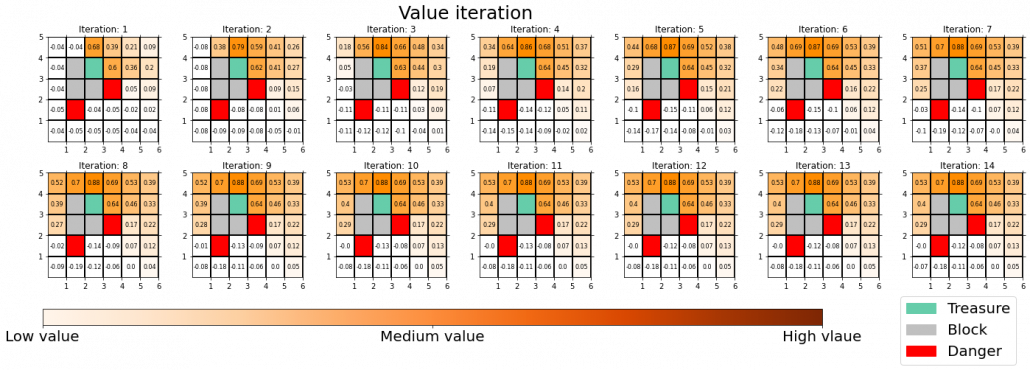
The way of calculating v_{\pi}(s) and \pi(a|s) with DP can be roughly classified to two types, policy-based and value-based. Especially in the contexts of DP, the policy-based one is called policy iteration, and the values-based one is called value iteration. The biggest difference between them is, in short, policy iteration updates a policy every times step, but value iteration does it only at the last time step. I said you alternate between updating v_{\pi}(s) and \pi(a|s), but in fact that is only true of policy iteration. Value iteration updates a value function v(s). Before formulating these algorithms, I think it will be effective to take a look at how values and policies are actually updated in a very simple case. I would like to introduce a very good tool for visualizing value/policy iteration. You can customize a grid map and place either of “Treasure,” “Danger,” and “Block.” You can choose probability of transition and either of settings, “Policy Iteration” or “Values Iteration.” Let me take an example of conducting DP on a gird map like below. Whichever of “Policy Iteration” or “Values Iteration” you choose, you would get numbers like below. Each number in each cell is the value of each state, and you can see that when you are on states with high values, you are more likely to reach the “treasure” and avoid “dangers.” But I bet this chart does not make any sense if you have not learned RL yet. I prepared some code for visualizing the process of DP on this simulator. The code is available in this link.

*In the book by Sutton and Barto, when RL/DP is discussed at an implementation level, the estimated values of v_{\pi}(s) or v_{\ast}(s) can be denoted as an array V or V_t. But I would like you take it easy while reading my articles. I will repeatedly mentions differences of notations when that matters.

*Remember that at the beginning of studying RL, only super easy cases are considered, so a V is usually just a NumPy array or an Excel sheet.
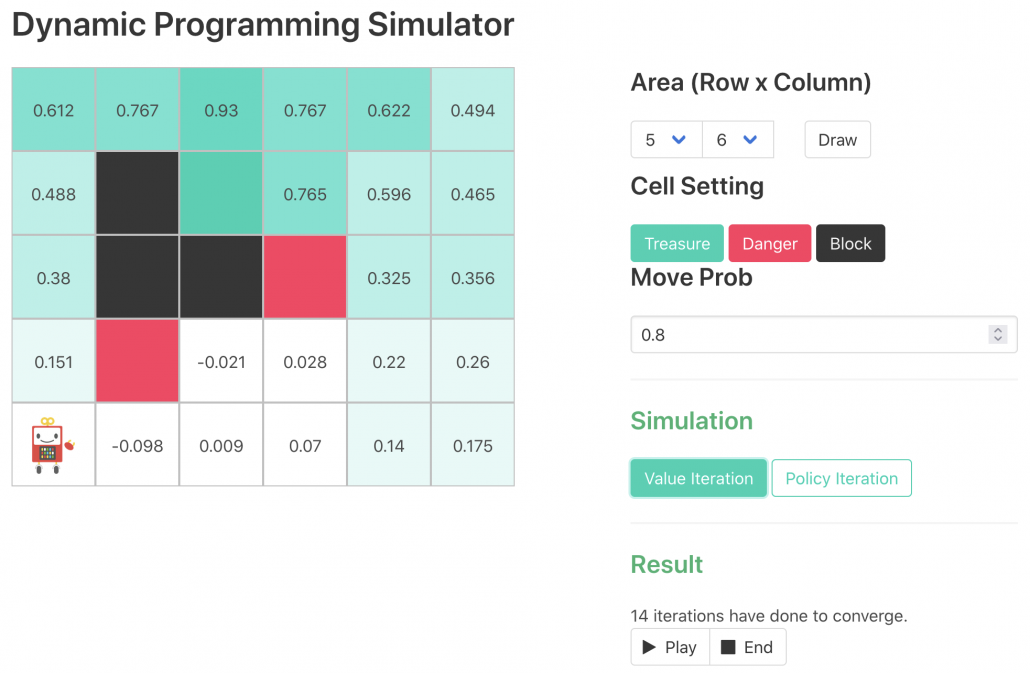
*The chart above might be also misleading since there is something like a robot at the left bottom corner, which might be an agent. But the agent does not actually move around the environment in planning problems because it has a perfect model of the environment in the head.

The visualization I prepared is based on the implementation of the simulator, so they would give the same outputs. When you run policy iteration in the map, the values and polices are updated as follows. The arrow in each cell is the policy in the state. At each time step the arrows is calculated in a greedy way, and each arrow at each state shows the direction in which the agent is likely to get the highest reward. After 3 iterations, the policies and values converge, and with the policies you can navigate yourself to the “Treasure,” avoiding “Dangers.”
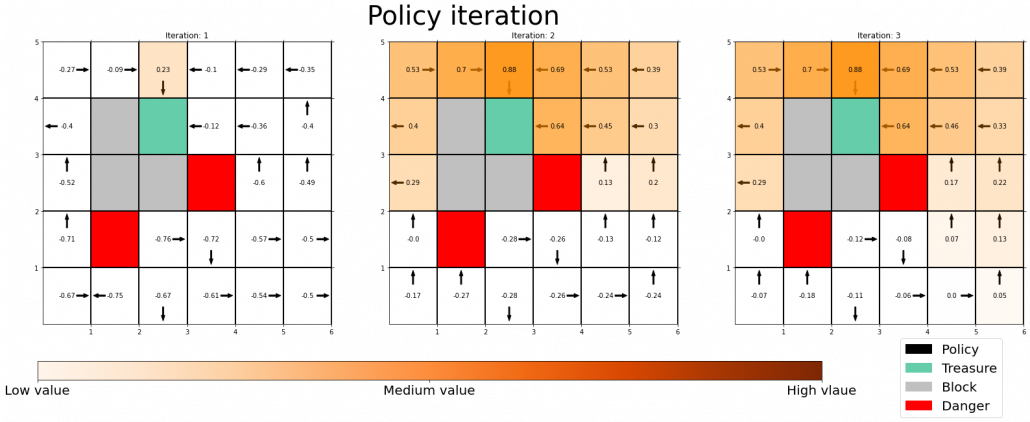
*I am not sure why policies are incorrect at the most left side of the grid map. I might need some modification of code.

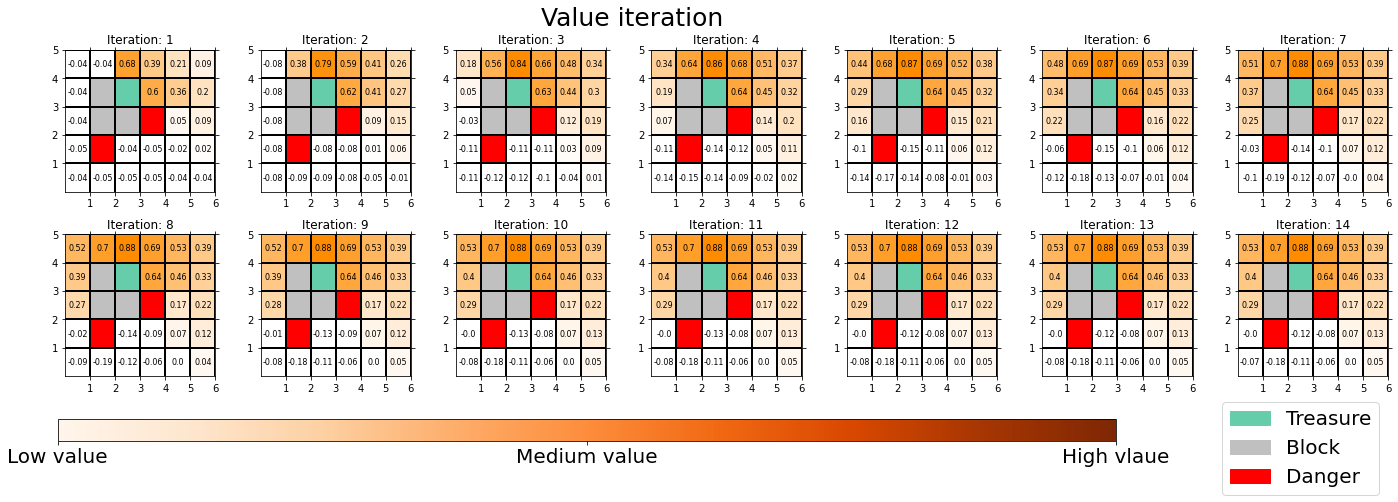
You can also update values without modifying policies as the chart below. In this case only the values of cells are updated. This is value-iteration, and after this iteration converges, if you transit to an adjacent cell with the highest value at each cell, you can also navigate yourself to the “treasure,” avoiding “dangers.”
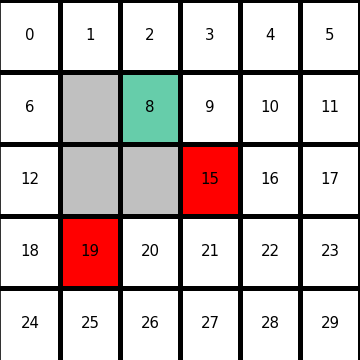
I would like to start formulating DP little by little,based on the notations used in the RL book by Sutton. From now on, I would take an example of the 5 \times 6 grid map which I visualized above. In this case each cell is numbered from 0 to 29 as the figure below. But the cell 7, 13, 14 are removed from the map. In this case \mathcal{S} = {0, 1, 2, 3, 4, 6, 8, 9, 10, 11, 12, 15, 16, 17, 18, 19, 20, 21, 22, 23, 24, 25, 26, 27, 28, 29}, and \mathcal{A} = \{\uparrow, \rightarrow, \downarrow, \leftarrow \}. When you pass s=8, you get a reward r_{treasure}=1, and when you pass the states s=15 or s=19, you get a reward r_{danger}=-1. Also, the agent is encouraged to reach the goal as soon as possible, thus the agent gets a regular reward of r_{regular} = - 0.04 every time step.

In the last section, I mentioned that the purpose of RL is to find the optimal policy which maximizes a return, the sum of upcoming reward R_t. A return is calculated as follows.

R_{t+1} + R_{t+2} +  R_{t+3} + \cdots + R_T

In RL a return is estimated in probabilistic ways, that is, an expectation of the return given a state S_t = s needs to be considered. And this is the value of the state. Thus the value of a state S_t = s is calculated as follows.

\mathbb{E}_{\pi}\bigl[R_{t+1} + R_{t+2} +  R_{t+3} + \cdots + R_T | S_t = s \bigr]

In order to roughly understand how this expectation is calculated let’s take an example of the 5 \times 6 grid map above. When the current state of an agent is s=10, it can take numerous patterns of actions. For example (a) 10 - 9 - 8 - 2 , (b) 10-16-15-21-20-19, (c) 10-11-17-23-29-\cdots. The rewards after each behavior is calculated as follows.

  • If you take a you take the course (a) 10 - 9 - 8 - 2, you get a reward of r_a = -0.04 -0.04 + 1 -0.04 in total. The probability of taking a course of a) is p_a = \pi(A_t = \leftarrow | S_t = 10) \cdot p(S_{t+1} = 9 |S_t = 10, A_t = \leftarrow ) \cdot \pi(A_{t+1} = \leftarrow | S_{t+1} = 9) \cdot p(S_{t+2} = 8 |S_{t+1} = 9, A_{t+1} = \leftarrow ) \cdot \pi(A_{t+2} = \uparrow | S_{t+2} = 8) \cdot p(S_{t+3} = 2 | S_{t+2} = 8, A_{t+2} = \uparrow )
  • Just like the case of (a), the reward after taking the course (b) is r_b = - 0.04 -0.04 -1 -0.04 -0.04 -0.04 -1. The probability of taking the action can be calculated in the same way as p_b = \pi(A_t = \downarrow | S_t = 10) \cdot p(S_{t+1} = 16 |S_t = 10, A_t = \downarrow ) \cdots \pi(A_{t+4} = \leftarrow | S_{t+4} = 20) \cdot p(S_{t+5} = 19 |S_{t+4} = 20, A_{t+4} = \leftarrow ).
  • The rewards and the probability of the case (c) cannot be calculated because future behaviors of the agent is not confirmed.

Assume that (a) and (b) are the only possible cases starting from s, under the policy \pi, then the the value of s=10 can be calculated as follows as a probabilistic sum of rewards of each behavior (a) and (b).

\mathbb{E}_{\pi}\bigl[R_{t+1} + R_{t+2} +  R_{t+3} + \cdots + R_T | S_t = s \bigr] = r_a \cdot p_a + r_b \cdot p_b

But obviously this is not how values of states are calculated in general. Starting from a state a state s=10, not only (a) and (b), but also numerous other behaviors of agents can be considered. Or rather, it is almost impossible to consider all the combinations of actions, transition, and next states. In practice it is quite difficult to calculate a sequence of upcoming rewards R_{t+1}, \gamma R_{t+2}, R_{t+3} \cdots,and it is virtually equal to considering all the possible future cases.A very important formula named the Bellman equation effectively formulate that.

3, The Bellman equation and convergence of value functions

The Bellman equation enables estimating values of states considering future countless possibilities with the following two ideas.

  1.  Returns are calculated recursively.
  2.  Returns are calculated in probabilistic ways.

First of all, I have to emphasize that a discounted return is usually used rather than a normal return, and a discounted one is defined as below

G_t \doteq R_{t+1} + \gamma R_{t+2} + \gamma ^2 R_{t+3} + \cdots + \gamma ^ {T-t-1} R_T = \sum_{k=0}^{T-t-1}{\gamma ^{k}R_{t+k+1}}

, where \gamma \in (0, 1] is a discount rate. (1)As the first point above, the discounted return can be calculated recursively as follows: G_t = R_{t + 1} + \gamma R_{t + 2} + \gamma ^2 R_{t + 2} + \gamma ^3 R_{t + 3} + \cdots = R_{t + 1} + \gamma (R_{t + 2} + \gamma R_{t + 2} + \gamma ^2 R_{t + 3} + \cdots ) = R_{t + 1} + \gamma G_{t+1}. You can postpone calculation of future rewards corresponding to G_{t+1} this way. This might sound obvious, but this small trick is crucial for defining defining value functions or making update rules of them. (2)The second point might be confusing to some people, but it is the most important in this section. We took a look at a very simplified case of calculating the expectation in the last section, but let’s see how a value function v_{\pi}(s) is defined in the first place.

v_{\pi}(s) \doteq \mathbb{E}_{\pi}\bigl[G_t | S_t = s \bigr]

This equation means that the value of a state s is a probabilistic sum of all possible rewards taken in the future following a policy \pi. That is, v_{\pi}(s) is an expectation of the return, starting from the state s. The definition of a values v_{\pi}(s) is written down as follows, and this is what \mathbb{E}_{\pi} means.

v_{\pi} (s)= \sum_{a}{\pi(a|s) \sum_{s', r}{p(s', r|s, a)\bigl[r + \gamma v_{\pi}(s')\bigr]}}

This is called Bellman equation, and it is no exaggeration to say this is the foundation of many of upcoming DP or RL ideas. Bellman equation can be also written as \sum_{s', r, a}{\pi(a|s) p(s', r|s, a)\bigl[r + \gamma v_{\pi}(s')\bigr]}. It can be comprehended this way: in Bellman equation you calculate a probabilistic sum of r +v_{\pi}(s'), considering all the possible actions of the agent in the time step. r +v_{\pi}(s') is a sum of the values of the next state s' and a reward r, which you get when you transit to the state s' from s. The probability of getting a reward r after moving from the state s to s', taking an action a is \pi(a|s) p(s', r|s, a). Hence the right side of Bellman equation above means the sum of \pi(a|s) p(s', r|s, a)\bigl[r + \gamma v_{\pi}(s')\bigr], over all possible combinations of s', r, and a.

*I would not say this equation is obvious, and please let me explain a proof of this equation later.

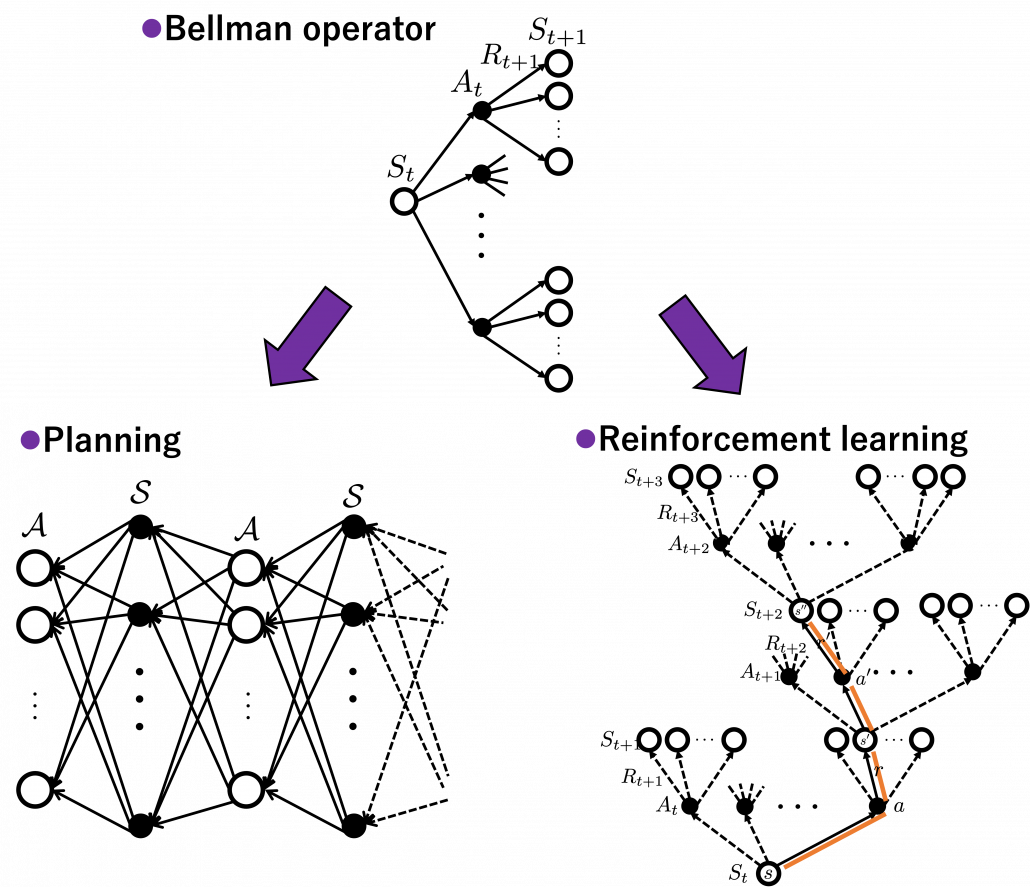
The following figures are based on backup diagrams introduced in the book by Sutton and Barto. As we have just seen, Bellman expectation equation calculates a probabilistic summation of r + v(s'). In order to calculate the expectation, you have to consider all the combinations of s', r, and a. The backup diagram at the left side below shows the idea as a decision-tree-like graph, and strength of color of each arrow is the probability of taking the path.
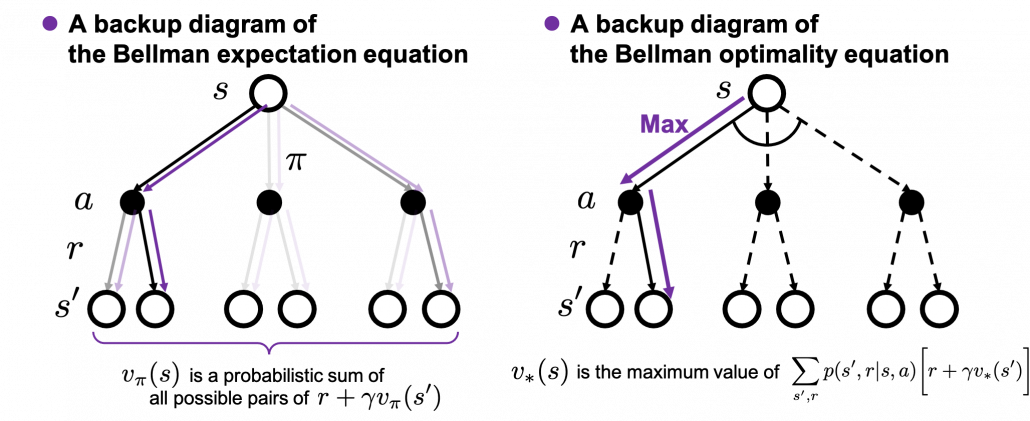
The Bellman equation I have just introduced is called Bellman expectation equation to be exact. Like the backup diagram at the right side, there is another type of Bellman equation where you consider only the most possible path. Bellman optimality equation is defined as follows.

v_{\ast}(s) \doteq \max_{a} \sum_{s', r}{p(s', r|s, a)\bigl[r + \gamma v_{\ast}(s')\bigr]}

I would like you to pay attention again to the fact that in definitions of Bellman expectation/optimality equations, v_{\pi}(s)/v_{\ast}(s) is defined recursively with v_{\pi}(s)/v_{\ast}(s). You might have thought how to calculate v_{\pi}(s)/v_{\ast}(s) is the problem in the first place.

As I implied in the first section of this article, ideas behind how to calculate these v_{\pi}(s) and v_{\ast}(s) should be discussed more precisely. Especially how to calculate v_{\pi}(s) is a well discussed topic in RL, including the cases where data is sampled from an unknown environment model. In this article we are discussing planning problems, where a model an environment is known. In planning problems, that is DP problems where all the probabilities of transition p(s', r | s, a) are known, a major way of calculating v_{\pi}(s) is iterative policy evaluation. With iterative policy evaluation a sequence of value functions (v_0(s), v_1(s), \dots , v_{k-1}(s), v_{k}(s)) converges to v_{\pi}(s) with the following recurrence relation

v_{k+1}(s) =\sum_{a}{\pi(a|s)\sum_{s', r}{p(s', r | s, a) [r + \gamma v_k (s')]}}.

Once v_{k}(s) converges to v_{\pi}(s), finally the equation of the definition of v_{\pi}(s) holds as follows.

v_{\pi}(s) =\sum_{a}{\pi(a|s)\sum_{s', r}{p(s', r | s, a) [r + \gamma v_{\pi} (s')]}}.

The convergence to v_{\pi}(s) is like the graph below. If you already know how to calculate forward propagation of a neural network, this should not be that hard to understand. You just expand recurrent relation of v_{k}(s) and v_{k+1}(s) from the initial value at k=0 to the converged state at k=K. But you have to be careful abut the directions of the arrows in purple. If you correspond the backup diagrams of the Bellman equation with the graphs below, the purple arrows point to the reverse side to the direction where the graphs extend. This process of converging an arbitrarily initialized v_0(s) to v_{\pi}(s) is called policy evaluation.

*\mathcal{S}, \mathcal{A} are a set of states and actions respectively. Thus |\mathcal{S}|, the size of  \mathcal{S} is the number of white nodes in each layer, and |\mathcal{S}| the number of black nodes.

The same is true of the process of calculating an optimal value function v_{\ast}. With the following recurrence relation

v_{k+1}(s) =\max_a\sum_{s', r}{p(s', r | s, a) [r + \gamma v_k (s')]}

(v_0(s), v_1(s), \dots , v_{k-1}(s), v_{k}(s)) converges to an optimal value function v_{\ast}(s). The graph below visualized the idea of convergence.

4, Pseudocode of policy iteration and value iteration

I prepared pseudocode of each algorithm based on the book by Sutton and Barto. These would be one the most typical DP algorithms you would encounter while studying RL, and if you just want to implement RL by yourself, these pseudocode would enough. Or rather these would be preferable to other more general and abstract pseudocode. But I would like to avoid explaining these pseudocode precisely because I think we need to be more conscious about more general ideas behind DP, which I am going to explain in the next article. I will cover only the important points of these pseudocode, and I would like to introduce some implementation of the algorithms in the latter part of next article. I think you should briefly read this section and come back to this section section or other study materials after reading the next article. In case you want to check the algorithms precisely, you could check the pseudocode I made with LaTeX in this link.

The biggest difference of policy iteration and value iteration is the timings of updating a policy. In policy iteration, a value function v(s) and \pi(a|s) are arbitrarily initialized. (1)The first process is policy evaluation. The policy \pi(a|s) is fixed, and the value function v(s) approximately converge to v_{\pi}(s), which is a value function on the policy \pi. This is conducted by the iterative calculation with the reccurence relation introduced in the last section.(2) The second process is policy improvement. Based on the calculated value function v_{\pi}(s), the new policy \pi(a|s) is updated as below.

\pi(a|s) \gets\text{argmax}_a {r + \sum_{s', r}{p(s', r|s, a)[r + \gamma V(s')]}}, \quad \forall s\in \mathcal{S}

The meaning of this update rule of a policy is quite simple: \pi(a|s) is updated in a greedy way with an action a such that r + \sum_{s', r}{p(s', r|s, a)[r + \gamma V(s')]} is maximized. And when the policy \pi(a|s) is not updated anymore, the policy has converged to the optimal one. At least I would like you to keep it in mind that a while loop of itrative calculation of v_{\pi}(s) is nested in another while loop. The outer loop continues till the policy is not updated anymore.
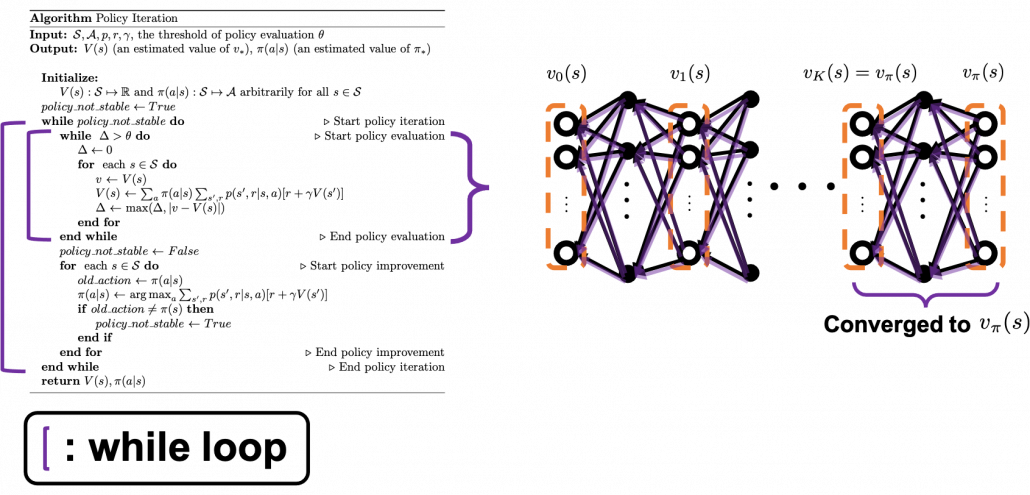
On the other hand in value iteration, there is mainly only one loop of updating  v_{k}(s), which converge to v_{\ast}(s). And the output policy is the calculated the same way as policy iteration with the estimated optimal value function. According to the book by Sutton and Barto, value iteration can be comprehended this way: the loop of value iteration is truncated with only one iteration, and also policy improvement is done only once at the end.
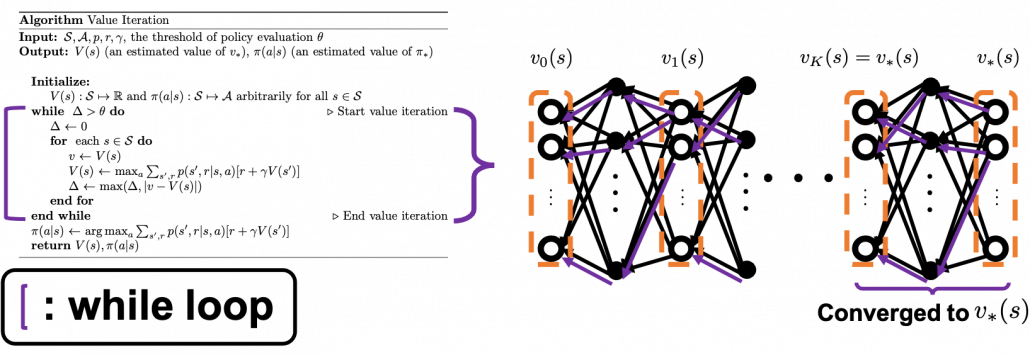
As I repeated, I think policy iteration is more than just a single algorithm. And relations of values and policies should be discussed carefully rather than just following pseudocode. And whatever RL algorithms you learn, I think more or less you find some similarities to policy iteration. Thus in the next article, I would like to introduce policy iteration in more abstract ways. And I am going to take a rough look at various major RL algorithms with the keywords of “values” and “policies” in the next article.

Appendix

I mentioned the Bellman equation is nothing obvious. In this section, I am going to introduce a mathematical derivation, which I think is the most straightforward. If you are allergic to mathematics, the part blow is not recommendable, but the Bellman equation is the core of RL. I would not say this is difficult, and if you are going to read some texts on RL including some equations, I think mastering the operations I explain below is almost mandatory.

First of all, let’s organize some important points. But please tolerate inaccuracy of mathematical notations here. I am going to follow notations in the book by Sutton and Barto.

  • Capital letters usually denote random variables. For example X, Y,Z, S_t, A_t, R_{t+1}, S_{t+1}. And corresponding small letters are realized values of the random variables. For example x, y, z, s, a, r, s'. (*Please do not think too much about the number of 's on the small letters.)
  • Conditional probabilities in general are denoted as for example \text{Pr}\{X=x, Y=y | Z=z\}. This means the probability of x, y are sampled given that z is sampled.
  • In the book by Sutton and Barto, a probilistic funciton p(\cdot) means a probability of transition, but I am using p(\cdot) to denote probabilities in general. Thus p( s', a, r | s) shows the probability that, given an agent being in state s at time t, the agent will do action a, AND doing this action will cause the agent to proceed to state s' at time t+1, and receive reward r. p( s', a, r | s) is not defined in the book by Barto and Sutton.
  • The following equation holds about any conditional probabilities: p(x, y|z) = p(x|y, z)p(y|z). Thus importantly, p(s', a, r|s) = p(s', r| s, a)p(a|s)=p(s', r' | s, a)\pi(a|s)
  • When random variables X, Y are discrete random variables, a conditional expectation of X given Y=y is calculated as follows: \mathbb{E}[X|Y=y] = \sum_{x}{p(x|Y=y)}.

Keeping the points above in mind, let’s get down on business. First, according to definition of a value function on a policy pi and linearity of an expectation, the following equations hold.

v_{\pi}(s) = \mathbb{E} [G_t | S_t =s] = \mathbb{E} [R_{t+1} + \gamma G_{t+1} | S_t =s]

=\mathbb{E} [R_{t+1} | S_t =s] + \gamma \mathbb{E} [G_{t+1} | S_t =s]

Thus we need to calculate \mathbb{E} [R_{t+1} | S_t =s] and \mathbb{E} [G_{t+1} | S_t =s]. As I have explained \mathbb{E} [R_{t+1} | S_t =s] is the sum of p(s', a, r |s) r over all the combinations of (s', a, r). And according to one of the points above, p(s', a, r |s) = p(s', r | s, a)p(a|s)=p(s', r' | s, a)\pi(a|s). Thus the following equation holds.

\mathbb{E} [R_{t+1} | S_t =s] = \sum_{s', a, r}{p(s', a, r|s)r} = \sum_{s', a, r}{p(s', r | s, a)\pi(a|s)r}.

Next we have to calculate

\mathbb{E} [G_{t+1} | S_t =s]

= \mathbb{E} [R_{t + 2} + \gamma R_{t + 3} + \gamma ^2 R_{t + 4} + \cdots | S_t =s]

= \mathbb{E} [R_{t + 2}  | S_t =s] + \gamma \mathbb{E} [R_{t + 2} | S_t =s]  + \gamma ^2\mathbb{E} [ R_{t + 4} | S_t =s]  +\cdots.

Let’s first calculate \mathbb{E} [R_{t + 2}  | S_t =s]. Also \mathbb{E} [R_{t + 3}  | S_t =s] is a sum of p(s'', a', r', s', a, r|s)r' over all the combinations of (s”, a’, r’, s’, a, r).

\mathbb{E}_{\pi} [R_{t + 2}  | S_t =s] =\sum_{s'', a', r', s', a, r}{p(s'', a', r', s', a, r|s)r'}

=\sum_{s'', a', r', s', a, r}{p(s'', a', r'| s', a, r, s)p(s', a, r|s)r'}

=\sum_{ s', a, r}{p(s', a, r|s)} \sum_{s'', a', r'}{p(s'', a', r'| s', a, r, s)r'}

I would like you to remember that in Markov decision process the next state S_{t+1} and the reward R_t only depends on the current state S_t and the action A_t at the time step.

Thus in variables s', a, r, s, only s' have the following variables r', a', s'', r'', a'', s''', \dots.  And again p(s', a, r |s) = p(s', r | s, a)p(a|s). Thus the following equations hold.

\mathbb{E}_{\pi} [R_{t + 2}  | S_t =s]=\sum_{ s', a, r}{p(s', a, r|s)} \sum_{s'', a', r'}{p(s'', a', r'| s', a, r', s)r'}

=\sum_{ s', a, r}{p(s', r|a, s)\pi(a|s)} \sum_{s'', a', r'}{p(s'', a', r'| s')r'}

= \sum_{ s', a, r}{p(s', r|a, s)\pi(a|s)} \mathbb{E}_{\pi} [R_{t+2}  | s'].

\mathbb{E}_{\pi} [R_{t + 3}  | S_t =s] can be calculated the same way.

\mathbb{E}_{\pi}[R_{t + 3}  | S_t =s] =\sum_{s''', a'', r'', s'', a', r', s', a, r}{p(s''', a'', r'', s'', a', r', s', a, r|s)r''}

=\sum_{s''', a'', r'', s'', a', r', s', a, r}{p(s''', a'', r'', s'', a', r'| s', a, r, s)p(s', a, r|s)r''}

=\sum_{ s', a, r}{p(s', a, r|s)} \sum_{s''', a'' r'', s'', a', r'}{p(s''', a'', r'', s'', a', r'| s', a, r, s)r''}

=\sum_{ s', a, r}{ p(s', r | s, a)p(a|s)} \sum_{s''', a'' r'', s'', a', r'}{p(s''', a'', r'', s'', a', r'| s')r''}

=\sum_{ s', a, r}{ p(s', r | s, a)p(a|s)} \mathbb{E}_{\pi} [R_{t+3}  | s'].

The same is true of calculating \mathbb{E}_{\pi} [R_{t + 4}  | S_t =s], \mathbb{E}_{\pi} [R_{t + 5}  | S_t =s]\dots.  Thus

v_{\pi}(s) =\mathbb{E} [R_{t+1} | S_t =s] + \gamma \mathbb{E} [G_{t+1} | S_t =s]

=\sum_{s', a, r}{p(s', r | s, a)\pi(a|s)r} + \mathbb{E} [R_{t + 2}  | S_t =s] + \gamma \mathbb{E} [R_{t + 3} | S_t =s]  + \gamma ^2\mathbb{E} [ R_{t + 4} | S_t =s]  +\cdots

=\sum_{s, a, r}{p(s', r | s, a)\pi(a|s)r} +\sum_{ s', a, r}{p(s', r|a, s)\pi(a|s)} \mathbb{E}_{\pi} [R_{t+2}  |S_{t+1}= s'] +\gamma \sum_{ s', a, r}{ p(s', r | s, a)p(a|s)} \mathbb{E}_{\pi} [R_{t+3} |S_{t+1} =  s'] +\gamma^2 \sum_{ s', a, r}{ p(s', r | s, a)p(a|s)} \mathbb{E}_{\pi} [ R_{t+4}|S_{t+1} =  s'] + \cdots

=\sum_{ s', a, r}{ p(s', r | s, a)p(a|s)} [r + \mathbb{E}_{\pi} [\gamma R_{t+2}+ \gamma R_{t+3}+\gamma^2R_{t+4} + \cdots |S_{t+1} =  s'] ]

=\sum_{ s', a, r}{ p(s', r | s, a)p(a|s)} [r + \mathbb{E}_{\pi} [G_{t+1} |S_{t+1} =  s'] ]

=\sum_{ s', a, r}{ p(s', r | s, a)p(a|s)} [r + v_{\pi}(s') ]

Understanding the “simplicity” of reinforcement learning: comprehensive tips to take the trouble out of RL

*I adjusted mathematical notations in this article as close as possible to “Reinforcement Learning:An Introduction.”  This book by Sutton and Barto is said to be almost mandatory for those who studying reinforcement learning. Also I tried to avoid as much mathematical notations, introducing some intuitive examples. In case any descriptions are confusing or unclear, informing me of that via posts or email would be appreciated.

Preface

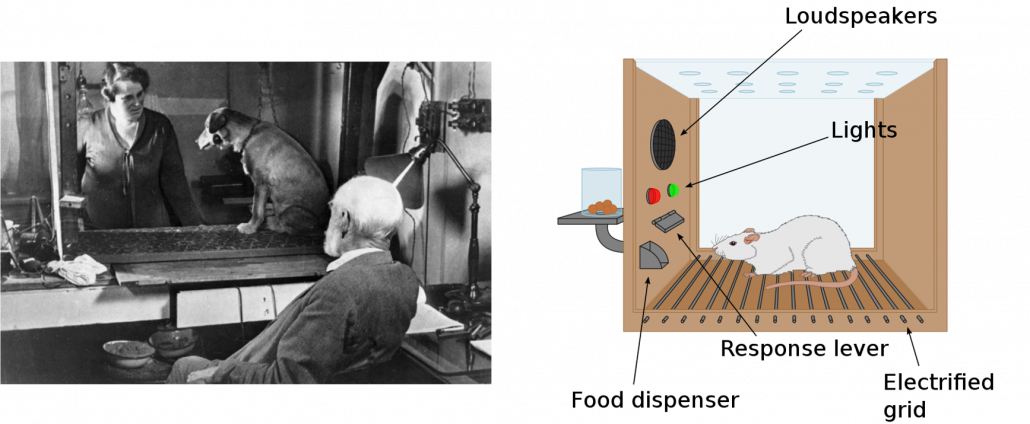
First of all, I have to emphasize that I am new to reinforcement learning (RL), and my current field is object detection, to be more concrete transfer learning in object detection. Thus this article series itself is also a kind of study note for me. Reinforcement learning (RL) is often briefly compared with human trial and errors, and actually RL is based on neuroscience or psychology as well as neural networks (I am not sure about these fields though). The word “reinforcement” roughly means associating rewards with certain actions. Some experiments of RL were conducted on animals, which are widely known as Skinner box or more classically Pavlov’s Dogs. In short, you can encourage animals to do something by giving foods to them as rewards, just as many people might have done to their dogs. Before animals find linkages between certain actions and foods as rewards to those actions, they would just keep trial and errors. We can think of RL as a family of algorithms which mimics this behavior of animals trying to obtain as much reward as possible.

*My cats will not all the way try to entertain me to get foods though.

RL showed its conspicuous success in the field of video games, such as Atari, and defeating the world champion of Go, one of the most complicated board games. Actually RL can be applied to not only video games or board games, but also various other fields, such as business intelligence, medicine, and finance, but still I am very much fascinated by its application on video games. I am now studying the field which could bridge between the world of video games and the real world. I would like to mention this in the one of upcoming articles.

So far I got an impression that learning RL ideas would be more challenging than learning classical machine learning or deep learning for the following reasons.

  1. RL is a field of how to train models, rather than how to design the models themselves. That means you have to consider a variety of problem settings, and you would often forget which situation you are discussing.
  2. You need prerequisites knowledge about the models of components of RL for example neural networks, which are usually main topics in machine/deep learning textbooks.
  3. It is confusing what can be learned through RL depending on the types of tasks.
  4. Even after looking over at formulations of RL, it is still hard to imagine how RL enables computers to do trial and errors.

*For now I would like you to keep it in mind that basically values and policies are calculated during in during RL.

And I personally believe you should always keep the following points in your mind in order not to be at a loss in the process of learning RL.

  1.  RL basically can be only applied to a very limited type of situation, which is called Markov decision process (MDP). In MDP settings your next state depends only on your current state and action, regardless of what you have done so far.
  2. You are ultimately interested in learning decision making rules in MDP, which are called policies.
  3. In the first stage of learning RL, you consider surprisingly simple situations. They might be simple like mazes in kids’ picture books.
  4. RL is in its early days of development.

Let me explain a bit more about what I meant by the third point above. I have been learning RL mainly with a very precise Japanese textbook named 「機械学習プロフェッショナルシリーズ 強化学習」(Machine Learning Professional Series: Reinforcement Learning). As I mentioned in an article of my series on RNN, I sometimes dislike Western textbooks because they tend to beat around the bush with simple examples to get to the point at a more abstract level. That is why I prefer reading books of this series in Japanese. And especially the RL one in the series was especially bulky and so abstract and overbearing to a spectacular degree. It had so many precise mathematical notations without leaving room for ambiguity, thus it took me a long time to notice that the book was merely discussing simple situations like mazes in kids’ picture books. I mean, the settings discussed were so simple that they can be expressed as tabular data, that is some Excel sheets.

*I could not notice that until the beginning of 6th chapter out of eight out of 8 chapters. The 6th chapter discusses uses of function approximators. With the approximations you can approximate tabular data. My articles will not dig this topic of approximation precisely, but the use of deep learning models, which I am going to explain someday, is a type of this approximation of RL models.

You might find that so many explanations on RL rely on examples of how to make computers navigate themselves in simple mazes or in playing video games, which are mostly impractical in the real world. However, as I will explain later, these are actually helpful examples to learn RL. As I show later, the relations of an agent and an environment are basically the same also in more complicated tasks. Reading some code or actually implementing RL would be very effective, especially in order to know simplicity of the situations in the beginning part of RL textbooks.

Given that you can do a lot of impressive and practical stuff with current deep learning libraries, you might get bored or disappointed by simple applications of RL in many textbooks. But as I mentioned above, RL is in its early days of development, at least at a public level. And in order to show its potential power, I am going to explain one of the most successful and complicated application of RL in the next article: I am planning to explain how AlphaGo or AplhaZero, RL-based AIs enabled computers to defeat the world champion of Go, one of the most complicated board games.

*RL was not used to the chess AI which defeated Kasparov in 1997. Combination of decision trees and super computers, without RL, was enough for the “simplicity” of chess. But uses of decision tree named Monte Carlo Tree Search enabled Alpha Go to read some steps ahead more effectively.  It is said deep learning enabled AlphaGo to have intuition about games. Mote Carlo Tree Search enabled it to have abilities to predict some steps ahead, and RL how to learn from experience.

1. What is RL?

In conclusion I would interpret RL as follows: RL is a sub-field of training AI models, and optimal rules for decision makings in an environment are learned through RL, weakly supervised by rewards in a certain period of time. When and how to evaluate decision makings are task-specific, and they are often realized by trial-and-error-like behaviors of agents. Rules for decision makings are called policies in contexts of RL. And optimization problems of policies are called sequential decision-making problems.

You are more or less going to see what I meant by my definition throughout my article series.

*An agent in RL means an entity which makes decisions, interacting with the environment with an action. And the actions are made based on policies.

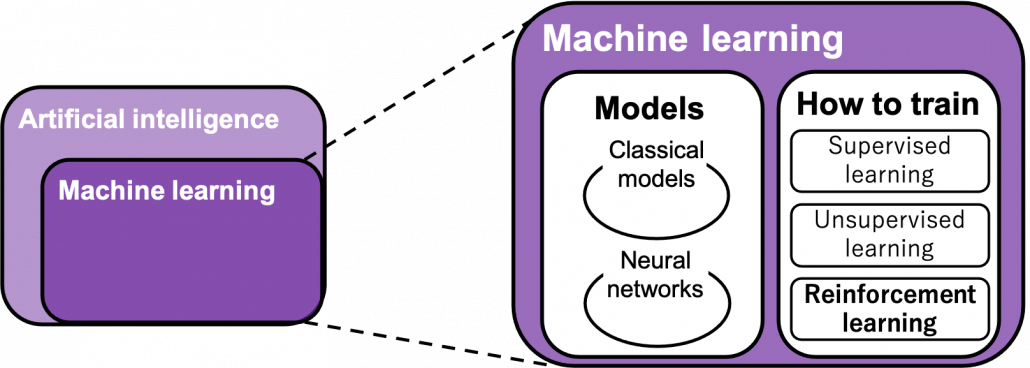
You can find various types of charts explaining relations of RL with AI, and I personally found the chart below the most plausible.

“Models” in the chart are often hyped as “AI” in media today. But AI is a more comprehensive field of trying to realize human-like intellectual behaviors with computers. And machine learning have been the most central sub-field of AI last decades. Around 2006 there was a breakthrough of deep learning. Due to the breakthrough machine learning gained much better performance with deep learning models. I would say people have been calling popular “models” in each time “AI.” And importantly, RL is one field of training models, besides supervised learning and unsupervised learning, rather than a field of designing “AI” models. Some people say supervised learning or unsupervised learning are more preferable than RL because currently these trainings are more likely to be more successful in wide range of fields than RL. And usually the more data you have the more likely supervised or unsupervised learning are.
*The word “models” are used in another meaning later. Please keep it in mind that the “models” above are something like general functions. And the “models” which show up frequently later are functions modeling environments in RL.

*In case you’re totally new to AI and don’t understand what “supervising” means in these contexts, I think you should imagine cases of instructing students in schools. If a teacher just tells students “We have a Latin conjugation test next week, so you must check this section in the textbook.” to students, that’s a “supervised learning.” Students who take exams are “models.” Apt students like machine learning models would show excellent performances, but they might fail to apply the knowledge somewhere else. I mean, they might fail to properly conjugate words in unseen sentences. Next, if the students share an idea “It’s comfortable to get together with people alike.” they might be clustered to several groups. That might lead to “cool guys” or “not cool guys” group division. This is done without any explicit answers, and this corresponds to “unsupervised learning.” In this case, I would say a certain functions of the students’ brain or atmosphere there, which put similar students together, were the “models.” And finally, if teachers tell the students “Be a good student,” that’s what I meant with “weakly supervising.” However most people would say “How?” RL could correspond to such ultimate goals of education, and as well as education, you have to consider how to give rewards and how to evaluate students/agents. And “models” can vary. But such rewards often shows unexpected results.

2. RL and Markov decision process

As I mentioned in a former section, you have to keep it in mind that RL basically can be applied to a limited situation of sequential decision-making problems, which are called Markov decision processes (MDP). A markov decision process is a type of process where the next state of an agent depends only on the current state and the action taken in the current state. I would only roughly explain MDP in this article with a little formulation.

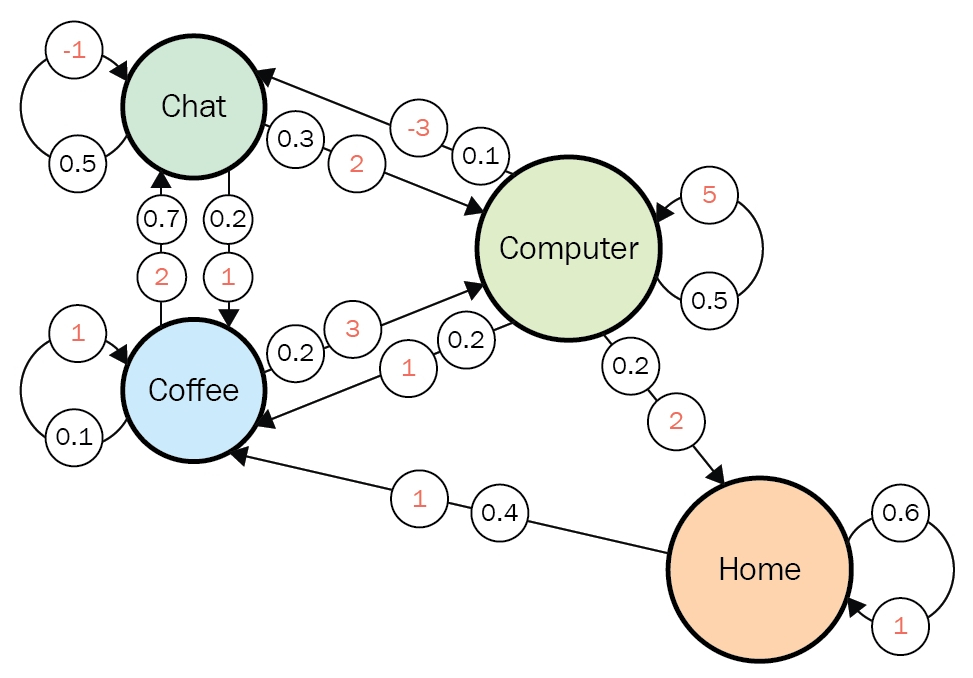
You might find MDPs very simple. But some people would find that their daily lives in fact can be described well with a MDP. The figure below is a state transition diagram of everyday routine at an office, and this is nothing but a MDP. I think many workers also basically have only four states “Chat” “Coffee” “Computer” and “Home” almost everyday.  Numbers in black are possibilities of transitions at the state, and each corresponding number in orange is the reward you get when the action is taken. The diagram below shows that when you just keep using a computer, you would likely to get high rewards. On the other hand chatting with your colleagues would just continue to another term of chatting with a probability of 50%, and that undermines productivity by giving out the reward of -1. And having some coffee is very likely to lead to a chat. In practice, you optimize which action to take in each situation. You adjust probabilities at each state, that is you adjust a policy, through planning or via trial and error.

Source: https://subscription.packtpub.com/book/data/9781788834247/1/ch01lvl1sec12/markov-decision-processes

*Even if you say “Be a good student,” school kids in puberty they would act far from Markov decision process. Even though I took an example of school earlier, I am sure education should be much more complicated process which requires constant patience.

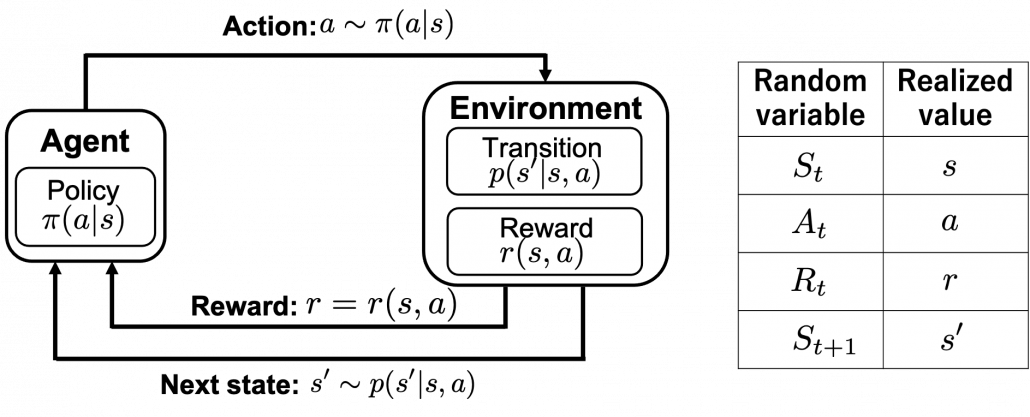
Of course you have to consider much more complicated MDPs in most RL problems, and in most cases you do not have known models like state transition diagrams. Or rather I have to say RL enables you to estimate such diagrams, which are usually called models in contexts of RL, by trial and errors. When you study RL, for the most part you will see a chart like below. I think it is important to understand what this kind of charts mean, whatever study materials on RL you consult. I said RL is basically a training method for finding optimal decision making rules called policies. And in RL settings, agents estimate such policies by taking actions in the environment. The environment determines a reward and the next state based on the current state and the current action of the agent.

Let’s take a close look at the chart above in a bit mathematical manner. I made it based on “Machine Learning Professional Series: Reinforcement Learning.” The agent exert an action a in the environment, and the agent receives a reward r and the next state s'. r and s' are consequences of taking the action a in the state s. The action a is taken based on a conditional probability given s, which is denoted as \pi(a|s). This probability function \pi(a|s) is the very function representing policies, which we want to optimize in RL.

*Please do not think too much about differences of \sim and = in the chart. Actions, rewards, or transitions of states can be both deterministic or probabilistic. In the chart above, with the notation a \sim \pi (a|s) I meant that the action a is taken with a probability of \pi (a|s). And whether they are probabilistic or deterministic is task-specific. Also you should keep it in mind that all the values in the chart are realized values of random variables as I show in the chart at the right side.

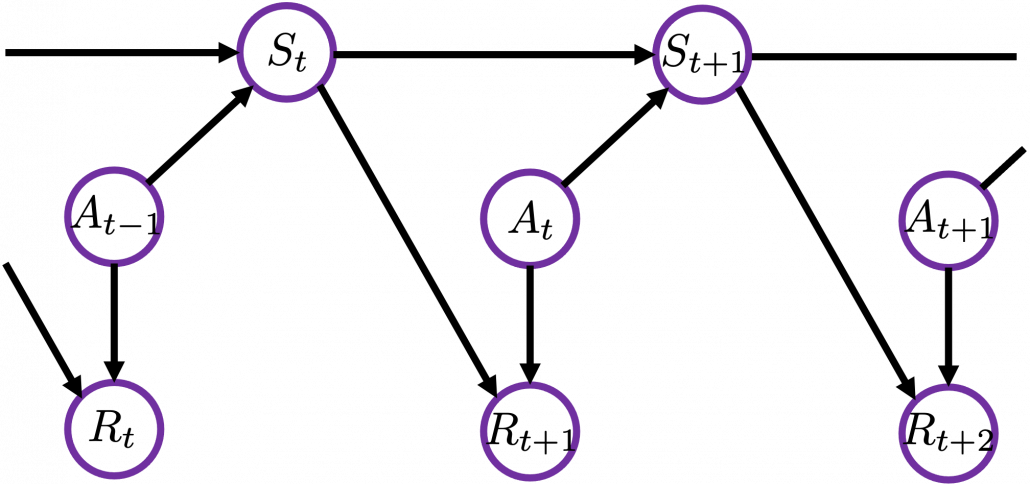
In the textbook “Reinforcement Learning:An Introduction” by Richard S. Sutton, which is almost mandatory for all the RL learners, RL process is displayed as the left side of the figure below. Each capital letter in the chart means a random variable. Relations of random variables can be also displayed as graphical models like the right side of the chart. The graphical model is a time series expansion of the chart of RL loops at the left side. The chart below shows almost the same idea as the one above. Whether they use random variables or realized values is the only difference between them. My point is that decision makings are simplified in RL as the models I have explained. Even if some situations are not strictly MDPs, in many cases the problems are approximated as MDPs in practice so that RL can be applied to.

*I personally think you do not have to care so much about differences of random variables and their realized values in RL unless you discuss RL mathmematically. But if you do not know there are two types of notations, which are strictly different ideas, you might get confused while reading textboks on RL. At least in my artile series, I will strictly distinguish them only when their differences matter.

*In case you are not sure about differences of random variables and their realizations, please roughly grasp the terms as follows: random variables X are probabilistic tools for example dices. On the other hand their realized values x are records of them, for example (4, 1, 6, 6, 2, 1, …).  And the probability that a random variable X takes on the value x is denoted as Pr\{X = x\}. And X \sim p means the random variable X is selected from distribution p(x) \doteq \text{Pr} \{X=x\}. In case X is a “dice,” for any x p(x) = \frac{1}{6}.

3. Planning and RL

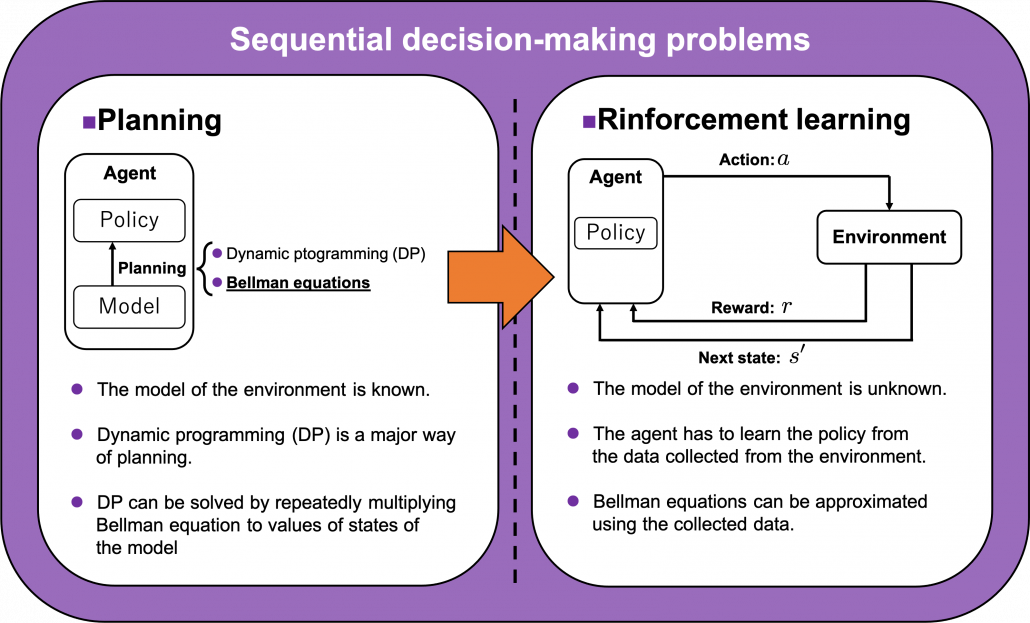
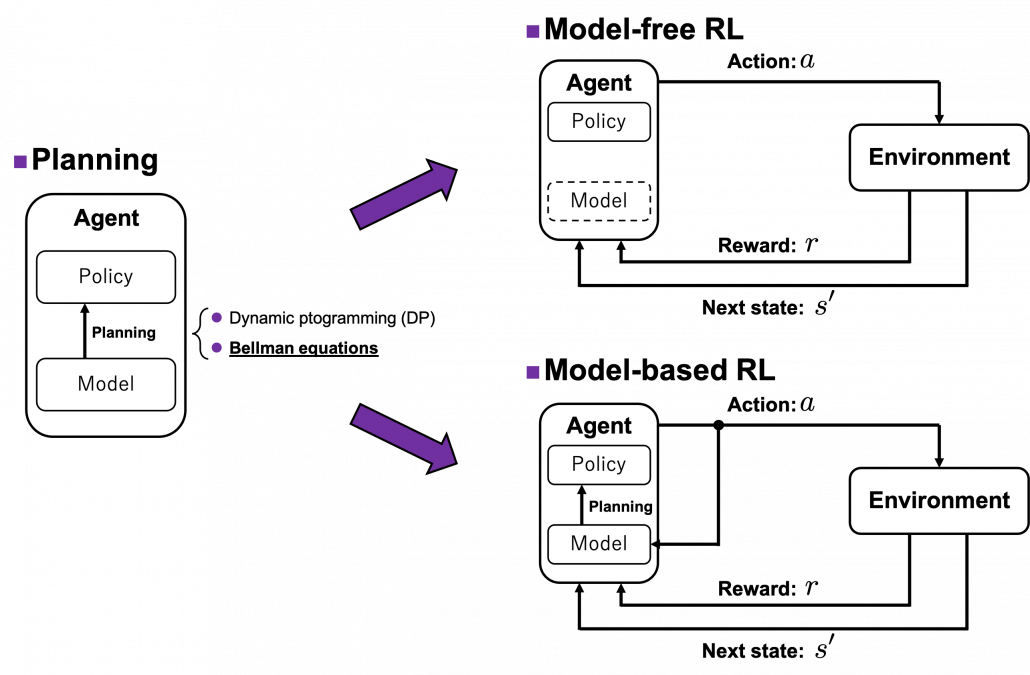
We have seen RL is a family of training algorithms which optimizes rules for choosing A_t = a in sequential decision-making problems, usually assuming them to be MDPs. However I have to emphasize that RL is not the only way to optimize such policies. In sequential decision making problems, when the model of the environment is known, policies can be optimized also through planning without collecting data from the environment. On the other hand, when the model of the environment is unknown policies have to be optimized based on data which an agents collects from the environment through trial and errors. This is the very case called RL. You might find planning problems very simple and unrealistic in practical cases. But RL is based on planning of sequential decision-making problems with MDP settings, so studying planning problems is inevitable.  As far as I could see so far, RL is a family of algorithms for approximating techniques in planning problems through trial and errors in environments. To be more concrete, in the next article I am going to explain dynamic programming (DP) in RL contexts as a major example of planning problems, and a formula called the Bellman equation plays a crucial role in planning. And after that we are going to see that RL algorithms are more or less approximations of Bellman equation by agents sampling data from environments.

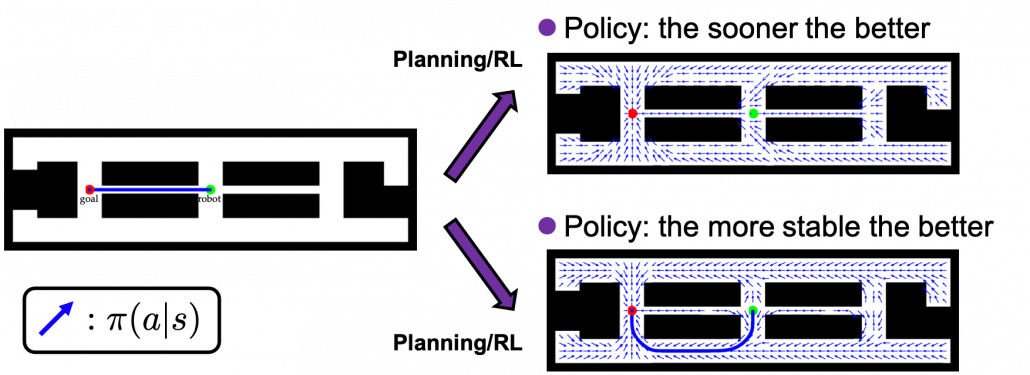
As an intuitive example, I would like to take a case of navigating a robot, which is explained in a famous textbook on robotics named “Probabilistic Robotics”. In this case, the state set \mathcal{S} is the whole space on the map where the robot can move around. And the action set is \mathcal{A} = \{\rightarrow, \searrow, \downarrow, \swarrow \leftarrow, \nwarrow, \uparrow, \nearrow \}. If the robot does not fail to take any actions or there are no unexpected obstacles, manipulating the robot on the map is a MDP. In this example, the robot has to be navigated from the start point as the green dot to the goal as the red dot. In this case, blue arrows can be obtained through planning or RL. Each blue arrow denotes the action taken in each place, following the estimated policy. In other words, the function \pi is the flow of the blue arrows. But policies can vary even in the same problem. If you just want the robot to reach the goal as soon as possible, you might get a blue arrows in the figure at the top after planning. But that means the robot has to pass a narrow street, and it is likely to bump into the walls. If you prefer to avoid such risks, you should adopt policies of choosing wider streets, like the blue arrows in the figure at the bottom.

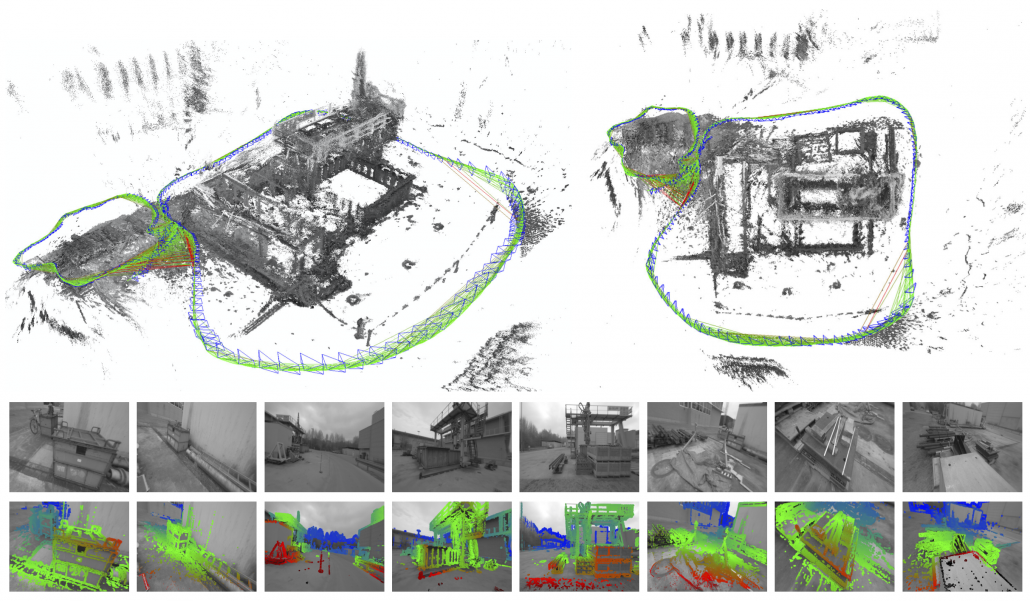
*In the textbook on probabilistic robotics, this case is classified to a planning problem rather than a RL problem because it assumes that the robot has a complete model of the environment, and RL is not introduced in the textbook. In case of robotics one major way of making a model, or rather a map is SLAM (Simultaneous Localization and Mapping). With SLAM, a map of the environment can be made only based on what have been seen with a moving camera like in the figure below. Half the first part of the textbook is about self localization of robots and gaining maps of environments. And the latter part is about planning in the gained map. RL is also based on planning problems as I explained. I would say RL is another branch of techniques to gain such models/maps and proper plans in the environment through trial and errors.

In the example of robotics above, we have not considered rewards R_t in the course of navigating the agent. That means the reward is given only when it reaches the goal. But agents can get lost if they get a reward only at the goal. Thus in many cases you optimize a policy \pi(a|s) such that it maximizes the sum of rewards R_1 + R_2 + \cdots + R_T, where T is the the length of the whole sequence of MDP in this case. More concretely, at every time step t, agents have to estimate G_t \doteq R_{t+1} + R_{t+2} + \cdots + R_T. The G_t is called a return. But you usually have to consider uncertainty of future rewards, so in practice you multiply a discount rate \gamma \quad (0\leq \gamma \leq 1) with rewards every time step. Thus in practice agents estimate a discounted return every time step as follows.

G_t \doteq R_{t+1} + \gamma R_{t+2} + \gamma ^2 R_{t+3} + \cdots + \gamma ^ {T-t-1} R_T = \sum_{k=0}^{T-t-1}{\gamma ^{k}R_{t+k+1}}

If agents blindly try to maximize immediate upcoming rewards R_t in a greedy way, that can lead to smaller amount of rewards in the long run. Policies in RL have to be optimized so that they maximize return, a sum of upcoming rewards G_t, every time step. But still, it is not realistic to take all the upcoming rewards R_{t+1}, R_{t+2}, \dots directly into consideration. These rewards have to be calculated recursively and probabilistically every time step. To be exact values of states are calculated this way. The value of a state in contexts of RL mean how likely agents get higher values if they start from the state. And how to calculate values is formulated as the Bellman equation.

*If you are not sure what “ecursively” and “probabilistically” mean, please do not think too much. I am going to explain that as precisely as possible in the next article.

I am going to explain Bellman equation, or Bellman operator to be exact in the next article. For now I would like you to keep it in mind that Bellman operator calculates the value of a state by considering future actions and their following states and rewards. Bellman equation is often displayed as a decision-tree-like chart as below. I would say planning and RL are matter of repeatedly applying Bellman equation to values of states. In planning problems, the model of the environment is known. That is, all the connections of nodes of the graph at the left side of the figure below are known. On the other hand in RL, those connections are not completely known, thus they need to be estimated in certain ways by agents collecting data from the environment.

*I guess almost no one explain RL ideas as the graphs above, and actually I am in search of effective and correct ways of visualizing RL. But so far, I think the graphs above describe how values updated in RL problem settings with discrete data. You are going to see what these graphs mean little by little in upcoming articles. I am also planning to introduce Bellman operators to formulate RL so that you do not have to think about decision-tree-like graphs all the time.

4. Examples of how RL problems are modeled

You might find that so many explanations on RL rely on examples of how to make computers navigate themselves in simple mazes or play video games, which are mostly impractical in real world. But I think uses of RL in letting computers play video games are good examples when you study RL. The video game industry is one of the most developed and sophisticated area which have produced environments of RL. OpenAI provides some “playgrounds” where agents can actually move around, and there are also some ports of Atari games. I guess once you understand how RL can be modeled in those simulations, that helps to understand how other more practical tasks are implemented.

*It is a pity that there is no E.T. the Extra-Terrestrial. It is a notorious video game which put an end of the reign of Atari. And after that came the era of Nintendo Entertainment System.

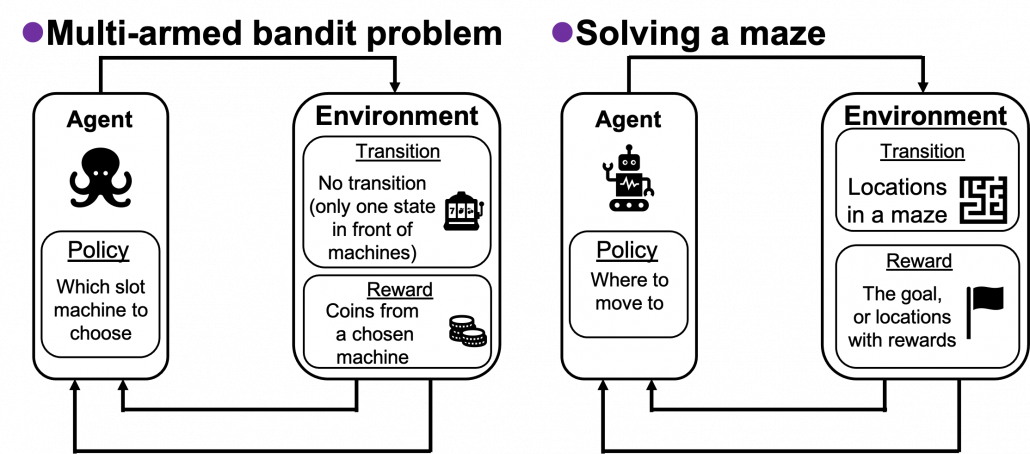
In the second section of this article, I showed the most typical diagram of the fundamental RL idea. The diagrams below show correspondences of each element of some simple RL examples to the diagram of general RL. Multi-armed bandit problems are a family of the most straightforward RL tasks, and I am going to explain it a bit more precisely later in this article. An agent solving a maze is also a very major example of RL tasks. In this case states s\in \mathcal{S} are locations where an agent can move. Rewards r \in \mathcal{R} are goals or bonuses the agents get in the course of the maze. And in this case \mathcal{A} = \{\rightarrow, \downarrow,\leftarrow, \uparrow \}.

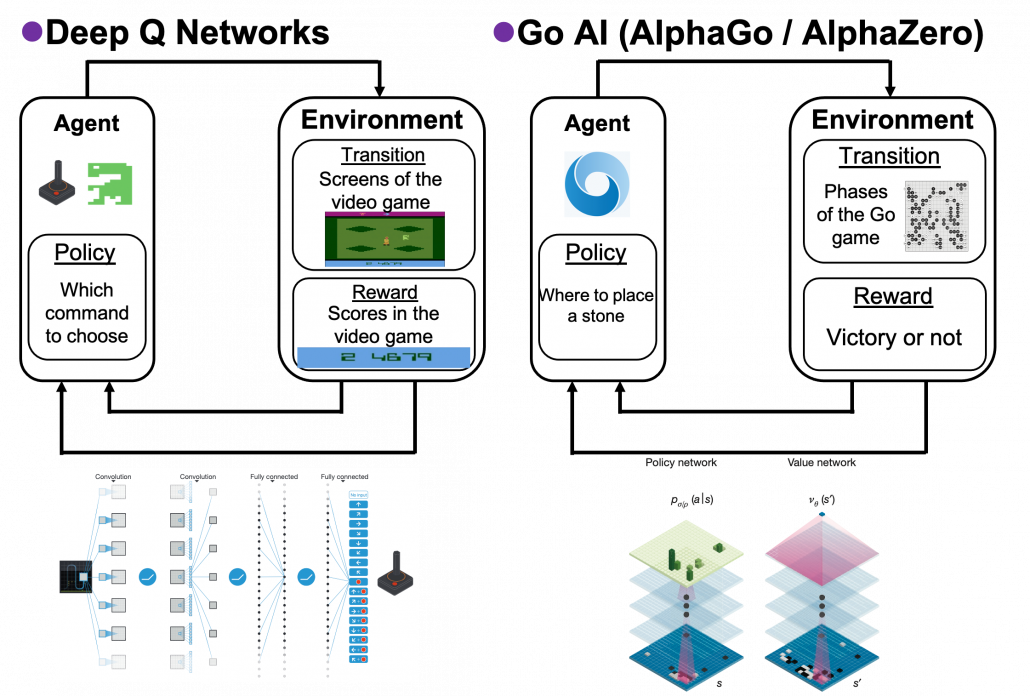
If the environments are more complicated, deep learning is needed to make more complicated functions to model each component of RL. Such RL is called deep reinforcement learning. The examples below are some successful cases of uses of deep RL. I think it is easy to imagine that the case of solving a maze is close to RL playing video games. In this case \mathcal{A} is all the possible commands with an Atari controller like in the figure below. Deep Q Networks use deep learning in RL algorithms named Q learning. The development of convolutional neural networks (CNN) enabled computers to comprehend what are displayed on video game screens. Thanks to that, video games do not need to be simplified like mazes. Even though playing video games, especially complicated ones today, might not be strict MDPs, deep Q Networks simplifies the process of playing Atari as MDP. That is why the process playing video games can be simplified as the chart below, and this simplified MPD model can surpass human performances. AlphaGo and AlphaZero are anotehr successful cases of deep RL. AlphaGo is ther first RL model which defeated the world Go champion. And some training schemes were simplified and extented to other board games like chess in AlphaZero. Even though they were sensations in media as if they were menaces to human intelligence, they are also based on MDPs. A policy network which calculates which tactics to take to enhance probability of winning board games. But they use much more sophisticated and complicated techniques. And it is almost impossible to try training them unless you own a tech company or something with some servers mounted with some TPUs. But I am going to roughly explain how they work in one of my upcoming articles.

5. Some keywords for organizing terms of RL

As I am also going to explain in next two articles, RL algorithms are totally different frameworks of training machine learning models compared to supervised/unsupervised learnig. I think pairs of keywords below are helpful in classifying RL algorithms you are going to encounter.

(1) “Model-based” or “model-free.”

I said planning problems are basics of RL problems, and in many cases RL algorithms approximate Bellman equation or related ideas. I also said planning problems can be solved by repeatedly applying Bellman equations on states of a model of an environment. But in RL problems, models are usually unknown, and agents can only move in an environment which gives a reward or the next state to an agent. The agent can gains richer information of the environment time step by time step in RL, but this procedure can be roughly classified to two types: model-free type and model-based type. In model-free type, models of the environment are not explicitly made, and policies are updated based on data collected from the environment. On the her hand, in model-based types the models of the environment are estimated, and policies are calculated based on the model.

*AlphaGo and AlphaZero are examples of model-based RL. Phases of board games can be modeled with CNN. Plannings in this case correspond to reading some phases ahead of games, and they are enabled by Monte Carlo tree search. They are the only examples of model-based RL which I can come up with. And also I had an impression that many study materials on RL focus on model-free types of RL.

(2) “Values” or “policies.”

I mentioned that in RL, values and policies are optimized. Values are functions of a value of each state. The value here means how likely an agent gets high rewards in the future, starting from the state. Policies are functions fro calculating actions to take in each state, which I showed as each of blue arrows in the example of robotics above. But in RL, these two functions are renewed in return, and often they reach optimal functions when they converge. The figure below describes the idea well.

These are essential components of RL, and there too many variations of how to calculate them. For example timings of updating them, whether to update them probabilistically or deterministically.  And whatever RL algorithm I talk about, how values and policies are updated will be of the best interest. Only briefly mentioning them would be just more and more confusing, so let me only briefly take examples of dynamic programming (DP).

Let’s consider DP on a simple grid map which I showed in the preface. This is a planning problem, and agents have a perfect model of the map, so they do not have to actually move around there. Agents can move on any cells except for blocks, and they get a positive rewards at treasure cells, and negative rewards at danger cells. With policy iteration, the agents can interactively update policies and values of all the states of the map. The chart below shows how policies and values of cells are updated.

You do not necessarily have to calculate policies every iteration, and this case of DP is called value iteration. But as the chart below suggests, value iteration takes more time to converge.

I am going to much more precisely explain the differences of values and policies in DP tasks in the next article.

(3) “Exploration” or “exploitation”

RL agents are not explicitly supervised by the correct answers of each behavior. They just receive rough signals of “good” or “bad.” One of the most typical failed cases of RL is that agents can be myopic. I mean, once agents find some actions which constantly give good reward, they tend to miss other actions which produce better rewards more effectively. One good way of avoiding this is adding some exploration, that is taking some risks to discover other actions.

I mentioned multi-armed bandit problems are simple setting of RL problems. And they also help understand trade-off of exploration and exploitation. In a multi-armed bandit problem, an agent chooses which slot machine to run every time step. Each slot machine gives out coins, or rewards r with a probability of p. The number of trials is limited, so the agent has to find the machine which gives out coins the most efficiently within the limited number of trials. In this problem, the key is the balance of trying to find other effective slot machines and just trying to get as much coins as possible with the machine which for now seems to be the best. This is trade-off of “exploration” or “exploitation.” One simple way to implement exploration and exploitation trade-off is ɛ-greedy algorithm. This is quite simple: with a probability of \epsilon, agents just randomly choose actions which are not thought to be the best then.

*Casino owners are not so stupid. It is designed so that you would lose in the long run, and before your “exploration” is complete, you will be “exploited.”

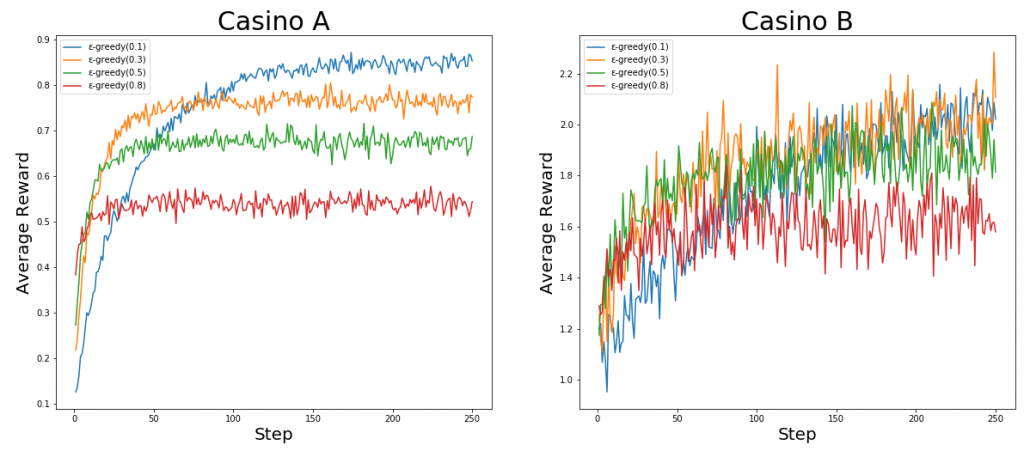
Let’s take a look at a simple simulation of a multi-armed bandit problem. There are two “casinos,” I mean sets of slot machines. In casino A, all the slot machines gives out the same reward 1, thus agents only need to find the machine which is the most likely to gives out more coins. But casino B is not simple like that. In this casino, slot machines with small odds give higher rewards.

I prepared four types of “multi-armed bandits,” I mean octopus agents. Each of them has each value of \epsilon, and the \epsilons reflect their “curiosity,” or maybe “how inconsistent they are.” The graphs below show the average reward over 1000 simulations. In each simulation each agent can try slot machines 250 times in total. In casino A, it seems the agent with the curiosity of \epsilon = 0.3 gets the best rewards in a short term. But in the long run, more stable agent whose \epsilon is 0.1, get more rewards. On the other hand in casino B, No on seems to make outstanding results.

*I wold not concretely explain how values of each slot machines are updated in this article. I think I am going to explain multi-armed bandit problems with Monte Carlo tree search in one of upcoming articles to explain the algorithm of AlphaGo/AlphaZero.

(4)”Achievement” or “estimation”

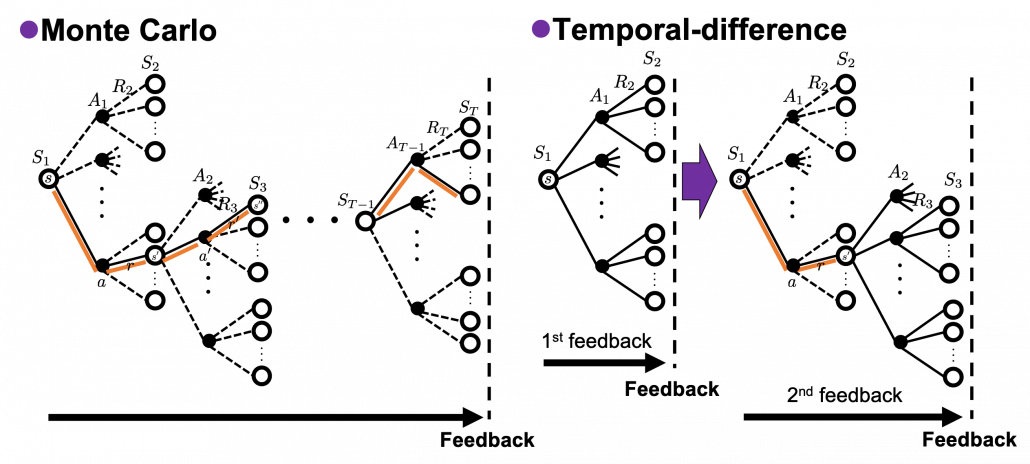
The last pair of keywords is “achievement” or “estimation,” and it might be better to instead see them as a comparison of “Monte Carlo” and “temporal-difference (TD).” I said RL algorithms often approximate Bellman equation based on data an agent has collected. Agents moving around in environments can be viewed as sampling data from the environment. Agents sample data of states, actions, and rewards. At the same time agents constantly estimate the value of each state. Thus agents can modify their estimations of values using value calculated with sampled data. This is how agents make use of their “experiences” in RL. There are several variations of when to update estimations of values, but roughly they are classified to Monte Carlo and Temporal-difference (TD). Monte Carlo is based on achievements of agents after one episode or actions. And TD is more of based on constant estimation of values at every time step. Which approach is to take depends on tasks but it seems many major algorithms adopt TD types. But I got an impression that major RL algorithms adopt TD, and also it is said evaluating actions by TD has some analogies with how brain is “reinforced.” And above all, according to the book by Sutton and Barto “If one had to identify one idea as central and novel to reinforcement learning, it would undoubtedly be temporal-difference (TD) learning.” And an intermediate idea, between Monte Carlo and TD, also can be formulated as eligibility trace.

In this article I have briefly covered all the topics I am planning to explain in this series. This article is a start of a long-term journey of studying RL also to me. Any feedback on this series, as posts or  emails, would be appreciated. The next article is going to be about dynamic programming, which is a major way for solving planning problems. In contexts of RL, dynamic programming is solved by repeatedly applying Bellman equation on values of states of a model of an environment. Thus I think it is no exaggeration to say dynamic programming is the backbone of RL algorithms.

Appendix

The code I used for the multi-armed bandit simulation. Just copy and paste them on Jupyter Notebook.

* I make study materials on machine learning, sponsored by DATANOMIQ. I do my best to make my content as straightforward but as precise as possible. I include all of my reference sources. If you notice any mistakes in my materials, including grammatical errors, please let me know (email: yasuto.tamura@datanomiq.de). And if you have any advice for making my materials more understandable to learners, I would appreciate hearing it.

The Basics of Logistic Regression in Data Science

Data science is a field that is growing by leaps and bounds. A couple decades ago, using a machine learning program to make predictions about datasets was the purview of science fiction. Today, all you need is a computer, some solid programming, and a bit of patience, and you, too, can have your own digital Zoltar.

Okay, it’s not really telling the future, but it does give you the ability to predict some future events, as long as those events fall within the data the system already has. These predictions fall into two categories: linear regression and logistic regression.

Today we’re going to focus on the latter. What is logistic regression in data science, and how can it help data scientists and analysts solve problems?

What Is Logistic Regression?

First, what is logistic regression, and how does it compare to its linear counterpart?

Logistic regression is defined as “a statistical analysis method used to predict a data value based on prior observations of a data set.” It is valuable for predicting the result if it is dichotomous, meaning there are only two possible outcomes.

For example, a logistic regression system could use its data set to predict whether a specific team will win a game, based on their previous performance and the performance of their competitors because there are only two possible outcomes — a win or a loss.

Linear regression, on the other hand, is better suited for continuous output or situations where there are more than two possible outcomes. A traffic prediction model would use linear regression. In these situations, no matter how much data the program has, there are always variables that can throw a wrench in the works.

This isn’t just a case of “go” or “no go,” like you might see with a rocket launch. A company using these predictive models to schedule deliveries will need to be able to compensate for those variables. Linear regression gives them the flexibility to do that.

Logistic Regression in Data Analysis

If you broke down the expression of logistic regression on paper, it would look something like this:

The left side of the equation is called a logit, while the right side represents the odds, or the probability of success vs. failure.

It seems incredibly complicated, but when you break it down and feed it into a machine learning algorithm, it provides a great number of benefits. For one, it’s simple — in relative terms — and doesn’t generate a lot of variance because, at the end, no matter how much data you feed a logistic regression system, there are only going to be two possible outcomes.

In addition to providing you with a “yes” or “no” answer, these systems can also provide the probability for each potential outcome. The downside of logistic regression systems is that they don’t function well if you feed them too many different variables. They will also need an additional translator system to convert non-linear features to linear ones.

Applications of Logistic Regression

The potential applications for logistic regression are nearly limitless. But if you find yourself struggling to picture where you might use this data analysis tool, here are a few examples that might help you.

Organizations can use logistic regression for credit scoring. While this might seem like it’s outside the scope of this particular type of programming because there are multiple credit scores a person might have, when you break it down to ones and zeros, there are usually only two possible outcomes where credit is concerned — approved or denied.

There are a number of potential applications for logistic regression in medicine as well. When it comes to testing for a specific condition, there are usually only two results — “yes” or “no.” Either the patient has the condition, or they don’t. In this case, it may be necessary to program in a third option — a null variable — that trips when there isn’t enough information available for a particular patient to make an accurate diagnostic decision.

Even text editing can benefit from logistic regression. Plug in a dictionary, and let it loose on a piece of text. These programs aren’t going to create masterpieces or even fix editing mistakes because they lack the programming to understand things like context and tone, but they are invaluable for spelling mistakes. Again, this brings us back to the binary of 1’s and 0’s — either a word is spelled correctly, according to the dictionary definition, or it isn’t.

If dichotomous outcomes are the goal of your data analysis system, logistic regression is going to be the best tool in your toolbox.

Breaking Down the Basics

A lot goes into the creation of a machine learning or predictive analysis tool, but understanding the difference between linear and logistic regression can make that process a bit simpler. Start by understanding what the program will do, then choose your regression form appropriately.

Why Your Data Science Team Needs Separate Testing, Validation & Training Sets

Automated testing of machine learning models can help to dramatically reduce the amount of time and effort that your team has to dedicate to debugging them. Not applying these techniques properly, however, could potentially do a great deal of harm if the process is completely unmonitored and doesn’t adhere to a list of best practices. Some tests can be applied to models after the training stage is over while others should be applied directly to test the assumptions that the model is operating under.

Traditionally, it’s proven somewhat difficult to test machine learning models because they’re very complex containers that often play host to a number of learned operations that can’t be clearly decoupled from the underlying software.. Conventional software can be broken up into individual units that each accomplish a specific task. The same can’t be said of ML models, which are often solely the product of training and therefore can’t be decomposed into smaller parts.

Testing and evaluating the data sets that you use for training could be the first step in unraveling this problem.

Monitoring Data Sets in a Training Environment

ML testing is very different from testing application software because anyone performing checks on ML models will find that they’re attempting to test something that is probabilistic as opposed to deterministic. An otherwise perfect model could occasionally make mistakes and still be considered the best possible model that someone could develop. Engineers working on a spreadsheet or database program wouldn’t be able to tolerate even the slightest rounding errors, but it’s at least somewhat acceptable to find the occasional flaw in the output of a program that processes data by way of learned responses. The level of variance will differ somewhat depending on the tasks that a particular model is being trained to accomplish, but it may always be there regardless.

As a result, it’s important to at least examine the initial data that’s being used to train ML models. If this data doesn’t accurately represent the kind of information that a real-world environment would thrust onto a model, then said model couldn’t ever hope to perform adequately when such input is finally given. Decent input specifications will help to ensure that the model comes away with a somewhat accurate representation of natural variability in whatever industry it’s performing a study in.

Pure performance measurements can come from essentially any test set, but data scientists will normally want to specify the hyperparameters of their model to provide a clear metric by which to judge performance while taking said measurements. Those who consistently use one model over another solely for its performance on a particular test set may end up fitting test sets to models to find something that performs exactly as they want it to.

Those who are working with smaller data sets will need to find some way to evaluate them in spite of their diminutive size.

Managing a Smaller Set of Data Safely

Those working with particularly large data sets have typically gone with 60-20-20 or 80-10-10 splits. This has helped to strike a decent balance between the competing needs of reducing potential bias while also ensuring that the simulations run fast enough to be repeated several times over.

Those working with a smaller data set might find that it simply isn’t representative enough, but for whatever reason it isn’t possible to increase the amount of information put into the test set. Cross-validation might be the best option for those who find themselves in this sort of situation. This is normally used by those in the applied ML field to compare and select models since it’s relatively easy to understand.

K-fold cross-validation algorithms are often used to estimate the skill of a particular ML model on new data irrespective of the size of the data in question. No matter what method you decide to try, though, your team needs to keep the concepts of testing and validation data separate when training your ML model. When you square these off in a training data vs. test data free-for-all, the results should come out something like this:

  • Test sets are essentially examples that are only ever used to judge the performance of a classifier that’s been completely specified.
  • Validation sets are deployed when data scientists are tuning the parameters of a classifier. You might start using a validation set to find the total number of hidden units that exist in a predefined neural network.
  • Training sets are used exclusively for learning. Many experts will define these as sets that are designed to fit the parameters of the initial classifier.

Segmenting testing, validation and training sets might not seem natural to those who are used to relying on one long inclusive data set in order to ensure that their ML models work in any scenario. Nevertheless, it’s vital to have them separated as much as possible. Test data management should always be part of your QA workflows. On top of this, it’s important to keep an eye on how a model responds as it learns from the data even if it does appear that accuracy increases over time. This is because there are several high-quality insights an operator can derive from the learning process.

Taking a Closer Look at Weights During the Training Process

An ideal model will enjoy lower losses and a higher degree of accuracy over time, which is often more than enough to please the data scientists that develop them. However, you can learn more by taking a close look at what areas are receiving the heaviest weights during training. A buggy piece of code could produce outcomes where different potential choices aren’t given different weights. Alternatively, it could be that they’re not really stacked against one another at all. In these cases, the overall results might end up looking realistic when they’re actually errant. Finding bugs in this way is especially important in a world where ML agents are being used to debug conventional software applications.

Taking a closer look at the weights themselves can help specialists to discover these problems before a model ever makes its way out into the wild. Debugging ML models as though they were application software will never work simply because so many aspects of their neural networks come from exclusively learned behaviors that aren’t possible to decompose into something that could be mapped on a flowchart. However, it should be possible to detect certain types of problems by paying close attention to these weights.

Developing any piece of software takes quite a bit of time, and the fact that ML models have to be trained means that they’ll often take even longer. Give yourself enough lead time and you should find that your testing, validation and training sets split evenly into different neat packages that make the process much simpler.

My elaborate study notes on reinforcement learning

I will not tell you why, but all of a sudden I was in need of writing an article series on Reinforcement Learning. Though I am also a beginner in reinforcement learning field. Everything I knew was what I learned from one online lecture conducted in a lazy tone in my college. However in the process of learning reinforcement learning, I found a line which could connect the two dots, one is reinforcement learning and the other is my studying field. That is why I made up my mind to make an article series on reinforcement learning seriously.

To be a bit more concrete, I imagine that technologies in our world could be enhanced by a combination of reinforcement learning and virtual reality. That means companies like Toyota or VW might come to invest on visual effect or video game companies more seriously in the future. And I have been actually struggling with how to train deep learning with cgi, which might bridge the virtual world and the real world.

As I am also a beginner in reinforcement learning, this article series would a kind of study note for me. But as I have been doing in my former articles, I prefer exhaustive but intuitive explanations on AI algorithms, thus I will do my best to make my series as instructive and effective as existing tutorial on reinforcement learning.

This article is going to be composed of the following contents.

In this article I would like to share what I have learned about RL, and I hope you could get some hints of learning this fascinating field. In case you have any comments or advice on my “study note,” leaving a comment or contacting me via email would be appreciated.

Coffee Shop Location Predictor

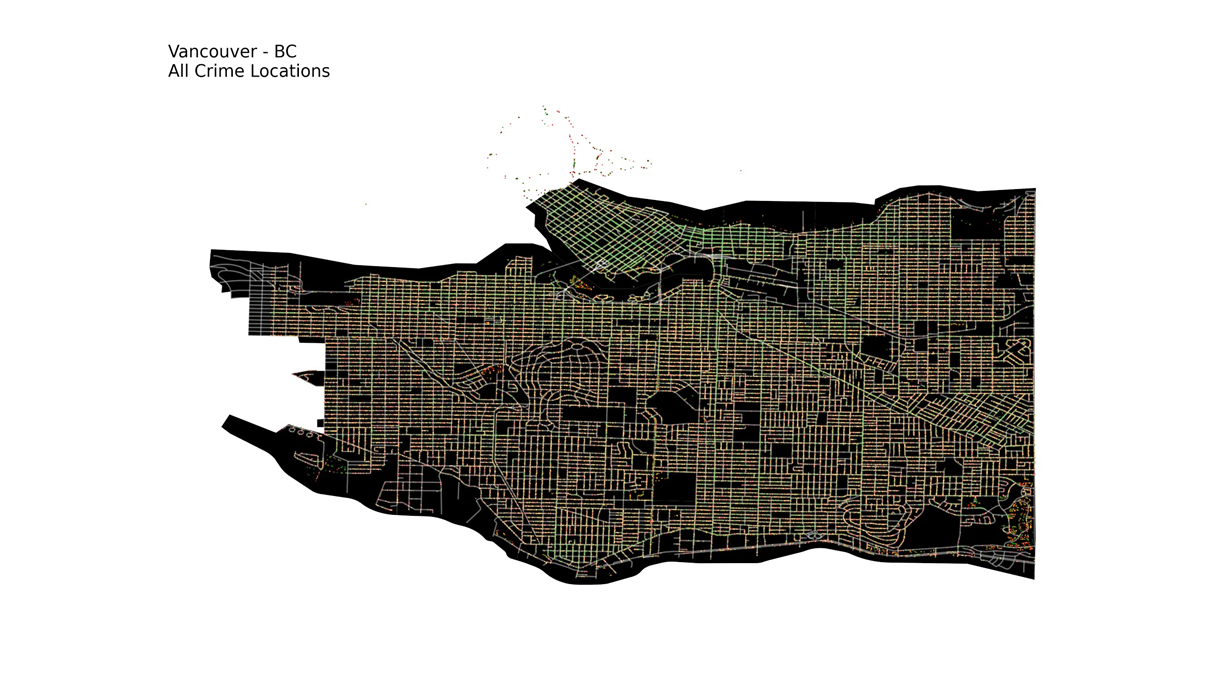
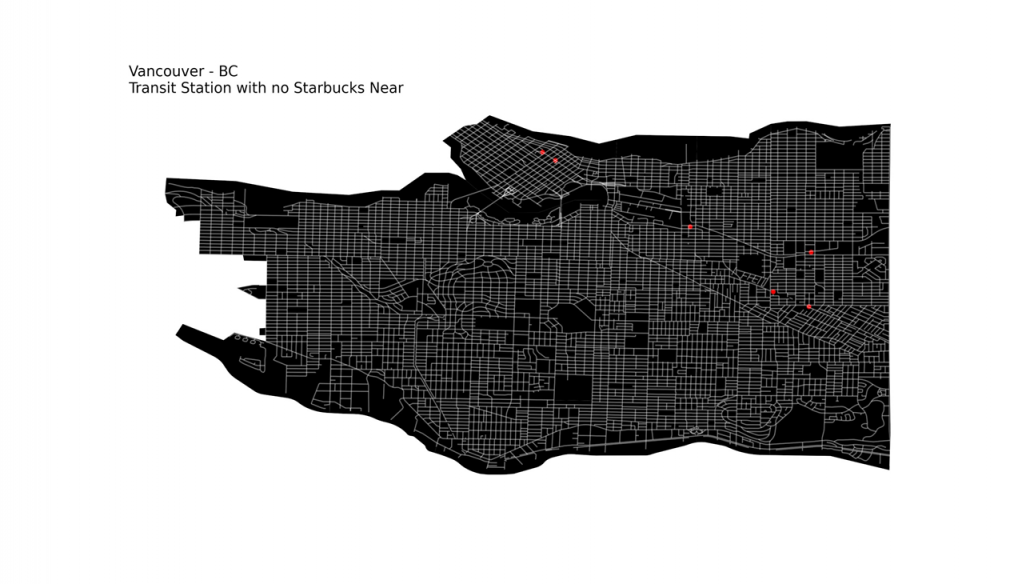
As part of this article, we will explore the main steps involved in predicting the best location for a coffee shop in Vancouver. We will also take into consideration that the coffee shop is near a transit station, and has no Starbucks near it. Well, while at it, let us also add an extra feature where we make sure the crime in the area is lower.

Introduction

In this article, we will highlight the main steps involved to predict a location for a coffee shop in Vancouver. We also want to make sure that the coffee shop is near a transit station, and has no Starbucks near it. As an added feature, we will make sure that the crime concentration in the area is low, and the entire program should be implemented in Python. So let’s walk through the steps.

Steps Required

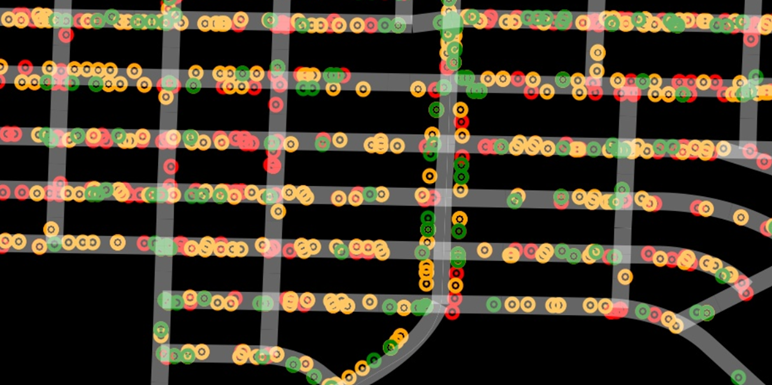
  • Get crime history for the last two years
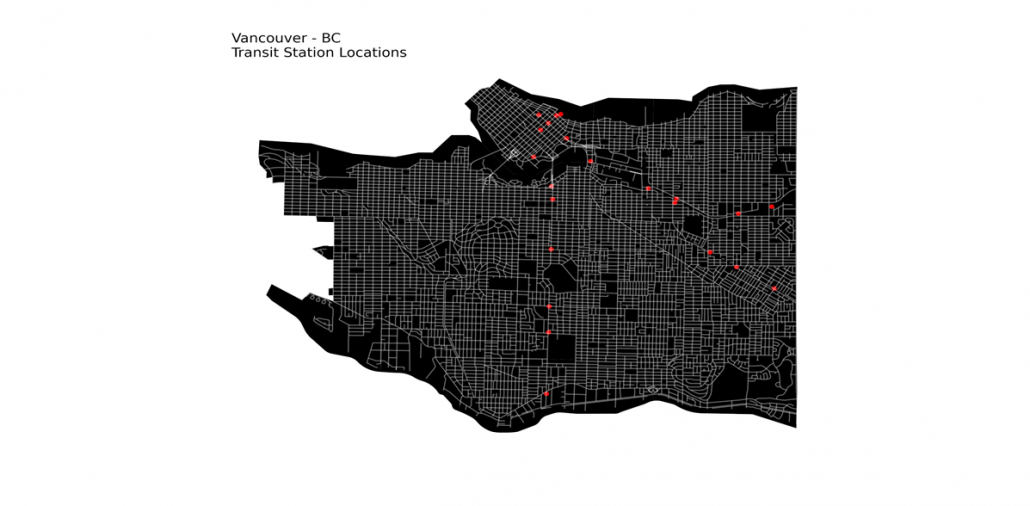
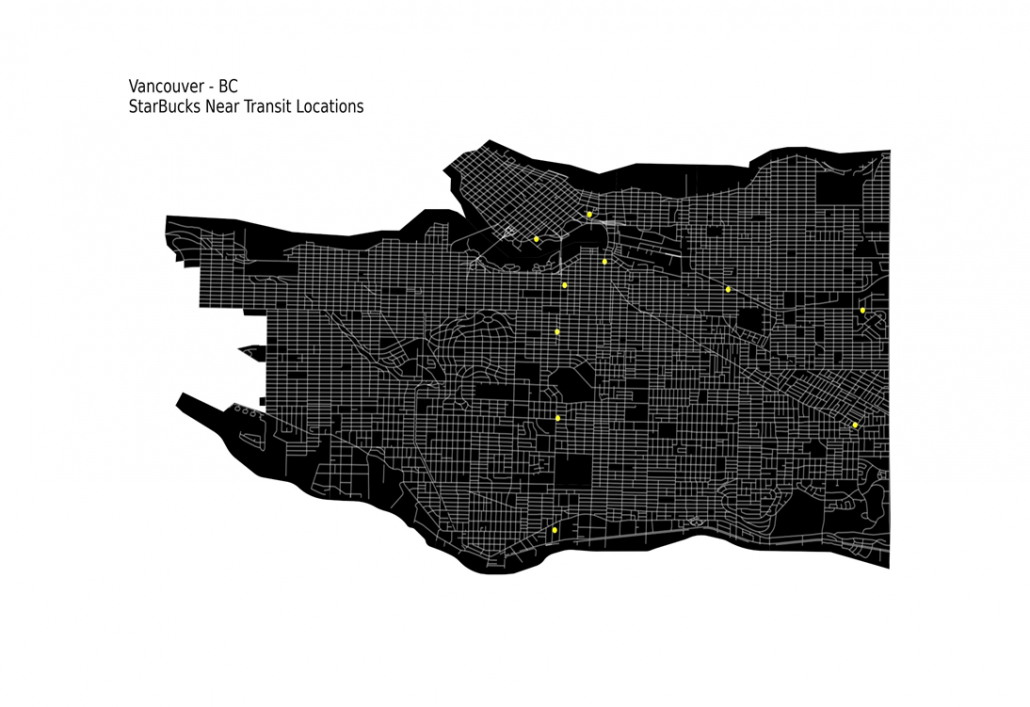
  • Get locations of all transit stations and Starbucks in Vancouver
  • Check all the transit stations that do not have any Starbucks near them
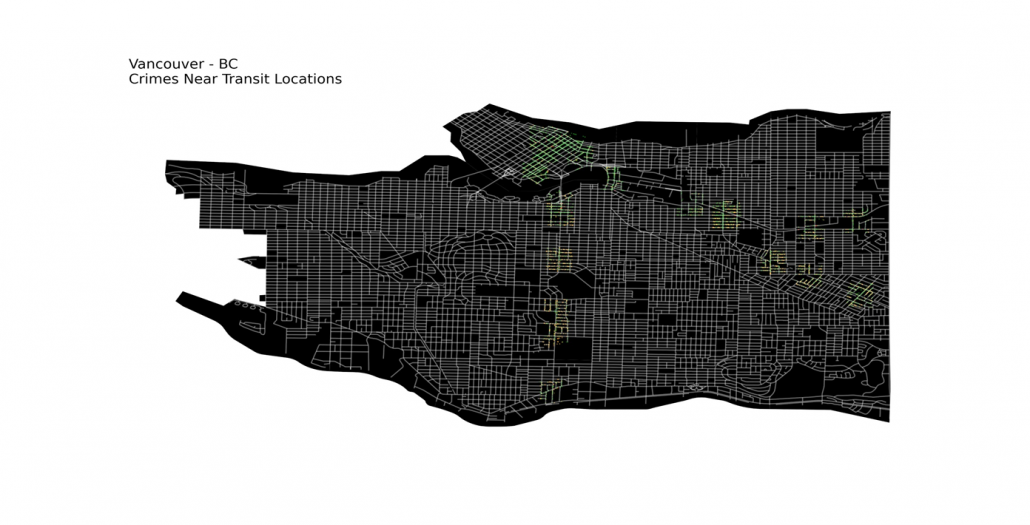
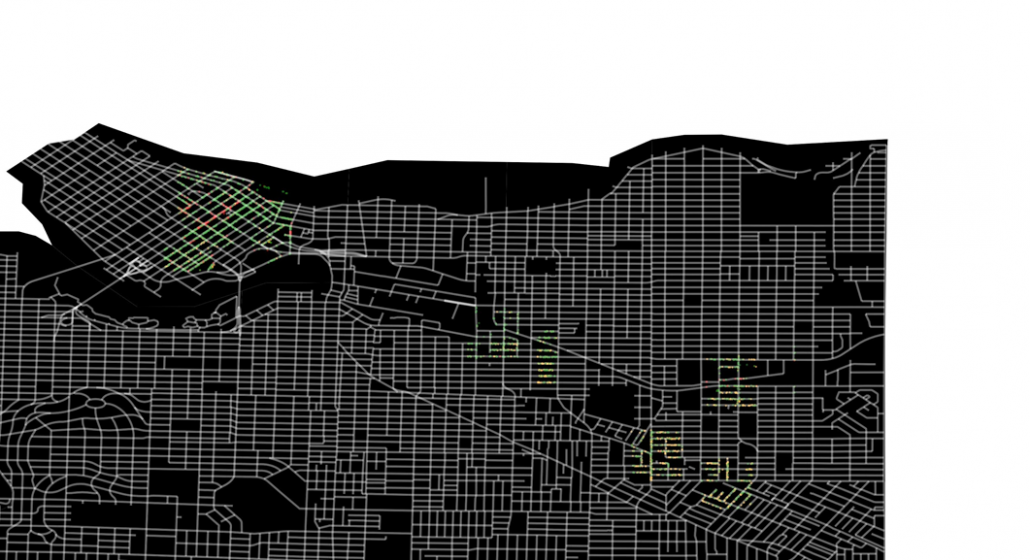
  • Get all the data regarding crimes near the filtered transit stations
  • Create a grid of all possible coordinates around the transit station
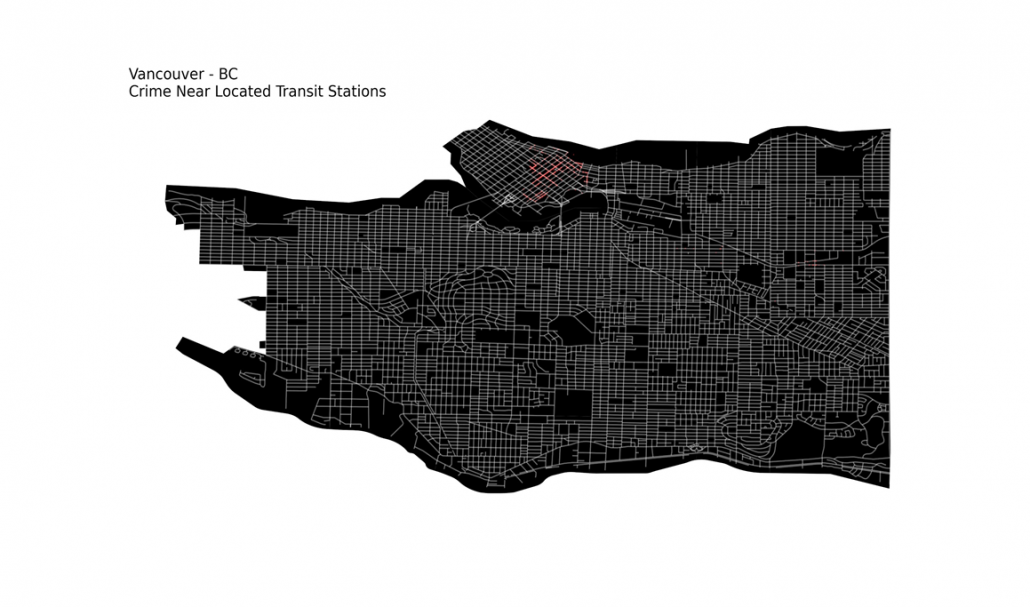
  • Check crime around each created coordinate and display the top 5 locations.

Gathering Data

This covers the first two steps required to get data from the internet, both manually and automatically.

Getting all Crime History

We can get crime history for the past 14 years in Vancouver from here. This data is in raw crime.csv format, so we have to process it and filter out useless data. We then write this processed information on the crime_processed.csv file.

Note: There are 530,653 records of crime in this file

In this program, we will just use the type and coordinate of the crime. There are many crime types, but we have classified them into three major categories namely;

Theft (red), Break and Enter (orange) and Mischief (green)

These all crimes can be plotted on Graph as displayed below.

This may seem very congested and full, so let’s see a closeup image for future references.

Getting Locations of all Rapid Transit Stations

We can get the coordinates of all Transit Stations in Vancouver from here. This dataset has all coordinates of rapid transit stations in three transit lines in Vancouver. There are a total of 23 of them in Vancouver, we can then use it for further processing.

Getting Locations of all Starbucks

The Starbucks data is present here, we can scrape it easily and get the locations of all the Starbucks in Vancouver. We just need the Starbucks that is near transit stations, so we’ll filter out the rest. There are a total 24 Starbucks in Vancouver, and 10 of them are near Transit Stations.

Note: Other than the coordinates of Transit Stations and Starbucks, we also need coordinates and type of the crime.

Transit Stations with no Starbucks

As we have all the data required, now moving to the next step. We need to get to the transit Station locations that have no Starbucks near them. For that we can create an area of particular radius around each Transit Station. Then check all Starbucks locations with respect to them, whether they are within that area or not.

If none of the Starbucks are within that particular Transit Station’s area, we can append it to a list. At the end, we have a list of all Transit locations with no Starbucks near them. There are a total of 6 Transit Stations with no Starbucks near them.

Crime near Transit Stations

Now lets filter out all crime records and get just what we are interested in, which means the crime near Transit stations. For that we will plot an area of specific radius around each of them to see the crimes. These are more than 110,000 crime records.

Crime near located Transit Stations

Now that we have all the Transit Stations that don’t have any Starbucks near them and also the crime near all Transit Stations. So, let’s use this information and get crime near the located Transit Stations. These are about 44,000 crime records.

This may seem correct at first glance, but the points are overlapping due to abundance, so we can create different lists of crimes based on their types.

Theft

Break and Enter

Mischief

Generating all possible coordinates

Now finally, we have all the prerequisites and let’s get to the main task at hand, predicting the best coordinate for the coffee shop.

There may be many approaches to solve this problem, but the one I used in this program is that I will create a grid of all possible locations (coordinates) in the area of 1 km radius around each located transit station.

Initially I generated 1 coordinate for every m, this resulted in 1000,000 coordinates in every km. This is a huge number, and for the 6 located Transit stations, it becomes 6 Million. It may not seem much at first glance because computers can handle such data in a few seconds.

But for location prediction we need to compare each coordinate with crime coordinates. As the algorithm has to check for ~7,000 Thefts, ~19,000 Break ins, and ~17,000 Mischiefs around each generated coordinate. Computing this would want the program to process an estimate of 432.4 Billion times. This sort of execution takes many hours on normal computers (sometimes days).

The solution to this is to create a coordinate for each 10 m area, this results about 10,000 coordinate per km. For the above mentioned number of crimes, the estimated processes will be several Billions. That would significantly reduce the time, but is still not less.

To control this, we can remove the duplicate values in crime coordinates and those which are too close to each other ~1m. Doing so, we are left with just 816 Thefts, 2,654 Break ins, and 8,234 Mischiefs around each generated coordinate.
The precision will not be affected much but the time and computational resources required will be reduced a lot.


Checking Crime near Generated coordinates

Now that we have all the locations, we will start some processing on it and check each coordinate against some constraints. That are respectively;

  1. Filter out Coordinates having Theft near 1 km
    We get 122,000 coordinates with no Thefts (Below merged 1000 to 1)
  2. Filter out Coordinates having Break Ins near 200m
    We get 8000 coordinates with no Thefts (Below merged 1000 to 1)
  3. Filter out Coordinates having Mischief near 200m
    We get 6000 coordinates with no Thefts (Below merged 1000 to 1)
    Now that we have 6 Coordinates of best locations that have passed through all the constraints, we will order them.To order them, we will check their distance from the nearest transit location. The nearest will be on top of the list as the best possible location, then the second and so on. The generated List is;

    1. -123.0419406741792, 49.24824259252004
    2. -123.05887151659479, 49.24327221040713
    3. -123.05287151659476, 49.24327221040713
    4. -123.04994067417924, 49.239242592520064
    5. -123.0419406741792, 49.239242592520064
    6. -123.0409406741792, 49.239242592520064

How can MindTrades help?

MindTrades Consulting Services, a leading marketing agency provides in-depth analysis and insights for the global IT sector including leading data integration brands such as Diyotta. From Cloud Migration, Big Data, Digital Transformation, Agile Deliver, Cyber Security, to Analytics- Mind trades provides published breakthrough ideas, and prompt content delivery. For more information, refer to mindtrades.com.

Code

https://github.com/Mindtrades-Consulting/Coffee-Shop-Location-Predictor


Rethinking linear algebra part two: ellipsoids in data science

1 Our expedition of eigenvectors still continues

This article is still going to be about eigenvectors and PCA, and this article still will not cover LDA (linear discriminant analysis). Hereby I would like you to have more organic links of the data science ideas with eigenvectors.

In the second article, we have covered the following points:

  • You can visualize linear transformations with matrices by calculating displacement vectors, and they usually look like vectors swirling.
  • Diagonalization is finding a direction in which the displacement vectors do not swirl, and that is equal to finding new axis/basis where you can describe its linear transformations more straightforwardly. But we have to consider diagonalizability of the matrices.
  • In linear dimension reduction such as PCA or LDA, we mainly use types of matrices called positive definite or positive semidefinite matrices.

In the last article we have seen the following points:

  • PCA is an algorithm of calculating orthogonal axes along which data “swell” the most.
  • PCA is equivalent to calculating a new orthonormal basis for the data where the covariance between components is zero.
  • You can reduced the dimension of the data in the new coordinate system by ignoring the axes corresponding to small eigenvalues.
  • Covariance matrices enable linear transformation of rotation and expansion and contraction of vectors.

I emphasized that the axes are more important than the surface of the high dimensional ellipsoids, but in this article let’s focus more on the surface of ellipsoids, or I would rather say general quadratic curves. After also seeing how to draw ellipsoids on data, you would see the following points about PCA or eigenvectors.

  • Covariance matrices are real symmetric matrices, and also they are positive semidefinite. That means you can always diagonalize covariance matrices, and their eigenvalues are all equal or greater than 0.
  • PCA is equivalent to finding axes of quadratic curves in which gradients are biggest. The values of quadratic curves increases the most in those directions, and that means the directions describe great deal of information of data distribution.
  • Intuitively dimension reduction by PCA is equal to fitting a high dimensional ellipsoid on data and cutting off the axes corresponding to small eigenvalues.

Even if you already understand PCA to some extent, I hope this article provides you with deeper insight into PCA, and at least after reading this article, I think you would be more or less able to visually control eigenvectors and ellipsoids with the Numpy and Maplotlib libraries.

*Let me first introduce some mathematical facts and how I denote them throughout this article in advance. If you are allergic to mathematics, take it easy or please go back to my former articles.

  • Any quadratic curves can be denoted as \boldsymbol{x}^T A\boldsymbol{x} + 2\boldsymbol{b}^T\boldsymbol{x} + s = 0, where \boldsymbol{x}\in \mathbb{R}^D , A \in \mathbb{R}^{D\times D} \boldsymbol{b}\in \mathbb{R}^D s\in \mathbb{R}.
  • When I want to clarify dimensions of variables of quadratic curves, I denote parameters as A_D, b_D.
  • If a matrix A is a real symmetric matrix, there exist a rotation matrix U such that U^T A U = \Lambda, where \Lambda = diag(\lambda_1, \dots, \lambda_D) and U = (\boldsymbol{u}_1, \dots , \boldsymbol{u}_D). \boldsymbol{u}_1, \dots , \boldsymbol{u}_D are eigenvectors corresponding to \lambda_1, \dots, \lambda_D respectively.
  • PCA corresponds to a case of diagonalizing A where A is a covariance matrix of certain data. When I want to clarify that A is a covariance matrix, I denote it as A=\Sigma.
  • Importantly covariance matrices \Sigma are positive semidefinite and real symmetric, which means you can always diagonalize \Sigma and any of their engenvalues cannot be lower than 0.

*In the last article, I denoted the covariance of data as S, based on Pattern Recognition and Machine Learning by C. M. Bishop.

*Sooner or later you are going to see that I am explaining basically the same ideas from different points of view, using the topic of PCA. However I believe they are all important when you learn linear algebra for data science of machine learning. Even you have not learnt linear algebra or if you have to teach linear algebra, I recommend you to first take a review on the idea of diagonalization, like the second article. And you should be conscious that, in the context of machine learning or data science, only a very limited type of matrices are important, which I have been explaining throughout this article.

2 Rotation or projection?

In this section I am going to talk about basic stuff found in most textbooks on linear algebra. In the last article, I mentioned that if A is a real symmetric matrix, you can diagonalize A with a rotation matrix U = (\boldsymbol{u}_1 \: \cdots \: \boldsymbol{u}_D), such that U^{-1}AU = U^{T}AU =\Lambda, where \Lambda = diag(\lambda_{1}, \dots , \lambda_{D}). I also explained that PCA is a case where A=\Sigma, that is, A is the covariance matrix of certain data. \Sigma is known to be positive semidefinite and real symmetric. Thus you can always diagonalize \Sigma and any of their engenvalues cannot be lower than 0.

I think we first need to clarify the difference of rotation and projection. In order to visualize the ideas, let’s consider a case of D=3. Assume that you have got an orthonormal rotation matrix U = (\boldsymbol{u}_1 \: \boldsymbol{u}_2 \: \boldsymbol{u}_3) which diagonalizes A. In the last article I said diagonalization is equivalent to finding new orthogonal axes formed by eigenvectors, and in the case of this section you got new orthonoramal basis (\boldsymbol{u}_1, \boldsymbol{u}_2, \boldsymbol{u}_3) which are in red in the figure below. Projecting a point \boldsymbol{x} = (x, y, z) on the new orthonormal basis is simple: you just have to multiply \boldsymbol{x} with U^T. Let U^T \boldsymbol{x} be (x', y', z')^T, and then \left( \begin{array}{c} x' \\ y' \\ z' \end{array} \right) = U^T\boldsymbol{x} = \left( \begin{array}{c} \boldsymbol{u}_1^{T}\boldsymbol{x} \\ \boldsymbol{u}_2^{T}\boldsymbol{x} \\ \boldsymbol{u}_3^{T}\boldsymbol{x} \end{array} \right). You can see x', y', z' are \boldsymbol{x} projected on \boldsymbol{u}_1, \boldsymbol{u}_2, \boldsymbol{u}_3 respectively, and the left side of the figure below shows the idea. When you replace the orginal orthonormal basis (\boldsymbol{e}_1, \boldsymbol{e}_2, \boldsymbol{e}_3) with (\boldsymbol{u}_1, \boldsymbol{u}_2, \boldsymbol{u}_3) as in the right side of the figure below, you can comprehend the projection as a rotation from (x, y, z) to (x', y', z') by a rotation matrix U^T.

Next, let’s see what rotation is. In case of rotation, you should imagine that you rotate the point \boldsymbol{x} in the same coordinate system, rather than projecting to other coordinate system. You can rotate \boldsymbol{x} by multiplying it with U. This rotation looks like the figure below.

In the initial position, the edges of the cube are aligned with the three orthogonal black axes (\boldsymbol{e}_1,  \boldsymbol{e}_2 , \boldsymbol{e}_3), with one corner of the cube located at the origin point of those axes. The purple dot denotes the corner of the cube directly opposite the origin corner. The cube is rotated in three dimensions, with the origin corner staying fixed in place. After the rotation with a pivot at the origin, the edges of the cube are now aligned with a new set of orthogonal axes (\boldsymbol{u}_1,  \boldsymbol{u}_2 , \boldsymbol{u}_3), shown in red. You might understand that more clearly with an equation: U\boldsymbol{x} = (\boldsymbol{u}_1 \: \boldsymbol{u}_2 \: \boldsymbol{u}_3) \left( \begin{array}{c} x \\ y \\ z \end{array} \right) = x\boldsymbol{u}_1 + y\boldsymbol{u}_2 + z\boldsymbol{u}_3. In short this rotation means you keep relative position of \boldsymbol{x}, I mean its coordinates (x, y, z), in the new orthonormal basis. In this article, let me call this a “cube rotation.”

The discussion above can be generalized to spaces with dimensions higher than 3. When U \in \mathbb{R}^{D \times D} is an orthonormal matrix and a vector \boldsymbol{x} \in \mathbb{R}^D, you can project \boldsymbol{x} to \boldsymbol{x}' = U^T \boldsymbol{x}or rotate it to \boldsymbol{x}'' = U \boldsymbol{x}, where \boldsymbol{x}' = (x_{1}', \dots, x_{D}')^T and \boldsymbol{x}'' = (x_{1}'', \dots, x_{D}'')^T. In other words \boldsymbol{x} = U \boldsymbol{x}', which means you can rotate back \boldsymbol{x}' to the original point \boldsymbol{x} with the rotation matrix U.

I think you at least saw that rotation and projection are basically the same, and that is only a matter of how you look at the coordinate systems. But I would say the idea of projection is more important through out this article.

Let’s consider a function f(\boldsymbol{x}; A) = \boldsymbol{x}^T A \boldsymbol{x} = (\boldsymbol{x}, A \boldsymbol{x}), where A\in \mathbb{R}^{D\times D} is a real symmetric matrix. The distribution of f(\boldsymbol{x}; A) is quadratic curves whose center point covers the origin, and it is known that you can express this distribution in a much simpler way using eigenvectors. When you project this function on eigenvectors of A, that is when you substitute U \boldsymbol{x}' for \boldsymbol{x}, you get f = (\boldsymbol{x}, A \boldsymbol{x}) =(U \boldsymbol{x}', AU \boldsymbol{x}') = (\boldsymbol{x}')^T U^TAU \boldsymbol{x}' = (\boldsymbol{x}')^T \Lambda \boldsymbol{x}' = \lambda_1 ({x'}_1)^2 + \cdots + \lambda_D ({x'}_D)^2. You can always diagonalize real symmetric matrices, so the formula implies that the shapes of quadratic curves largely depend on eigenvectors. We are going to see this in detail in the next section.

*(\boldsymbol{x}, \boldsymbol{y}) denotes an inner product of \boldsymbol{x} and \boldsymbol{y}.

*We are going to see details of the shapes of quadratic “curves” or “functions” in the next section.

To be exact, you cannot naively multiply U or U^T for rotation. Let’s take a part of data I showed in the last article as an example. In the figure below, I projected data on the basis (\boldsymbol{u}_1,  \boldsymbol{u}_2 , \boldsymbol{u}_3).

You might have noticed that you cannot do a “cube rotation” in this case. If you make the coordinate system (\boldsymbol{u}_1, \boldsymbol{u}_2, \boldsymbol{u}_3) with your left hand, like you might have done in science classes in school to learn Fleming’s rule, you would soon realize that the coordinate systems in the figure above do not match. You need to flip the direction of one axis to match them.

Mathematically, you have to consider the determinant of the rotation matrix U. You can do a “cube rotation” when det(U)=1, and in the case above det(U) was -1, and you needed to flip one axis to make the determinant 1. In the example in the figure below, you can match the basis. This also can be generalized to higher dimensions, but that is also beyond the scope of this article series. If you are really interested, you should prepare some coffee and snacks and textbooks on linear algebra, and some weekends.

When you want to make general ellipsoids in a 3d space on Matplotlib, you can take advantage of rotation matrices. You first make a simple ellipsoid symmetric about xyz axis using polar coordinates, and you can rotate the whole ellipsoid with rotation matrices. I made some simple modules for drawing ellipsoid. If you put in a rotation matrix which diagonalize the covariance matrix of data and a list of three radiuses \sqrt{\lambda_1}, \sqrt{\lambda_2}, \sqrt{\lambda_3}, you can rotate the original ellipsoid so that it fits the data well.

3 Types of quadratic curves.

*This article might look like a mathematical writing, but I would say this is more about computer science. Please tolerate some inaccuracy in terms of mathematics. I gave priority to visualizing necessary mathematical ideas in my article series. If you are not sure about details, please let me know.

In linear dimension reduction, or at least in this article series you mainly have to consider ellipsoids. However ellipsoids are just one type of quadratic curves. In the last article, I mentioned that when the center of a D dimensional ellipsoid is the origin point of a normal coordinate system, the formula of the surface of the ellipsoid is as follows: (\boldsymbol{x}, A\boldsymbol{x})=1, where A satisfies certain conditions. To be concrete, when (\boldsymbol{x}, A\boldsymbol{x})=1 is the surface of a ellipsoid, A has to be diagonalizable and positive definite.

*Real symmetric matrices are diagonalizable, and positive definite matrices have only positive eigenvalues. Covariance matrices \Sigma, whose displacement vectors I visualized in the last two articles, are known to be symmetric real matrices and positive semi-defintie. However, the surface of an ellipsoid which fit the data is \boldsymbol{x}^T \Sigma ^{-1} \boldsymbol{x} = const., not \boldsymbol{x}^T \Sigma \boldsymbol{x} = const..

*You have to keep it in mind that \boldsymbol{x} are all deviations.

*You do not have to think too much about what the “semi” of the term “positive semi-definite” means fow now.

As you could imagine, this is just one simple case of richer variety of graphs. Let’s consider a 3-dimensional space. Any quadratic curves in this space can be denoted as ax^2 + by^2 + cz^2 + dxy + eyz + fxz + px + qy + rz + s = 0, where at least one of a, b, c, d, e, f, p, q, r, s is not 0.  Let \boldsymbol{x} be (x, y, z)^T, then the quadratic curves can be simply denoted with a 3\times 3 matrix A and a 3-dimensional vector \boldsymbol{b} as follows: \boldsymbol{x}^T A\boldsymbol{x} + 2\boldsymbol{b}^T\boldsymbol{x} + s = 0, where A = \left( \begin{array}{ccc} a & \frac{d}{2} & \frac{f}{2} \\ \frac{d}{2} & b & \frac{e}{2} \\ \frac{f}{2} & \frac{e}{2} & c \end{array} \right), \boldsymbol{b} = \left( \begin{array}{c} \frac{p}{2} \\ \frac{q}{2} \\ \frac{r}{2} \end{array} \right). General quadratic curves are roughly classified into the 9 types below.
You can shift these quadratic curves so that their center points come to the origin, without rotation, and the resulting curves are as follows. The curves can be all denoted as \boldsymbol{x}^T A\boldsymbol{x}.

As you can see, A is a real symmetric matrix. As I have mentioned repeatedly, when all the elements of a D \times D symmetric matrix A are real values and its eigen values are \lambda_{i} (i=1, \dots , D), there exist orthogonal/orthonormal matrices U such that U^{-1}AU = \Lambda, where \Lambda = diag(\lambda_{1}, \dots , \lambda_{D}). Hence, you can diagonalize the A = \left( \begin{array}{ccc} a & \frac{d}{2} & \frac{f}{2} \\ \frac{d}{2} & b & \frac{e}{2} \\ \frac{f}{2} & \frac{e}{2} & c \end{array} \right) with an orthogonal matrix U. Let U be an orthogonal matrix such that U^T A U = \left( \begin{array}{ccc} \alpha  & 0 & 0 \\ 0 & \beta & 0 \\ 0 & 0 & \gamma \end{array} \right) =\left( \begin{array}{ccc} \lambda_1  & 0 & 0 \\ 0 & \lambda_2 & 0 \\ 0 & 0 & \lambda_3 \end{array} \right). After you apply rotation by U to the curves (a)” ~ (i)”, those curves are symmetrically placed about the xyz axes, and their center points still cross the origin. The resulting curves look like below. Or rather I should say you projected (a)’ ~ (i)’ on their eigenvectors.
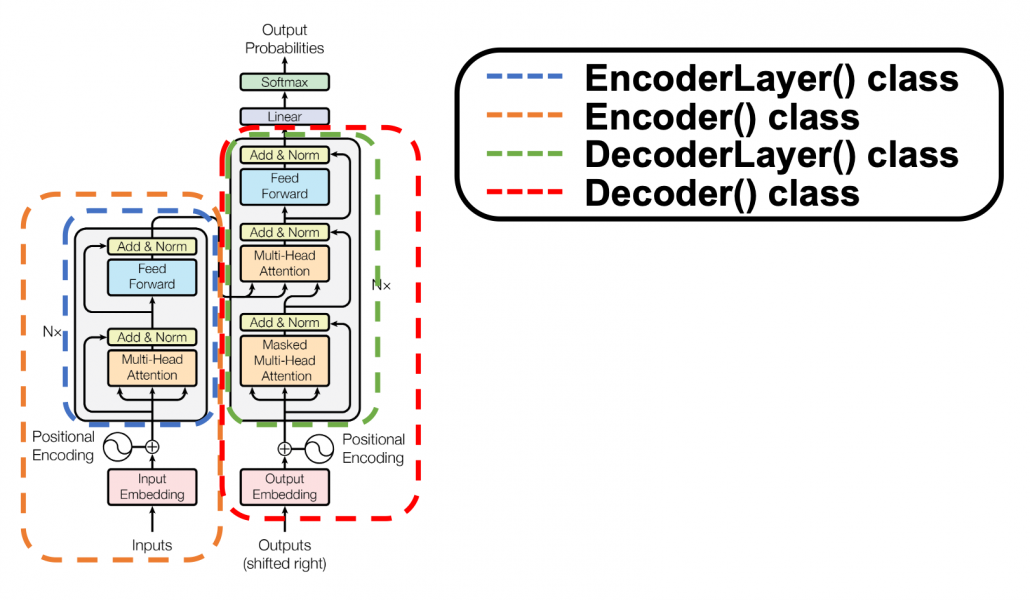
In this article mainly (a)” , (g)”, (h)”, and (i)” are important. General equations for the curves is as follows

  • (a)”: \frac{x^2}{l^2} + \frac{y^2}{m^2} + \frac{z^2}{n^2} = 1
  • (g)”: z = \frac{x^2}{l^2} + \frac{y^2}{m^2}
  • (h)”: z = \frac{x^2}{l^2} - \frac{y^2}{m^2}
  • (i)”: z = \frac{x^2}{l^2}

, where l, m, n \in \mathbb{R}^+.

Even if this section has been puzzling to you, you just have to keep one point in your mind: we have been discussing general quadratic curves, but in PCA, you only need to consider a case where A is a covariance matrix, that is A=\Sigma. PCA corresponds to the case where you shift and rotate the curve (a) into (a)”. Subtracting the mean of data from each point of data corresponds to shifting quadratic curve (a) to (a)’. Calculating eigenvectors of A corresponds to calculating a rotation matrix U such that the curve (a)’ comes to (a)” after applying the rotation, or projecting curves on eigenvectors of \Sigma. Importantly we are only discussing the covariance of certain data, not the distribution of the data itself.

*Just in case you are interested in a little more mathematical sides: it is known that if you rotate all the points \boldsymbol{x} on the curve \boldsymbol{x}^T A\boldsymbol{x} + 2\boldsymbol{b}^T\boldsymbol{x} + s = 0 with the rotation matrix P, those points \boldsymbol{x} are mapped into a new quadratic curve \alpha x^2 + \beta y^2 + \gamma z^2 + \lambda x + \mu y + \nu z + \rho = 0. That means the rotation of the original quadratic curve with P (or rather rotating axes) enables getting rid of the terms xy, yz, zx. Also it is known that when \alpha ' \neq 0, with proper translations and rotations, the quadratic curve \alpha x^2 + \beta y^2 + \gamma z^2 + \lambda x + \mu y + \nu z + \rho = 0 can be mapped into one of the types of quadratic curves in the figure below, depending on coefficients of the original quadratic curve. And the discussion so far can be generalized to higher dimensional spaces, but that is beyond the scope of this article series. Please consult decent textbooks on linear algebra around you for further details.

4 Eigenvectors are gradients and sometimes variances.

In the second section I explained that you can express quadratic functions f(\boldsymbol{x}; A) = \boldsymbol{x}^T A \boldsymbol{x} in a very simple way by projecting \boldsymbol{x} on eigenvectors of A.

You can comprehend what I have explained in another way: eigenvectors, to be exact eigenvectors of real symmetric matrices A, are gradients. And in case of PCA, I mean when A=\Sigma eigenvalues are also variances. Before explaining what that means, let me explain a little of the totally common facts on mathematics. If you have variables \boldsymbol{x}\in \mathbb{R}^D, I think you can comprehend functions f(\boldysmbol{x}) in two ways. One is a normal “functions” f(\boldsymbol{x}), and the others are “curves” f(\boldsymbol{x}) = const.. “Functions” get an input \boldsymbol{x} and gives out an output f(\boldsymbol{x}), just as well as normal functions you would imagine. “Curves” are rather sets of \boldsymbol{x} \in \mathbb{R}^D such that f(\boldsymbol{x}) = const..

*Please assume that the terms “functions” and “curves” are my original words. I use them just in case I fail to use functions and curves properly.

The quadratic curves in the figure above are all “curves” in my term, which can be denoted as f(\boldsymbol{x}; A_3, \boldsymbol{b}_3)=const or f(\boldsymbol{x}; A_3)=const. However if you replace z of (g)”, (h)”, and (i)” with f, you can interpret the “curves” as “functions” which are denoted as f(\boldsymbol{x}; A_2). This might sounds too obvious to you, and my point is you can visualize how values of “functions” change only when the inputs are 2 dimensional.

When a symmetric 2\times 2 real matrices A_2 have two eigenvalues \lambda_1, \lambda_2, the distribution of quadratic curves can be roughly classified to the following three types.

  • (g): Both \lambda_1 and \lambda_2 are positive or negative.
  • (h): Either of \lambda_1 or \lambda_2 is positive and the other is negative.
  • (i): Either of \lambda_1 or \lambda_2 is 0 and the other is not.

The equations of (g)” , (h)”, and (i)” correspond to each type of f=(\boldsymbol{x}; A_2), and thier curves look like the three graphs below.

And in fact, when start from the origin and go in the direction of an eigenvector \boldsymbol{u}_i, \lambda_i is the gradient of the direction. You can see that more clearly when you restrict the distribution of f=(\boldsymbol{x}; A_2) to a unit circle. Like in the figure below, in case \lambda_1 = 7, \lambda_2 = 3, which is classified to (g), the distribution looks like the left side, and if you restrict the distribution in the unit circle, the distribution looks like a bowl like the middle and the right side. When you move in the direction of \boldsymbol{u}_1, you can climb the bowl as as high as \lambda_1, in \boldsymbol{u}_2 as high as \lambda_2.

Also in case of (h), the same facts hold. But in this case, you can also descend the curve.

*You might have seen the curve above in the context of optimization with stochastic gradient descent. The origin of the curve above is a notorious saddle point, where gradients are all 0 in any directions but not a local maximum or minimum. Points can be stuck in this point during optimization.

Especially in case of PCA, A is a covariance matrix, thus A=\Sigma. Eigenvalues of \Sigma are all equal to or greater than 0. And it is known that in this case \lambda_i is the variance of data projected on its corresponding eigenvector \boldsymbol{u}_i (i=0, \dots , D). Hence, if you project f(\boldsymbol{x}; \Sigma), quadratic curves formed by a covariance matrix \Sigma, on eigenvectors of \Sigma, you get f(\boldsymbol{x}; \Sigma) = ({x'}_1 \: \dots \: {x'}_D) (\lambda_1 {x'}_1 \: \dots \: \lambda_D {x'}_D)^t =\lambda_1 ({x'}_1)^2 + \cdots + \lambda_D ({x'}_D)^2.  This shows that you can re-weight ({x'}_1 \: \dots \: {x'}_D), the coordinates of data projected projected on eigenvectors of A, with \lambda_1, \dots, \lambda_D, which are variances ({x'}_1 \: \dots \: {x'}_D). As I mentioned in an example of data of exam scores in the last article, the bigger a variance \lambda_i is, the more the feature described by \boldsymbol{u}_i vary from sample to sample. In other words, you can ignore eigenvectors corresponding to small eigenvalues.

That is a great hint why principal components corresponding to large eigenvectors contain much information of the data distribution. And you can also interpret PCA as a “climbing” a bowl of f(\boldsymbol{x}; A_D), as I have visualized in the case of (g) type curve in the figure above.

*But as I have repeatedly mentioned, ellipsoid which fit data well isf(\boldsymbol{x}; \Sigma ^{-1}) =(\boldsymbol{x}')^T diag(\frac{1}{\lambda_1}, \dots, \frac{1}{\lambda_D})\boldsymbol{x}' = \frac{({x'}_{1})^2}{\lambda_1} + \cdots + \frac{({x'}_{D})^2}{\lambda_D} = const..

*You have to be careful that even if you slice a type (h) curve f(\boldsymbol{x}; A_D) with a place z=const. the resulting cross section does not fit the original data well because the equation of the cross section is \lambda_1 ({x'}_1)^2 + \cdots + \lambda_D ({x'}_D)^2 = const. The figure below is an example of slicing the same f(\boldsymbol{x}; A_2) as the one above with z=1, and the resulting cross section.

As we have seen, \lambda_i, the eigenvalues of the covariance matrix of data are variances or data when projected on it eigenvectors. At the same time, when you fit an ellipsoid on the data, \sqrt{\lambda_i} is the radius of the ellipsoid corresponding to \boldsymbol{u}_i. Thus ignoring data projected on eigenvectors corresponding to small eigenvalues is equivalent to cutting of the axes of the ellipsoid with small radiusses.

I have explained PCA in three different ways over three articles.

  • The second article: I focused on what kind of linear transformations convariance matrices \Sigma enable, by visualizing displacement vectors. And those vectors look like swirling and extending into directions of eigenvectors of \Sigma.
  • The third article: We directly found directions where certain data distribution “swell” the most, to find that data swell the most in directions of eigenvectors.
  • In this article, we have seen PCA corresponds to only one case of quadratic functions, where the matrix A is a covariance matrix. When you go in the directions of eigenvectors corresponding to big eigenvalues, the quadratic function increases the most. Also that means data samples have bigger variances when projected on the eigenvectors. Thus you can cut off eigenvectors corresponding to small eigenvectors because they retain little information about data, and that is equivalent to fitting an ellipsoid on data and cutting off axes with small radiuses.

*Let A be a covariance matrix, and you can diagonalize it with an orthogonal matrix U as follow: U^{T}AU = \Lambda, where \Lambda = diag(\lambda_1, \dots, \lambda_D). Thus A = U \Lambda U^{T}. U is a rotation, and multiplying a \boldsymbol{x} with \Lambda means you multiply each eigenvalue to each element of \boldsymbol{x}. At the end U^T enables the reverse rotation.

If you get data like the left side of the figure below, most explanation on PCA would just fit an oval on this data distribution. However after reading this articles series so far, you would have learned to see PCA from different viewpoints like at the right side of the figure below.


5 Ellipsoids in Gaussian distributions.

I have explained that if the covariance of a data distribution is \boldsymbol{\Sigma}, the ellipsoid which fits the distribution the best is \bigl((\boldsymbol{x} - \boldsymbol{\mu}), \boldsymbol{\Sigma}^{-1}(\boldsymbol{x} - \boldsymbol{\mu})\bigr) = 1. You might have seen the part \bigl((\boldsymbol{x} - \boldsymbol{\mu}), \boldsymbol{\Sigma}^{-1}(\boldsymbol{x} - \boldsymbol{\mu})\bigr) = (\boldsymbol{x} - \boldsymbol{\mu}) \boldsymbol{\Sigma}^{-1}(\boldsymbol{x} - \boldsymbol{\mu}) somewhere else. It is the exponent of general Gaussian distributions: \mathcal{N}(\boldsymbol{x} | \boldsymbol{\mu}, \boldsymbol{\Sigma}) = \frac{1}{(2\pi)^{D/2}} \frac{1}{|\boldsymbol{\Sigma}|} exp\{ -\frac{1}{2}(\boldsymbol{x} - \boldsymbol{\mu}) \boldsymbol{\Sigma}^{-1}(\boldsymbol{x} - \boldsymbol{\mu}) \}.  It is known that the eigenvalues of \Sigma ^{-1} are \frac{1}{\lambda_1}, \dots, \frac{1}{\lambda_D}, and eigenvectors corresponding to each eigenvalue are also \boldsymbol{u}_1, \dots, \boldsymbol{u}_D respectively. Hence just as well as what we have seen, if you project (\boldsymbol{x} - \boldsymbol{\mu}) on each eigenvector of \Sigma ^{-1}, we can convert the exponent of the Gaussian distribution.

Let -\frac{1}{2}(\boldsymbol{x} - \boldsymbol{\mu}) \boldsymbol{\Sigma}^{-1}(\boldsymbol{x} - \boldsymbol{\mu}) be \boldsymbol{y} and U ^{-1} \boldsymbol{y}= U^{T} \boldsymbol{y} be \boldsymbol{y}', where U=(\boldsymbol{u}_1 \: \dots \: \boldsymbol{u}_D). Just as we have seen, (\boldsymbol{x} - \boldsymbol{\mu}) \boldsymbol{\Sigma}^{-1}(\boldsymbol{x} - \boldsymbol{\mu}) =\boldsymbol{y}^T\Sigma^{-1} \boldsymbol{y} =(U\boldsymbol{y}')^T \Sigma^{-1} U\boldsymbol{y}' =((\boldsymbol{y}')^T U^T \Sigma^{-1} U\boldsymbol{y}' = (\boldsymbol{y}')^T diag(\frac{1}{\lambda_1}, \dots, \frac{1}{\lambda_D}) \boldsymbol{y}' = \frac{({y'}_{1})^2}{\lambda_1} + \cdots + \frac{({y'}_{D})^2}{\lambda_D}. Hence \mathcal{N}(\boldsymbol{x} | \boldsymbol{\mu}, \boldsymbol{\Sigma}) = \frac{1}{(2\pi)^{D/2}} \frac{1}{|\boldsymbol{\Sigma}|} exp\{ -\frac{1}{2}(\boldsymbol{y}) \boldsymbol{\Sigma}^{-1}(\boldsymbol{y}) \} =  \frac{1}{(2\pi)^{D/2}} \frac{1}{|\boldsymbol{\Sigma}|} exp\{ -\frac{1}{2}(\frac{({y'}_{1})^2}{\lambda_1} + \cdots + \frac{({y'}_{D})^2}{\lambda_D} ) \} =\frac{1}{(2\pi)^{1/2}} \frac{1}{|\boldsymbol{\Sigma}|} exp\biggl( -\frac{1}{2} \frac{({y'}_{1})^2}{\lambda_1} \biggl) \cdots \frac{1}{(2\pi)^{1/2}} \frac{1}{|\boldsymbol{\Sigma}|} exp\biggl( -\frac{1}{2}\frac{({y'}_{D})^2}{\lambda_D} \biggl).

*To be mathematically exact about changing variants of normal distributions, you have to consider for example Jacobian matrices.

This results above demonstrate that, by projecting data on the eigenvectors of its covariance matrix, you can factorize the original multi-dimensional Gaussian distribution into a product of Gaussian distributions which are irrelevant to each other. However, at the same time, that is the potential limit of approximating data with PCA. This idea is going to be more important when you think about more probabilistic ways to handle PCA, which is more robust to lack of data.

I have explained PCA over 3 articles from various viewpoints. If you have been patient enough to read my article series, I think you have gained some deeper insight into not only PCA, but also linear algebra, and that should be helpful when you learn or teach data science. I hope my codes also help you. In fact these are not the only topics about PCA. There are a lot of important PCA-like algorithms.

In fact our expedition of ellipsoids, or PCA still continues, just as Star Wars series still continues. Especially if I have to explain an algorithm named probabilistic PCA, I need to explain the “Bayesian world” of machine learning. Most machine learning algorithms covered by major introductory textbooks tend to be too deterministic and dependent on the size of data. Many of those algorithms have another “parallel world,” where you can handle inaccuracy in better ways. I hope I can also write about them, and I might prepare another trilogy for such PCA. But I will not disappoint you, like “The Phantom Menace.”

Appendix: making a model of a bunch of grape with ellipsoid berries.

If you can control quadratic curves, reshaping and rotating them, you can make a model of a grape of olive bunch on Matplotlib. I made a program of making a model of a bunch of berries on Matplotlib using the module to draw ellipsoids which I introduced earlier. You can check the codes in this page.

*I have no idea how many people on this earth are in need of making such models.

I made some modules so that you can see the grape bunch from several angles. This might look very simple to you, but the locations of berries are organized carefully so that it looks like they are placed around a stem and that the berries are not too close to each other.


The programming code I created for this article is completly available here.

[Refereces]

[1]C. M. Bishop, “Pattern Recognition and Machine Learning,” (2006), Springer, pp. 78-83, 559-577

[2]「理工系新課程 線形代数 基礎から応用まで」, 培風館、(2017)

[3]「これなら分かる 最適化数学 基礎原理から計算手法まで」, 金谷健一著、共立出版, (2019), pp. 17-49

[4]「これなら分かる 応用数学教室 最小二乗法からウェーブレットまで」, 金谷健一著、共立出版, (2019), pp.165-208

[5] 「サボテンパイソン 」
https://sabopy.com/


How to make a toy English-German translator with multi-head attention heat maps: the overall architecture of Transformer

If you have been patient enough to read the former articles of this article series Instructions on Transformer for people outside NLP field, but with examples of NLP, you should have already learned a great deal of Transformer model, and I hope you gained a solid foundation of learning theoretical sides on this algorithm.

This article is going to focus more on practical implementation of a transformer model. We use codes in the Tensorflow official tutorial. They are maintained well by Google, and I think it is the best practice to use widely known codes.

The figure below shows what I have explained in the articles so far. Depending on your level of understanding, you can go back to my former articles. If you are familiar with NLP with deep learning, you can start with the third article.

1 The datasets

I think this article series appears to be on NLP, and I do believe that learning Transformer through NLP examples is very effective. But I cannot delve into effective techniques of processing corpus in each language. Thus we are going to use a library named BPEmb. This library enables you to encode any sentences in various languages into lists of integers. And conversely you can decode lists of integers to the language. Thanks to this library, we do not have to do simplification of alphabets, such as getting rid of Umlaut.

*Actually, I am studying in computer vision field, so my codes would look elementary to those in NLP fields.

The official Tensorflow tutorial makes a Portuguese-English translator, but in article we are going to make an English-German translator. Basically, only the codes below are my original. As I said, this is not an article on NLP, so all you have to know is that at every iteration you get a batch of (64, 41) sized tensor as the source sentences, and a batch of (64, 42) tensor as corresponding target sentences. 41, 42 are respectively the maximum lengths of the input or target sentences, and when input sentences are shorter than them, the rest positions are zero padded, as you can see in the codes below.

*If you just replace datasets and modules for encoding, you can make translators of other pairs of languages.

We are going to train a seq2seq-like Transformer model of converting those list of integers, thus a mapping from a vector to another vector. But each word, or integer is encoded as an embedding vector, so virtually the Transformer model is going to learn a mapping from sequence data to another sequence data. Let’s formulate this into a bit more mathematics-like way: when we get a pair of sequence data \boldsymbol{X} = (\boldsymbol{x}^{(1)}, \dots, \boldsymbol{x}^{(\tau _x)}) and \boldsymbol{Y} = (\boldsymbol{y}^{(1)}, \dots, \boldsymbol{y}^{(\tau _y)}), where \boldsymbol{x}^{(t)} \in \mathbb{R}^{|\mathcal{V}_{\mathcal{X}}|}, \boldsymbol{x}^{(t)} \in \mathbb{R}^{|\mathcal{V}_{\mathcal{Y}}|}, respectively from English and German corpus, then we learn a mapping f: \boldsymbol{X} \to \boldsymbol{Y}.

*In this implementation the vocabulary sizes are both 10002. Thus |\mathcal{V}_{\mathcal{X}}|=|\mathcal{V}_{\mathcal{Y}}|=10002

2 The whole architecture

This article series has covered most of components of Transformer model, but you might not understand how seq2seq-like models can be constructed with them. It is very effective to understand how transformer is constructed by actually reading or writing codes, and in this article we are finally going to construct the whole architecture of a Transforme translator, following the Tensorflow official tutorial. At the end of this article, you would be able to make a toy English-German translator.

The implementation is mainly composed of 4 classes, EncoderLayer(), Encoder(), DecoderLayer(), and Decoder() class. The inclusion relations of the classes are displayed in the figure below.

To be more exact in a seq2seq-like model with Transformer, the encoder and the decoder are connected like in the figure below. The encoder part keeps converting input sentences in the original language through N layers. The decoder part also keeps converting the inputs in the target languages, also through N layers, but it receives the output of the final layer of the Encoder at every layer.

You can see how the Encoder() class and the Decoder() class are combined in Transformer in the codes below. If you have used Tensorflow or Pytorch to some extent, the codes below should not be that hard to read.

3 The encoder

*From now on “sentences” do not mean only the input tokens in natural language, but also the reweighted and concatenated “values,” which I repeatedly explained in explained in the former articles. By the end of this section, you will see that Transformer repeatedly converts sentences layer by layer, remaining the shape of the original sentence.

I have explained multi-head attention mechanism in the third article, precisely, and I explained positional encoding and masked multi-head attention in the last article. Thus if you have read them and have ever written some codes in Tensorflow or Pytorch, I think the codes of Transformer in the official Tensorflow tutorial is not so hard to read. What is more, you do not use CNNs or RNNs in this implementation. Basically all you need is linear transformations. First of all let’s see how the EncoderLayer() and the Encoder() classes are implemented in the codes below.

You might be confused what “Feed Forward” means in  this article or the original paper on Transformer. The original paper says this layer is calculated as FFN(x) = max(0, xW_1 + b_1)W_2 +b_2. In short you stack two fully connected layers and activate it with a ReLU function. Let’s see how point_wise_feed_forward_network() function works in the implementation with some simple codes. As you can see from the number of parameters in each layer of the position wise feed forward neural network, the network does not depend on the length of the sentences.

From the number of parameters of the position-wise feed forward neural networks, you can see that you share the same parameters over all the positions of the sentences. That means in the figure above, you use the same densely connected layers at all the positions, in single layer. But you also have to keep it in mind that parameters for position-wise feed-forward networks change from layer to layer. That is also true of “Layer” parts in Transformer model, including the output part of the decoder: there are no learnable parameters which cover over different positions of tokens. These facts lead to one very important feature of Transformer: the number of parameters does not depend on the length of input or target sentences. You can offset the influences of the length of sentences with multi-head attention mechanisms. Also in the decoder part, you can keep the shape of sentences, or reweighted values, layer by layer, which is expected to enhance calculation efficiency of Transformer models.

4, The decoder

The structures of DecoderLayer() and the Decoder() classes are quite similar to those of EncoderLayer() and the Encoder() classes, so if you understand the last section, you would not find it hard to understand the codes below. What you have to care additionally in this section is inter-language multi-head attention mechanism. In the third article I was repeatedly explaining multi-head self attention mechanism, taking the input sentence “Anthony Hopkins admired Michael Bay as a great director.” as an example. However, as I explained in the second article, usually in attention mechanism, you compare sentences with the same meaning in two languages. Thus the decoder part of Transformer model has not only self-attention multi-head attention mechanism of the target sentence, but also an inter-language multi-head attention mechanism. That means, In case of translating from English to German, you compare the sentence “Anthony Hopkins hat Michael Bay als einen großartigen Regisseur bewundert.” with the sentence itself in masked multi-head attention mechanism (, just as I repeatedly explained in the third article). On the other hand, you compare “Anthony Hopkins hat Michael Bay als einen großartigen Regisseur bewundert.” with “Anthony Hopkins admired Michael Bay as a great director.” in the inter-language multi-head attention mechanism (, just as you can see in the figure above).

*The “inter-language multi-head attention mechanism” is my original way to call it.

I briefly mentioned how you calculate the inter-language multi-head attention mechanism in the end of the third article, with some simple codes, but let’s see that again, with more straightforward figures. If you understand my explanation on multi-head attention mechanism in the third article, the inter-language multi-head attention mechanism is nothing difficult to understand. In the multi-head attention mechanism in encoder layers, “queries”, “keys”, and “values” come from the same sentence in English, but in case of inter-language one, only “keys” and “values” come from the original sentence, and “queries” come from the target sentence. You compare “queries” in German with the “keys” in the original sentence in English, and you re-weight the sentence in English. You use the re-weighted English sentence in the decoder part, and you do not need look-ahead mask in this inter-language multi-head attention mechanism.

Just as well as multi-head self-attention, you can calculate inter-language multi-head attention mechanism as follows: softmax(\frac{\boldsymbol{Q} \boldsymbol{K} ^T}{\sqrt{d}_k}). In the example above, the resulting multi-head attention map is a 10 \times 9 matrix like in the figure below.

Once you keep the points above in you mind, the implementation of the decoder part should not be that hard.

5 Masking tokens in practice

I explained masked-multi-head attention mechanism in the last article, and the ideas itself is not so difficult. However in practice this is implemented in a little tricky way. You might have realized that the size of input matrices is fixed so that it fits the longest sentence. That means, when the maximum length of the input sentences is 41, even if the sentences in a batch have less than 41 tokens, you sample (64, 41) sized tensor as a batch every time (The 64 is a batch size). Let “Anthony Hopkins admired Michael Bay as a great director.”, which has 9 tokens in total, be an input. We have been considering calculating (9, 9) sized attention maps or (10, 9) sized attention maps, but in practice you use (41, 41) or (42, 41) sized ones. When it comes to calculating self attentions in the encoder part, you zero pad self attention maps with encoder padding masks, like in the figure below. The black dots denote the zero valued elements.

As you can see in the codes below, encode padding masks are quite simple. You just multiply the padding masks with -1e9 and add them to attention maps and apply a softmax function. Thereby you can zero-pad the columns in the positions/columns where you added -1e9 to.

I explained look ahead mask in the last article, and in practice you combine normal padding masks and look ahead masks like in the figure below. You can see that you can compare each token with only its previous tokens. For example you can compare “als” only with “Anthony”, “Hopkins”, “hat”, “Michael”, “Bay”, “als”, not with “einen”, “großartigen”, “Regisseur” or “bewundert.”

Decoder padding masks are almost the same as encoder one. You have to keep it in mind that you zero pad positions which surpassed the length of the source input sentence.

6 Decoding process

In the last section we have seen that we can zero-pad columns, but still the rows are redundant. However I guess that is not a big problem because you decode the final output in the direction of the rows of attention maps. Once you decode <end> token, you stop decoding. The redundant rows would not affect the decoding anymore.

This decoding process is similar to that of seq2seq models with RNNs, and that is why you need to hide future tokens in the self-multi-head attention mechanism in the decoder. You share the same densely connected layers followed by a softmax function, at all the time steps of decoding. Transformer has to learn how to decode only based on the words which have appeared so far.

According to the original paper, “We also modify the self-attention sub-layer in the decoder stack to prevent positions from attending to subsequent positions. This masking, combined with fact that the output embeddings are offset by one position, ensures that the predictions for position i can depend only on the known outputs at positions less than i.” After these explanations, I think you understand the part more clearly.

The codes blow is for the decoding part. You can see that you first start decoding an output sentence with a sentence composed of only <start>, and you decide which word to decoded, step by step.

*It easy to imagine that this decoding procedure is not the best. In reality you have to consider some possibilities of decoding, and you can do that with beam search decoding.

After training this English-German translator for 30 epochs you can translate relatively simple English sentences into German. I displayed some results below, with heat maps of multi-head attention. Each colored attention maps corresponds to each head of multi-head attention. The examples below are all from the fourth (last) layer, but you can visualize maps in any layers. When it comes to look ahead attention, naturally only the lower triangular part of the maps is activated.

This article series has not covered some important topics machine translation, for example how to calculate translation errors. Actually there are many other fascinating topics related to machine translation. For example beam search decoding, which consider some decoding possibilities, or other topics like how to handle proper nouns such as “Anthony” or “Hopkins.” But this article series is not on NLP. I hope you could effectively learn the architecture of Transformer model with examples of languages so far. And also I have not explained some details of training the network, but I will not cover that because I think that depends on tasks. The next article is going to be the last one of this series, and I hope you can see how Transformer is applied in computer vision fields, in a more “linguistic” manner.

But anyway we have finally made it. In this article series we have seen that one of the earliest computers was invented to break Enigma. And today we can quickly make a more or less accurate translator on our desk. With Transformer models, you can even translate deadly funny jokes into German.

*You can train a translator with this code.

*After training a translator, you can translate English sentences into German with this code.

[References]

[1] Ashish Vaswani, Noam Shazeer, Niki Parmar, Jakob Uszkoreit, Llion Jones, Aidan N. Gomez, Lukasz Kaiser, Illia Polosukhin, “Attention Is All You Need” (2017)

[2] “Transformer model for language understanding,” Tensorflow Core
https://www.tensorflow.org/overview

[3] Jay Alammar, “The Illustrated Transformer,”
http://jalammar.github.io/illustrated-transformer/

[4] “Stanford CS224N: NLP with Deep Learning | Winter 2019 | Lecture 14 – Transformers and Self-Attention,” stanfordonline, (2019)
https://www.youtube.com/watch?v=5vcj8kSwBCY

[5]Tsuboi Yuuta, Unno Yuuya, Suzuki Jun, “Machine Learning Professional Series: Natural Language Processing with Deep Learning,” (2017), pp. 91-94
坪井祐太、海野裕也、鈴木潤 著, 「機械学習プロフェッショナルシリーズ 深層学習による自然言語処理」, (2017), pp. 191-193

* I make study materials on machine learning, sponsored by DATANOMIQ. I do my best to make my content as straightforward but as precise as possible. I include all of my reference sources. If you notice any mistakes in my materials, including grammatical errors, please let me know (email: yasuto.tamura@datanomiq.de). And if you have any advice for making my materials more understandable to learners, I would appreciate hearing it.

The Role Data Plays in Customer Relationship Management

Image Source: Pixabay

The longevity of your business is dependent on your customer relationships. The depth of your customer relationships is connected to how well they’re managed. How well you work your customer relationships relies on the data you collect about them, like buying behaviors, values, needs, and lifestyle choices.

In addition to collecting quality customer data, organizing and effectively analyzing this data is vital to creating content, products, services, and anything else that resonates with your current and potential customers. Building an accurate customer journey and successfully using data in customer relationship management results in retaining customers and acquiring new ones to help drive more sales.

How is data used to manage customer relationships and navigate your customer’s journey with your business? Let’s first examine the difference between business analytics and data science and their respective roles in the effective use of data. We’ll then touch on the role data plays in creating your customer journey map and the best ways to use data to educate your CRM team.

Business Analytics vs. Data Science: What’s the Difference?

Business analytics and data science both play integral roles in the collection and usage of data. Knowing the difference between business analytics and data science makes building and maintaining customer relationships more productive. When you see the difference between data science and business analytics, you can make informed decisions about marketing techniques, sales funnels, software use, and other operational choices using your CRM team’s data.

What is business analytics?

Business analytics is the process of collecting data on overall processes, software, and other products and services, understanding it, and using it to make better business decisions. Data mining strategies and predictive analytics are among the tools and techniques used to execute the above actions.

Business analysts are adept in:

  • Assessing and organizing raw data.
  • Analyzing data about how to help a business improve.
  • Forecasting and identifying patterns and sequences.
  • Data visualization and conceptualizing business “big pictures.”
  • Overall information optimization.
  • Working with stakeholders to help them understand data.

Business analytics differs from data science in that it’s primarily used to establish how customer, software, system, tool, and technique data influence business growth. It transforms information into actionable steps that incite progress within a company and connection with current and potential customers.

What is data science?

Data science analyzes the collection process, the most streamlined and efficient ways to process data, and the most effective ways to communicate complex information to an analyst or company leader responsible for making critical business decisions. Data science takes advantage of emerging technologies like artificial intelligence, algorithms, and machine learning systems.

Data scientists are adept in:

  • Evaluating specific questions and customer inquiries to develop data-driven strategies.
  • Managing and analyzing critical information with the help of advanced technology.
  • Detecting useful statistical patterns.
  • Cleaning or “scrubbing” data.
  • Making data easier to understand through efficient organization.
  • Understanding how to leverage algorithms.

Data science differs from business analytics in that its primary focus is on collecting useful data and understanding different ways to best process and implement the collected data. Data science isn’t necessarily concerned with choosing the best ways to implement the lessons learned from data collection. Instead, it focuses on clearly communicating what the data means and listing implementation strategies, and leaving the decision up to business analysts and company leaders.

The Role Data Plays in Creating a Strong Customer Journey

According to Lucidspark, “A customer journey map is a diagram that illustrates how your customers interact with your company and engage with your products, website, and/or services.” It gives you a holistic view of a customer’s life-cycle with your business, from how they’re introduced to your brand, retained long enough to make a purchase, and nurtured into a long-term customer relationship.

The collection of customer data allows you to honestly know your audience and target them with personalized sales and marketing campaigns. It’s essential to understand how to collect data and interpret and implement it to create personal relationships with customers that result in loyalty and retention.

Data’s role in creating a robust customer journey map includes:

  • Tracking why individual visitors don’t become customers.
  • Identifying gaps in user experience.
  • Understanding why people connect with your brand the way they do.
  • Identifying similarities your long-term customers have.
  • Identifying similarities new visitors have.
  • Highlighting what messaging resonates most with your customers.
  • Identifying marketing channels responsible for the most conversions.
  • Pinpointing the best ways to communicate with your customers.
  • Showing which digital platforms they make the most use of.
  • Highlighting specific pain points, challenges, and problems common among your customers.

Your customer journey map gives specific details about your customers that you can use to construct an accurate representation of how they’d experience your brand. The more detailed the data, the more precise the customer journey. You can accurately map out:

  • What problem or pain points do they have?
  • Precisely what would bring them to researching a solution?
  • How they’d choose your product as the solution?
  • How they’d choose your brand to purchase that product?
  • How do they make purchases in general?
  • How they’d potentially purchase your product?
  • How they’d receive your product and experience it?
  • How they’d ultimately become a loyal customer?

The Best Ways to Use Data to Inform Your CRM Team

How can you use data to inform your customer relationship management team?

Using data effectively to inform your CRM team starts with functional CRM software. A CRM software can help seamlessly establish a relationship with customers by ensuring all the right information is collected, stored, and grouped correctly. The organizational structure a CRM software offers makes it easier for your CRM team to leverage collected data and shift strategies to accommodate customer needs and values.

CRM software is only as efficient as your team members are. Each team member plays an integral role in analytics and understands human behavior that drives data collection. Practical data analysis can inform your CRM team and help them with things like:

  • Tailoring your social media content.
  • Tracking spending habits and purchasing patterns.
  • Catering website structure towards increased customer satisfaction.
  • Boosting organic traffic.
  • Identifying what data to collect and how to manage it.
  • Establishing goals for your marketing efforts.
  • Understanding the most efficient communication channels for your customers.
  • Identifying what lifestyle behaviors could influence them completing a purchase with your business.
  • Exploring paid advertising avenues.
  • Segmenting your customer base.
  • Constructing ads for digital platforms.
  • Furthering your business’ online presence.
  • Personalizing customer experiences with your brand through specific written content and visual media.
  • Converting visitors to paying customers through sales techniques.

The ultimate goal for data collection and CRM software is customer acquisition and retention. Your CRM team can also use data to engage with customers consistently, streamline marketing funnels, and improve profitability with better products and services. They’re responsible for finding out what specific data is essential to collect, how it relates to moving your business forward, how you can turn the data into actionable strategies.

Other ways data collection informs your CRM team and helps shape overall business strategy include:

  • Bettering customer resolution strategies and implementing simple systems for addressing customer issues.
  • Choosing the most effective marketing media, brand colors, and overall business aesthetic.
  • Generating personalized purchase recommendations and suggestions and automating how they’re sent to customers.
  • Identifying opportunities for customer retention and gaps in acquisition techniques.
  • Achieving a deeper understanding of the lifestyle your ideal customer lives.
  • Improving your consumer database with a clean, simple, concise organizational structure.

You Can Maneuver Your Customer Journey Through Effective Use of Data in CRM

Data shows your CRM team how your customers are interacting with the brand and experiencing each stage of the buyer’s journey. Data can show you exactly who and what to focus on in building brand awareness. Tailor your messaging, aesthetics, events, engagement techniques, and marketing to your ideal customer’s behaviors.

By intentionally tracking essential customer data, you can implement the following potential solutions to maintain a healthy connection with each customer:

  • Changing your brand colors to those that evoke emotions specific to how you want visitors to experience your product or service.
  • Experimenting with different Call-to-action or CTA button colors and messaging.
  • Shifting media and image choices to those most popular with loyal customers.
  • Focusing solely on social media platforms most used by your target audience.
  • Using marketing messaging to speak directly to their current experiences.
  • Using the platforms your target audience gets their information from.
  • Establishing a preferred communication method.
  • Offering a variety of payment options that appreciate advanced technology.

Your CRM team can use data to make sales and marketing decisions that best align with company goals. Collecting and using customer relationship management data is the best practice for any business looking to define their customer’s journey with their brand clearly.

5 AI Tricks to Grow Your Online Sales

The way people shop is currently changing. This only means that online stores need optimization to stay competitive and answer to the needs of customers. In this post, we’ll bring up the five ways in which you can use artificial intelligence technology in an online store to grow your revenues. Let’s begin!

1. Personalization with AI

Opening the list of AI trends that are certainly worth covering deals with a step up in personalization. Did you know that according to the results of a survey that was held by Accenture, more than 90% of shoppers are likelier to buy things from those stores and brands that propose suitable product recommendations?

This is exactly where artificial intelligence can give you a big hand. Such progressive technology analyzes the behavior of your consumers individually, keeping in mind their browsing and purchasing history. After collecting all the data, AI draws the necessary conclusions and offers those product recommendations that the user might like.

Look at the example below with the block has a carousel of neat product options. Obviously, this “move” can give a big boost to the average cart sizes.

Screenshot taken on the official Reebok website

Screenshot taken on the official Reebok website

2. Smarter Search Options

With the rise of the popularity of AI voice assistants and the leap in technology in general, the way people look for things on the web has changed. Everything is moving towards saving time and getting faster better results.

One of such trends deals with embracing the text to speech and image search technology. Did you notice how many search bars have “microphone icons” for talking out your request?

On a similar note, numerous sites have made a big jump forward after incorporating search by picture. In this case, uploaded photos get analyzed by artificial intelligence technology. The system studies what’s depicted on the image and cross-checks it with the products sold in the store. In several seconds the user is provided with a selection of similar products.

Without any doubt, this greatly helps users find what they were looking for faster. As you might have guessed, this is a time-saving feature. In essence, this omits the necessity to open dozens of product pages on multiple sites when seeking out a liked item that they’ve taken a screenshot or photo of.

Check out how such a feature works on the official Amazon website by taking a look at the screenshots of StyleSnap provided below.

Screenshot taken on the official Amazon StyleSnap website

Screenshot taken on the official Amazon StyleSnap website

3. Assisting Clients via Chatbots

The next point on the list is devoted to AI chatbots. This feature can be a real magic wand with client support which is also beneficial for online sales.

Real customer support specialists usually aren’t available 24/7. And keeping in mind that most requests are on repetitive topics, having a chatbot instantly handle many of the questions is a neat way to “unload” the work of humans.

Such chatbots use machine learning to get better at understanding and processing client queries. How do they work? They’re “taught” via scripts and scenario schemes. Therefore, the more data you supply them with, the more matters they’ll be able to cover.

Case in point, there’s such a chat available on the official Victoria’s Secret website. If the user launches the Digital Assistant, the messenger bot starts the conversation. Based on the selected topic the user selects from the options, the bot defines what will be discussed.

Screenshot taken on the official Victoria’s Secret website

Screenshot taken on the official Victoria’s Secret website

4. Determining Top-Selling Product Combos

A similar AI use case for boosting online revenues to the one mentioned in the first point, it becomes much easier to cross-sell products when artificial intelligence “cracks” the actual top matches. Based on the findings by Sumo, you can boost your revenues by 10 to 30% if you upsell wisely!

The product database of online stores gets larger by the month, making it harder to know for good which items go well together and complement each other. With AI on your analytics team, you don’t have to scratch your head guessing which products people are likely to additionally buy along with the item they’re browsing at the moment. This work on singling out data can be done for you.

As seen on the screenshot from the official MAC Cosmetics website, the upselling section on the product page presents supplement items in a carousel. Thus, the chance of these products getting added to the shopping cart increases (if you compare it to the situation when the client would search the site and find these products by himself).

Screenshot taken on the official MAC Cosmetics website

Screenshot taken on the official MAC Cosmetics website

5. “Try It On” with a Camera

The fifth AI technology in this list is virtual try on that borrowed the power of augmented reality technology in the world of sales.

Especially for fields like cosmetics or accessories, it is important to find ways to help clients to make up their minds and encourage them to buy an item without testing it physically. If you want, you can play around with such real-time functionality and put on makeup using your camera on the official Maybelline New York site.

Consumers, ultimately, become happier because this solution omits frustration and unneeded doubts. With everything evident and clear, people don’t have the need to take a shot in the dark what will be a good match, they can see it.

Screenshot taken on the official Maybelline New York website

Screenshot taken on the official Maybelline New York website

In Closing

To conclude everything stated in this article, artificial intelligence is a big crunch point. Incorporating various AI-powered features into an online retail store can be a neat advancement leading to a visible growth in conversions.