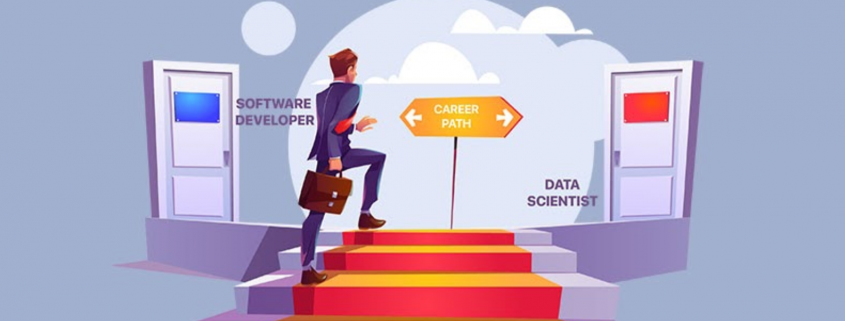
Select the Right career path between Software Developer and Data Scientist

In today’s digital day and age, a software development career is one of the most lucrative ones. Custom software developers abound, offering all sorts of services for business organizations anywhere in the world. Software developers of all kinds, vendors, full-time staff, contract workers, or part-time workers, all are important members of the Information Technology community. 

There are different career paths to choose from in the world of software development. Among the most promising ones include a software developer career and a data scientist career. What exactly are these?

Software developers are the brainstorming, creative masterminds behind all kinds of computer programs. Although there may be some that focus on a specific app or program, others build giant networks or underlying systems, which power and trigger other programs. That’s why there are two classifications of a software developer, the app software developer, and the developers of systems software.

On the other hand, data scientists are a new breed of experts in analytical data with the technical skills to resolve complex issues, as well as the curiosity to explore what problems require solving. Data scientists, in any custom software development service, are part trend-spotter, part mathematicians, and part computer scientists. And, since they bestraddle both IT and business worlds, they’re highly in-demand and of course well-paid. 

When it comes to the field of custom software development and software development in general, which career is the most promising? Let’s find out. 

Data Science and Software Development, the Differences

Although both are extremely technical, and while both have the same sets of skills, there are huge differences in how these skills are applied. Thus, to determine which career path to choose from, let’s compare and find the most critical differences. 

The Methodologies

Data Science Methodology

There are different places in which a person could come into the data science pipeline. If they are gathering data, then they probably are called a data engineer, and they would be pulling data from different resources, cleaning and processing it, and storing it in a database. Usually, this is referred to as the ETL process or the extract, transform, and load. 

If they use data to create models and perform analysis, probably they’re called a ‘data analyst’ or a ‘machine learning engineer’. The critical aspects of this part of the pipeline are making certain that any models made don’t violate the underlying assumptions, and that they are driving worthwhile insights. 

Methodology in Software Development 

In contrast, the development of software makes use of the SDLC methodology or the software development life cycle. The workflow or cycle is used in developing and maintaining software. The steps are planning, implementing, testing, documenting, deploying, and maintaining. 

Following one of the different SDLC models, in theory, could lead to software that runs at peak efficiency and would boost any future development. 

The Approaches

Data science is a very process-oriented field The practitioners consume and analyze sets of data to understand a problem better and come up with a solution. Software development is more of approaching tasks with existing methodologies and frameworks. For example, the Waterfall model is a popular method that maintains every software development life cycle phase that should be completed and reviewed before going to the next. 

Some frameworks used in development include the V-shaped model, Agile, and Spiral. Simply, there is no equal data science process, although a lot of data scientists are within one of the approaches as part of the bigger team. Pure developers of the software have a lot of roles to fill outside data science, from front-end development to DevOps and infrastructure roles. 

Moreover, although data analytics pays well, the roles of software developers of all kinds are still higher in demand. Thus, if machine learning isn’t your thing, then you could spend your spare time in developing expertise in your area of interest instead. 

The Tools

The wheelhouse of a data scientist has data analytics tools, machine learning, data visualization, working with databases, and predictive modeling. If you use plenty of data ingestion and storage they probably would use MongoDB, Amazon S3, PostgreSQL, or something the same. For building a model, there’s a great chance that they would be working with Scikit-learn or Statsmodels. 

Big data distributed processing needs Apache Spark. Software engineers use software to design and analyze tools, programming languages, software testing, web apps tools, and so on. With data science, many depend on what you’re attempting to accomplish. For actually creating TextWrangler, code Atom, Emacs, Visual Code Studio, and Vim are popular. 

Django by Python, Ruby on Rails, and Flask see plenty of use in the backend web development world. Vue.js emerged recently as one of the best ways of creating lightweight web apps, and similarly for AJAX when creating asynchronous-updating, creating dynamic web content. Everyone must know how to utilize a version control system like GitHub for instance. 

The Skills

To become a data scientist, some of the most important things to know include machine learning, programming, data visualization, statistics, and the willingness to learn. Various positions may need more than these skills, but it’s a safe bet to say that these are the bare minimum when you pursue a data science career. 

Often, the necessary skills to be a developer of the software will be a little more intangible. The ability of course to program and code in various programming languages is required, but you should also be able to work well in development teams, resolve an issue, adapt to various scenarios, and should be willing to learn. This again isn’t an exhaustive list of skills, but these certainly would serve you well if you are interested in this career. 

Conclusion

You should, at the end of the day must choose a career path that’s based on your strengths and interests. The salaries of data scientists and software developers  are the same to an average at least. However, before choosing which is better for you, consider experimenting with various projects and interact with different aspects of the business to determine where your skills and personality best fits in since that is where you’ll grow the most in the future.

Top 10 Python Libraries Of All Time

Python is a very popular and renowned language that has replaced several programming languages in the market. Its amazing collection of libraries makes it a convenient programming language for developers.

Python is an ocean of libraries serving an ample number of purposes and as a developer; you must possess sound knowledge of the 10 libraries. One needs to familiarize themselves with the libraries to go on and work on different projects. For the data scientist, it has been a charmer now.

Here today, for you this is a curated list of 10 Python libraries that can help you along with its significant features, when to use them, and also the benefits.

10 Best Python Libraries of All Times

  1. Pandas: Pandas is an open-source library that offers instant high performance, data analysis, and simple data structures. When can you use it? It can be used for data munging and wrangling. If one is looking for quick data visuals, aggregation, manipulation, and reading, then this library is suitable. You can impute the missing data files, plot the data, and make edits in the data column. Moreover, for renaming and merging, this tool can do wonders. It is a foundation library, and a data scientist should have in-depth knowledge about Pandas before any other library knowledge.
  1. TensorFlow: TensorFlow is developed by Google in collaboration with the Brain Team. Using this tool, you can instantly visualize any part of the graphical representation. It comes with modularity and offers high flexibility in its operations. This library is ideal for running and operating in large scale systems. So, as long as you have good internet connectivity, you can use it because it is an open-source platform. What is the beauty of this library? It comes with an unending list of applications associated with it.
  1. NumPy: NumPy is the most popular Python library used by developers. It is used by various libraries for conducting easy operations. What is the beauty of NumPy? Array Interface is the beauty of NumPy and it is always a highlighted feature. NumPy is interactive and very simple to use. It can instantly solve complicated mathematical problems. With this, you need not worry about daunting phases of coding and offering open-source contributions. This interface is widely used for expressing raw streams, sound waves, and other images. If you are looking to implement this into machine learning, you must possess in-depth knowledge about NumPy.
  1. Keras: Are you looking for a cool Python library? Well, Keras is the coolest machine learning python library. It runs smoothly on both CPU and GPU. Do you want to know where Keras is used? It is used in popular applications like Uber, Swiggy, Netflix, Square, and Yelp. Keras easily supports the fully connected, pooling, convolution, and recurrent neural networks. For any innovative research, it does fine because it is expressive and flexible. Keras is completely based on a framework, which enables easy debugging and exploring. Various large scientific organizations use Keras for innovative research.
  1. Scikit- Learn: If your project deals with complex data, it has to be the Scikit- Learn python library. This Python Machine Learning Library is associated with NumPy and SciPy. After various modifications, one such feather cross-validation is used for enabling more than one metric. It is used for extracting features and data from texts and images. It uses various algorithms to make changes in machine learning. What are its functions? It is used in model selection, classification, clustering, and regression. Various training methods like nearest neighbor and logistics regressions are subjected to minimal modification.
  1. PyTorch: PyTorch is the largest library which conducts various computations and accelerations. Also, it solves complicated application issues that are related to the neural networks. It is completely based on the machine language Torch, which is a free and open-source platform. PyTorch is new but gaining huge popularity and very much a favorite among the developers. Why such popularity? It comes with a hybrid end-user which ensures easy usage and flexibility. For processing natural language applications, this library is used. Do you know what the best part is? It is outperforming and taking the popularity of Tensor Flow in recent times.
  1. MoviePy: The MoviePy is a tool that offers unending functionality related to movies and visuals. It is used for exporting, modifying, and importing various video files. Do you want to add a title to your video or rotate it 90 degrees? Well, MoviePy helps you to do all such tasks related to videos. It is not a tool for manipulating data like Pillow. In any task related to movies and videos in python coding, you can no doubt rely on the functionality of MoviePy. It is designed to conduct all the aspects of a standard task and can get it done instantly. For any common task associated with videos, it has a MoviePy library.
  1. Matplotlib: Matplotlib is no doubt a quintessential python library whose presence can never be forgotten. You can visualize data and create innovative and interesting stories. When can you use it? You can use Matplotlib for embedding different plots into the application as it provides an object-oriented application program interface. Any sort of visualization, be it bar graph, histogram, pie chart, or graphs, Matplotlib can easily depict it. With this library, you can create any type of visualization. Do you want to know what visualizations you can create? You can create a histogram, Bar graph, pie chart, area plot, stem plot, and line plot. It also facilitates the legends, grids, and labels.
  2. Tkinter: Tkinter is a library that can help you create any Python application with the help of a graphical user interface. Tkinter is the most common and easy to use python library for developing apps with GUI. It binds python to the GUI tool kit which can be used in any modern operating system. To create a python GUI, Tkinter is the only best way to start instantly.
  3. Plotly: The Plotly is an essential graph plotting python library for developers. Users can import, copy, paste, export the data that needs to be analyzed and visualized. When can you use it? You can use Plotly to display and create figures and visual images. What is interesting is that it has amazing features for sending data to the various cloud servers.

What are the visual charts prepared with Plotly? You can create line pie, bubble, dot, scatter, and pie. One can also construct financial charts, contours, maps, subplots, carpet, radar, and logs. Do you have anything in your mind which needs to be represented visually? Use Plotly!

Finishing Up

In a nutshell, you have the best python libraries of recent times which contribute hugely to development. If your favorite python library didn’t make it in this list of the top 10 best python libraries, do not take offense.

Python comes with unending library packages, and these 10 are some of its popular and best-used ones. If you are a python developer, these are the best libraries you must have in-depth knowledge of.

New Era of Data Science in Today’s World

In today’s digital world, most organizations are flooded with data, both structured and unstructured. Data is a commodity now, and organizations should know how to monetize that data and derive a profit from the deluge. And valuing data is one of the best ways enterprises can become successful in distinguishing themselves in the marketplace.

Data is the new oil

Indeed, data itself has become a commodity, and the mere possession of abundant amounts of data is not enough. But the ability to monetize data effectively (and not merely hoard it) can undoubtedly be a source of competitive advantage in the digital economy. However, we need to refine this data. And refinement of this “new oil” will take a reasonable amount of time. In my opinion, we are still not there. As a result, “data refinement” remains a key factor for successful advanced analytics.

If we talk about the level of activity in data and analytics space in the last two years, most advanced analytics evolved around three categories:

  • Descriptive, or what has happened
  • Predictive, or what could happen, and
  • Prescriptive, or what we should do.

Descriptive analytics has been the core analytics for many years. In the past, we could only describe what has happened to historical data (such as that found in a data warehouse), with dashboard reporting, using traditional analytics. But with the advent of advanced analytics, machine learning (ML), and deep learning and artificial intelligence (AI), our focus has changed to real-time analytics. In the last two years, much work has been done in predictive analytics, and as we move forward into our analytics journey, data-centric organizations will now focus on prescriptive analytics. The use of prescriptive analytics, along with predictive analytics, is very important for any organization to be successful in the future.

Current and recent trends in data and analytics

The analytics trends revolve around AI and ML. The Analytics-as-a-Service model is an essential model for any smart, data-driven organization. We can make an impact on society and try to make a better place to live with the use of advanced analytics. At NTT DATA, we strive to solve these problems to improve the quality, safety and advancement of humanity. From a business perspective, we use data analytics and predictive modeling to help companies increase their sales and revenue.

Let me give you some examples. We have been involved with several technology partners in a project for the Smart City. This project involved the use of predictive analytics for the validation of critical alerts to help reduce the time and amount of data required to be processed. It used Internet of Things (IoT) devices, high-definition video cameras, and sound sensors, as well as video and sound data captured from specific locations. Eventually, the solution also integrated with available data from data sources such as crime, weather and social media. The overall objective of the Smart City project was to use and apply advanced analytics with cognitive computing to facilitate safety decision-making, and for a responder to respond earlier based on real-time data.

Another example is the Smart ICU System developed by NTT DATA for predictive detection of threats for seriously ill patients in an ICU, based on the data. This data was consolidated from various medical devices in the ICU into one platform. From that data, we developed a model that predicts the risk of complications that might occur within the next couple of hours or so of a medical event. We have also used advanced analytics provided by weather data forecasting and used predictive models to predict natural disasters.

Data and analytics strategy

A strategy is an essential aspect of any data-driven organization. It should cover data strategy for AI, ML, statistical modeling and other data science disciplines, such as predictive and prescriptive analytics. In general, advanced analytics is more predictive and actionable than retrospective. Smart organizations see positive results when they place a strategy for data and analytics in the hands of employees who are well-positioned to make decisions, such as those who interact with customers, oversee product development, or run production processes. With data-based insight and clear decision rules, employees can deliver more meaningful services, better assess and address customer demands, and optimize production.

Smart organizations must take time to clean and update their underlying modern data architecture — along with their data governance process, for a cleaner data and analytics strategy. A modern data architecture, combined with a good governance process, can leverage AI and ML to help organizations stay ahead of their competitors.

Data analytics innovation

Machine and Deep Learning, along with AI, are all very popular, but I would like to reiterate that advanced technologies like AI and machine learning will continue to transform data analytics. The next innovation could be the use of automated analytics, which machine learning tools can use to identify hidden patterns in data. For example, customer retention issues, customer default on loans, or predicting customers who are prone to auto accidents. Also, predictive analytics and prescriptive analytics are going to be the key for any future innovations in AI and ML.

We must make targeted investments in traditional business innovation tools, along with emerging data analytics tools to derive benefits from data-driven business initiatives. We need to invest in cloud and underlying IT infrastructure to support these analytics and business initiatives. Most importantly, we also need to invest in people — cross training skilled resources and empowering the people who work closely with clients to make the right decisions for analytics.

Connections Between Data Science & Finance

Image Source: pixabay.com

The world of finance is changing at an unprecedented rate. Data science has completely altered the face of traditional finance management. Though data has long been a critical component to finances, the introduction of big data and artificial intelligence have created new tools that are strengthening the predictive ability of many financial institutions.

These changes have led to a rapid increase in the need for financial professionals with data science skills. Nearly every sector in finances is converting to greater use of data science and management from the stock market and retirement accounts to credit score calculation. A greater understanding of the interplay between data and finance is a key skill gap.

Likewise, they have opened many doors for those that are interested in analyzing their personal finances. More and more people are taking their finances into their own hands and using the data tools available to make the best decisions for them. In today’s world, the sky’s the limit for financial analysis and management!

The Rise of the Financial Analyst

Financial analysts are the professionals who are responsible for the general management of money and investments both in an industrial and personal finance realm. Typically a financial analyst will spend time reviewing and understanding the overall stock portfolio and financial standing of a client including:

  • Stocks
  • Bonds
  • Retirement accounts
  • Financial history
  • Current financial statements and reports
  • Overarching business and industry trends

From there, the analyst will provide a recommendation with data-backed findings to the client on how they should manage their finances going into the future.

As you can imagine, with all of this data to analyze, the need for financial analysts to have a background or understanding of data science has never been higher! Finance jobs requiring skills such as artificial intelligence and big data increased by over 60% in the last year. Though these new jobs are typically rooted in computer science and data analytics, most professionals still need a background in financial management as well.

The unique skills required for a position like this means there is a huge (and growing) skills gap in the financial sector. Those professionals that are qualified and able to rise to fill the need are seeing substantial pay increases and hundreds of job opportunities across the nation and the globe.

A Credit Score Example

But where does all of this data science and professional financial account management come back to impact the everyday person making financial decisions? Surprisingly, pretty much in every facet of their lives. From things like retirement accounts to faster response times in financial analysis to credit scores — data science in the financial industry is like a cloaked hand pulling the strings in the background.

Take, for example, your credit score. It is one of the single most important numbers in your life, for better or worse. A high credit score can open all sorts of financial doors and get you better interest rates on the things you need loans for. A bad score can limit the amount lenders willing to qualify you for a loan and increase the interest rate substantially, meaning you will end up paying far more money in the end.

Your credit score is calculated by several things — though we understand the basic outline of what goes into the formula, the finer points are somewhat of a mystery. We know the big factors are:

  • Personal financial history
  • Debit-credit ratio
  • Length of credit history
  • Number of new credit hits or applications

All of this data and number crunching can have a real impact on your life, just one example of how data in the financial world is relevant.

Using Data Science in Personal Finance

Given all this information, you might be thinking to yourself that what you really need is a certificate in data science. Certainly, that will open a number of career doors for you in a multitude of realms, not just the finance industry. Data science is quickly becoming a cornerstone of how most major industries do business.

However, that isn’t necessarily required to get ahead on managing your personal finances. Just a little information about programs such as Excel can get you a long way. Some may even argue that Excel is the original online data management tool as it can be used to do things like:

  • Create schedules
  • Manage budgets
  • Visualize data in charts and graphs
  • Track revenues and expenses
  • Conditionally format information
  • Manage inventory
  • Identify trends in large data sets

There are even several tools and guides out there that will help you to get started!

***

Data analysis and management is here to stay, especially when it comes to the financial industry. The tools are likely to continue to become more important and skills in their use will increase in value. Though there are a lot of professional skills using big data to manage finances, there are still a lot of tools out there that are making it easier than ever to glean insights into your personal finances and make informed financial decisions.

How the Pandemic is Changing the Data Analytics Outsourcing Industry

While media pundits have largely focused on the impact of COVID-19 as far as human health is concerned, it hasn’t been particularly good for the health of automated systems either. As cybersecurity budgets plummet in the face of dwindling finances, computer criminals have taken the opportunity to increase attacks against high value targets.

In June, an online antique store suffered a data breach that contained over 3 million records, and it’s likely that a number of similar attacks have simply gone unpublished. Fortunately, data scientists are hard at work developing new methods of fighting back against these kinds of breaches. Budget constraints and a lack of personnel as a result of the pandemic continues to be a problem, but automation has helped to assuage the issue to some degree.

AI-Driven Data Storage Systems

Big data experts have long promoted the cloud as an ideal metaphor for the way that data is stored remotely, but as a result few people today consider the physical locations that this information is stored at. All data has to be located on some sort of physical storage device. Even so-called serverless apps have to be distributed from a server unless they’re fully deployed using P2P services.

Since software can never truly replace hardware, researchers are looking at refining the various abstraction layers that exist between servers and the clients who access them. Data warehousing software has enabled computer scientists to construct centralized data storage solutions that look like traditional disk locations. This gives users the ability to securely interact with resources that are encrypted automatically.

Background services based on artificial intelligence monitor virtual data warehouse locations, which gives specialists the freedom to conduct whatever analytics they deem necessary. In some cases, a data warehouse can even anonymize information as it’s stored, which can streamline workflows involved with the analysis process.

While this level of automation has proven useful, it’s still subject to some of the problems that have occurred as a result of the pandemic. Traditional supply chains are in shambles and a large percentage of technical workers are now telecommuting. If there’s a problem with any existing big data plans, then there’s often nobody around to do any work in person.

Living with Shifting Digital Priorities

Many businesses were in the process of outsourcing their data operations even before the pandemic, and the current situation is speeding this up considerably. Initial industry estimates had projected steady growth numbers for the data analytics sector through 2025. While the current figures might not be quite as bullish, it’s likely that sales of outsourcing contracts will remain high.

That being said, firms are also shifting a large percentage of their IT spending dollars into cybersecurity projects. A recent survey found that 37 percent of business leaders said they were already going to cut their IT department budgets. The same study found that 28 percent of businesses are going to move at least some part of their data analytics programs abroad.

Those companies that can’t find an attractive outsourcing contract might start to patch their remote systems over a virtual private network. Unfortunately, this kind of technology has been strained to some degree in recent months. The virtual servers that power VPNs are flooded with requests, which in turn has brought them down in some instances. Neural networks, which utilize deep learning technology to improve themselves as time goes on, have proven more than capable of predicting when these problems are most likely to arise.

That being said, firms that deploy this kind of technology might find that it still costs more to work with automated technology on-premise compared to simply investing in an outsourcing program that works with these kinds of algorithms at an outside location.

Saving Money in the Time of Corona

Experts from Think Big Analytics pointed out how specialist organizations can deal with a much wider array of technologies than a small business ever could. Since these companies specialize in providing support for other organizations, they have a tendency to offer support for a large number of platforms.

These representatives recently opined that they could provide support for NoSQL, Presto, Apache Spark and several other emerging platforms at the same time. Perhaps most importantly, these organizations can work with Hadoop and other traditional data analysis languages.

Staffers working on data mining operations have long relied on languages like Hadoop and R to write scripts that they later use to automate the process of collecting and analyzing data. By working with an organization that already supports a language that companies rely on, they can avoid the need of changing up their existing operations.

This can help to drastically reduce the cost of migration, which is extremely important since many of the firms that need to migrate to a remote system are already suffering from budget problems. Assuming that some issues related to the pandemic continue to plague businesses for some time, it’s likely that these budget constraints will force IT departments to consider a migration even if they would have otherwise relied solely on a traditional colocation arrangement.

IT department staffers were already moving away from many rare platforms even before the COVID-19 pandemic hit, however, so this shouldn’t be as much of a herculean task as it sounds. For instance, the KNIME Analytics Platform has increased in popularity exponentially since it’s release in 2006. The fact that it supports over 1,000 plug-in modules has made it easy for smaller businesses to move toward the platform.

The road ahead isn’t going to be all that pleasant, however. COBOL and other antiquated languages still rule the roost at many governmental big data processing centers. At the same time, some small businesses have never even been able to put a big data plan into play in the first place. As the pandemic continues to wreak havoc on the world’s economy, however, it’s likely that there will be no shortage of organizations continuing to migrate to more secure third-party platforms backed by outsourcing contracts.

How Tech Helps Keep You Safe Throughout the Day

Safety is always a primary concern for people no matter what is happening in the world, but there are certain times when it’s pushed firmly to the front of our minds. It’s in these times that we realise just how much we have come to rely on technology to help secure our safety.

From the moment we wake up, to the moment we go to bed, there’s always some sort of technology helping to keep us safe – protecting our health, loved ones and personal details.

Here are just some of the main ways in which tech helps keep you secure throughout the day.

At Home

We literally have everything at the push of a button these days. Whether you want to see who’s at your front door, or check for the latest safety announcements, you’ve got the power to do it with your phone.

Knowledge is power as they say, and having access to limitless information can help keep you safe. When problems do occur, your ability to communicate with people who can help you is also far superior to what has ever been in the past.

Through easy access to information, and clear communication channels, technology has made us more secure at home.

In Hospitals

If you do get sick, then technology is always there to help you get back on your feet. Everyday across the world, research is taking place that improves our medical procedures and makes our medicines more effective.

With novel medicines delivered by innovative drug discovery platform, each day brings us closer to curing previously uncurable diseases and improving the performances of our healthcare systems. Technology is constantly driving the healthcare system forward, helping to make you safer if you do end up in hospital.

On the Road

While you’re still very safe on the road, driving is one of the riskier activities you do on a daily basis. To help protect you, car manufacturers and regulatory bodies are constantly investing in new technology to help keep us safe.

We take amenities such as seatbelts and airbags for granted these days, but they’re part of a constant stream of technologies designed to keep us safer on the roads.

Today we talk about ideas such as lane assist, and even driverless cars to keep us safe, and technology will continue to drive safety forward.

At Work

Workplace accidents are another risk we face when we leave the house, but again, technology is helping to lower the risk and even prevent these from happening.

This can be anything from ergonomic chairs, to sophisticated personnel management systems, but all industries continue to make strides toward keeping you safer when you’re at work.

Online

It’s not so long ago that this wouldn’t have even featured on the list, but we spend so much of our lives online, and store so much of our information there that we have to make sure we’re using it safely.

As quickly as the internet develops, so too does the technology to help keep us safe online. The technology is there to help you, but you’ve got to be aware of the threat and be up to date with online security.

Data Science in Engineering Process - Product Lifecycle Management

How to develop digital products and solutions for industrial environments?

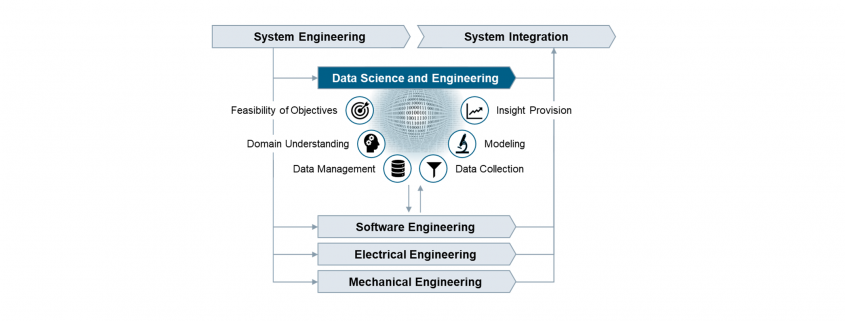
The Data Science and Engineering Process in PLM.

Huge opportunities for digital products are accompanied by huge risks

Digitalization is about to profoundly change the way we live and work. The increasing availability of data combined with growing storage capacities and computing power make it possible to create data-based products, services, and customer specific solutions to create insight with value for the business. Successful implementation requires systematic procedures for managing and analyzing data, but today such procedures are not covered in the PLM processes.

From our experience in industrial settings, organizations start processing the data that happens to be available. This data often does not fully cover the situation of interest, typically has poor quality, and in turn the results of data analysis are misleading. In industrial environments, the reliability and accuracy of results are crucial. Therefore, an enormous responsibility comes with the development of digital products and solutions. Unless there are systematic procedures in place to guide data management and data analysis in the development lifecycle, many promising digital products will not meet expectations.

Various methodologies exist but no comprehensive framework

Over the last decades, various methodologies focusing on specific aspects of how to deal with data were promoted across industries and academia. Examples are Six Sigma, CRISP-DM, JDM standard, DMM model, and KDD process. These methodologies aim at introducing principles for systematic data management and data analysis. Each methodology makes an important contribution to the overall picture of how to deal with data, but none provides a comprehensive framework covering all the necessary tasks and activities for the development of digital products. We should take these approaches as valuable input and integrate their strengths into a comprehensive Data Science and Engineering framework.

In fact, we believe it is time to establish an independent discipline to address the specific challenges of developing digital products, services and customer specific solutions. We need the same kind of professionalism in dealing with data that has been achieved in the established branches of engineering.

Data Science and Engineering as new discipline

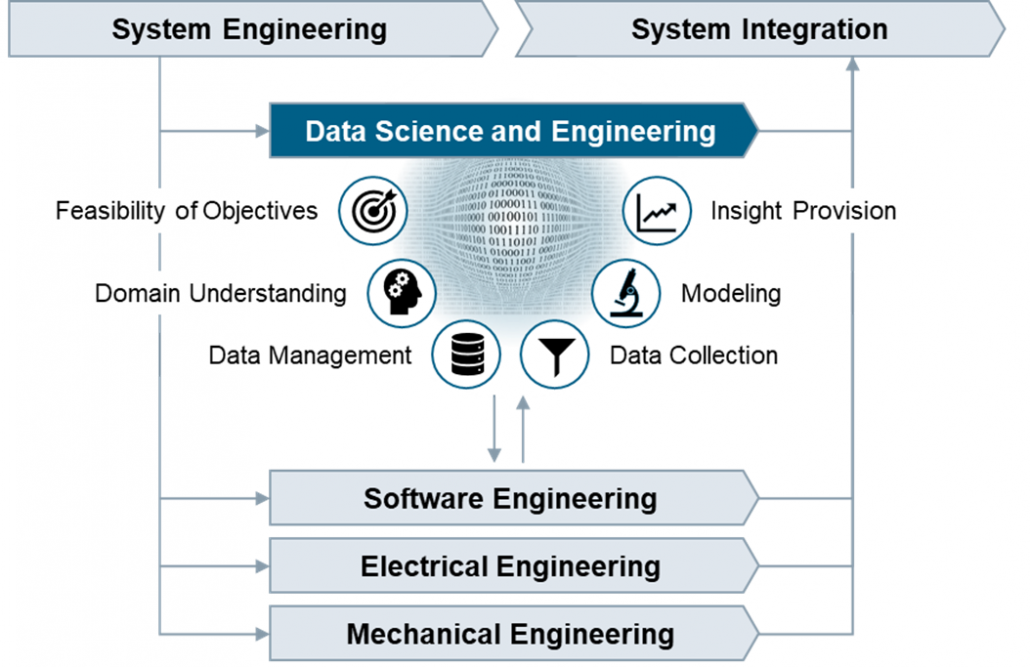
Whereas the implementation of software algorithms is adequately guided by software engineering practices, there is currently no established engineering discipline covering the important tasks that focus on the data and how to develop causal models that capture the real world. We believe the development of industrial grade digital products and services requires an additional process area comprising best practices for data management and data analysis. This process area addresses the specific roles, skills, tasks, methods, tools, and management that are needed to succeed.

Figure: Data Science and Engineering as new engineering discipline

More than in other engineering disciplines, the outputs of Data Science and Engineering are created in repetitions of tasks in iterative cycles. The tasks are therefore organized into workflows with distinct objectives that clearly overlap along the phases of the PLM process.

Feasibility of Objectives
  Understand the business situation, confirm the feasibility of the product idea, clarify the data infrastructure needs, and create transparency on opportunities and risks related to the product idea from the data perspective.
Domain Understanding
  Establish an understanding of the causal context of the application domain, identify the influencing factors with impact on the outcomes in the operational scenarios where the digital product or service is going to be used.
Data Management
  Develop the data management strategy, define policies on data lifecycle management, design the specific solution architecture, and validate the technical solution after implementation.
Data Collection
  Define, implement and execute operational procedures for selecting, pre-processing, and transforming data as basis for further analysis. Ensure data quality by performing measurement system analysis and data integrity checks.
Modeling
  Select suitable modeling techniques and create a calibrated prediction model, which includes fitting the parameters or training the model and verifying the accuracy and precision of the prediction model.
Insight Provision
  Incorporate the prediction model into a digital product or solution, provide suitable visualizations to address the information needs, evaluate the accuracy of the prediction results, and establish feedback loops.

Real business value will be generated only if the prediction model at the core of the digital product reliably and accurately reflects the real world, and the results allow to derive not only correct but also helpful conclusions. Now is the time to embrace the unique chances by establishing professionalism in data science and engineering.

Authors

Peter Louis                               

Peter Louis is working at Siemens Advanta Consulting as Senior Key Expert. He has 25 years’ experience in Project Management, Quality Management, Software Engineering, Statistical Process Control, and various process frameworks (Lean, Agile, CMMI). He is an expert on SPC, KPI systems, data analytics, prediction modelling, and Six Sigma Black Belt.


Ralf Russ    

Ralf Russ works as a Principal Key Expert at Siemens Advanta Consulting. He has more than two decades experience rolling out frameworks for development of industrial-grade high quality products, services, and solutions. He is Six Sigma Master Black Belt and passionate about process transparency, optimization, anomaly detection, and prediction modelling using statistics and data analytics.4


Must-have Skills to Master Data Science

The need to process a massive amount of data sets is making Data Science the most-demanded job across diverse industry verticals. In today’s times, organizations are actively looking for Data Scientists.

But What does a Data Scientist do?

Data Scientist design data models, create various algorithms to extract the data the organization needs, and then they analyze the gathered data and communicate the data insights with the business stakeholders.

If you are looking forward to pursuing a career in Data Science, then this blog is for you 🙂

Data Scientists often come from many different educational and work experience backgrounds but few skills are common and essential.

Let’s have a look at all the essential skills required to become a Data Scientist:

  1. Multivariable Calculus & Linear Algebra
  2. Probability & Statistics
  3. Programming Skills (Python & R)
  4. Machine Learning Algorithms
  5. Data Visualization
  6. Data Wrangling
  7. Data Intuition

Let’s dive deeper into all these skills one by one.


Multivariable Calculus & Linear Algebra:

Having a solid understanding of math concepts is very helpful for a Data Scientist.

Key Concepts:

  • Matrices
  • Linear Algebra Functions
  • Derivatives and Gradient
  • Relational Algebra

Probability & Statistics:

Probability and Statistics play a major role in Data Science for estimation and prediction purposes.

Key concepts required:

  • Probability Distributions
  • Conditional Probability
  • Bayesian Thinking
  • Descriptive Statistics
  • Random Variables
  • Hypothesis Testing and Regression
  • Maximum Likelihood Estimation

Programming Skills (Python & R):

Python :

Start with Python Fundamentals using a jupyter notebook, which comes pre-packaged with Python libraries.

Important Python Libraries used:

  • NumPy (For Data Exploration)
  • Pandas (For Data Exploration)
  • Matplotlib (For Data Visualization)

R:

It is a programming language and software environment used for statistical computing and graphics. 

Key Concepts required:

  • R Languages fundamentals and basic syntax
  • Vectors, Matrices, Factors
  • Data frames
  • Basic Graphics

Machine Learning Algorithms

Machine Learning is an innovative and essential field in the industry. There are quite a few algorithms out there, major ones are as follows –

  • Linear Regression
  • Logistic Regression
  • Decision Trees
  • Random Forest
  • Naïve Bayes
  • Support Vector Machines
  • Dimensionality Reduction
  • K-means
  • Artificial Neural Networks

Data Visualization:

Data visualization is very essential when it comes to analyzing a massive amount of information and data. 

To make data-driven decisions, data visualization tools, and technologies are essential in the world of Data Science.

Data Visualization tools:

  • Tableau
  • Microsoft Power Bi
  • E Charts
  • Datawrapper
  • HighCharts

Data Wrangling:

Data wrangling, this term refers to the process of cleaning and refining the messy and complex data available into a more usable format. 

It is considered one of the most crucial parts of working with data.

Important Steps to Data Wrangling:

  1. Discovering
  2. Structuring
  3. Cleaning
  4. Enriching
  5. Validating
  6. Documenting

Tools used:

  • Tabula
  • Google DataPrep
  • Data Wrangler
  • CSVkit

Data Wrangling can be done using Python and R.

Data Intuition:

Data Intuition in Data Science is an intuitive understanding of concepts. It’s one of the most significant skills required to become a Data Scientist.

It’s about recognizing patterns where none are observable on the surface.

This is something that you need to develop. It is a skill that will only come with experience.

A Data Scientist should know which Data Science methods to apply to the problem at hand.

Conclusion:

 As you can see, all these skills – from programming to algorithmic methods, work with one another to build on top of each other for gathering deeper data insights.

There are a wide number of courses available online for developing these skills and to help you become a true talent in this data industry.

Sure, this journey isn’t an easy one to follow but it’s not impossible. With sheer determination and consistency, you will be able to cross all the hurdles in your Data Science career path.

Severity of lockdowns and how they are reflected in mobility data

The global spread of the SARS-CoV-2 at the beginning of March 2020 forced majority of countries to introduce measures to contain the virus. The governments found themselves facing a very difficult tradeoff between limiting the spread of the virus and bearing potentially catastrophic economical costs of a lockdown. Notably, considering the level of globalization today, the response of countries varied a lot in severity and response latency. In the overwhelming amount of media and social media information feed a lot of misinformation and anecdotal evidence surfaced and remained in people’s mind. In this article, I try to have a more systematic view on the topics of severity of response from governments and change in people’s mobility due to the pandemic.

I want to look at several countries with different approach to restraining the spread of the virus. I will look at governmental regulations, when, and how they were introduced. For that I am referring to an index called Oxford COVID-19 Government Response Tracker (OxCGRT)[1]. The OxCGRT follows, records, and rates the actions taken by governments, that are available publicly. However, looking just at the regulations and taking them for granted does not provide that we have the whole picture. Therefore, equally interesting is the investigation of how the recommended levels of self-isolation and social distancing is reflected in the mobility data and we will look at it first.

The mobility dataset

The mobility data used in this article was collected by Google and made freely accessible[2]. The data reflects how the number of visits and their length changed as compared to a baseline from before the pandemic. The baseline is the median value for the corresponding day of the week in the period from 3.01.2020 – 6.02.2020. The dataset contains data in six categories. Here we look at only 4 of them: public transport stations, places of residence, workplaces, and retail/recreation (including shopping centers, libraries, gastronomy, culture). The analysis intentionally omits parks (public beaches, gardens etc.) and grocery/pharmacy category. Mobility in parks is excluded due to huge weather change confound. The baseline was created in winter and increased/decreased (depending on the hemisphere) activity in parks is expected as the weather changes. It would be difficult to detangle tis change from the change caused by the pandemic without referring to a different baseline. The grocery shops and pharmacies are excluded because the measures regarding the shopping were very similar across the countries.

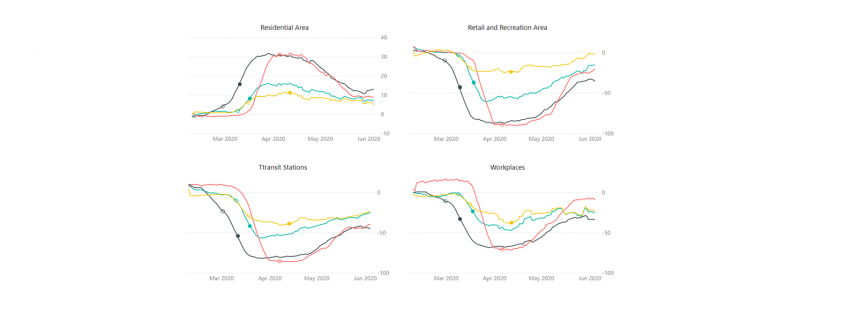
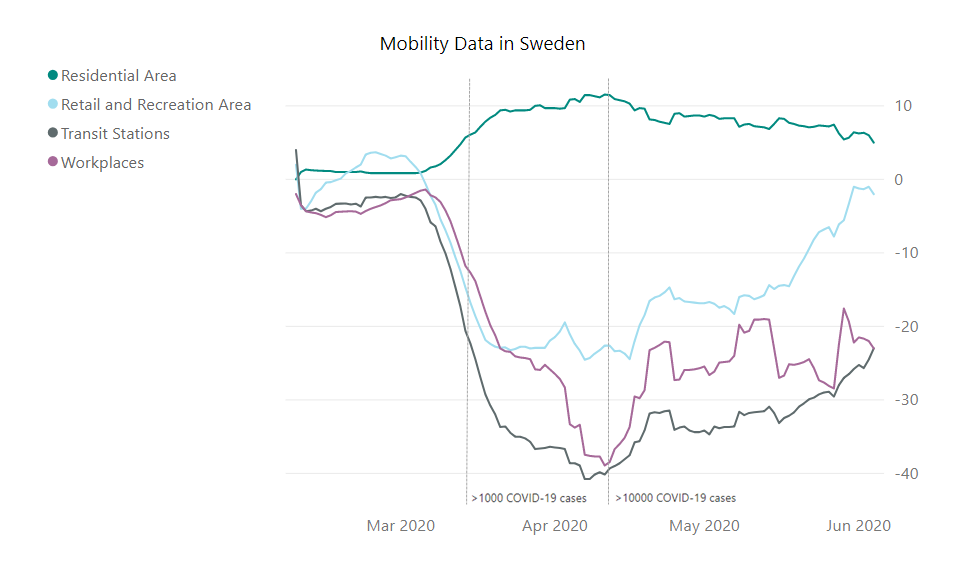
Amid the Covid-19 pandemic a lot of anecdotal information surfaced, that some countries, like Sweden, acted completely against the current by not introducing a lockdown. It was reported that there were absolutely no restrictions and Sweden can be basically treated as a control group for comparing the different approaches to lockdown on the spread of the coronavirus. Looking at the mobility data (below), we can see however, that there was a change in the mobility of Swedish citizens in comparison to the baseline.

Fig. 1 Moving average (+/- 6 days) of the mobility data in Sweden in four categories.

Fig. 1 Moving average (+/- 6 days) of the mobility data in Sweden in four categories.

Looking at the change in mobility in Sweden, we can see that the change in the residential areas is small, but it is indicating some change in behavior. A change in the retail and recreational sector is more noticeable. Most interestingly it is approaching the baseline levels at the beginning of June. The most substantial changes, however, are in the workplaces and transit categories. They are also much slower to come back to the baseline, although a trend in that direction starts to be visible.

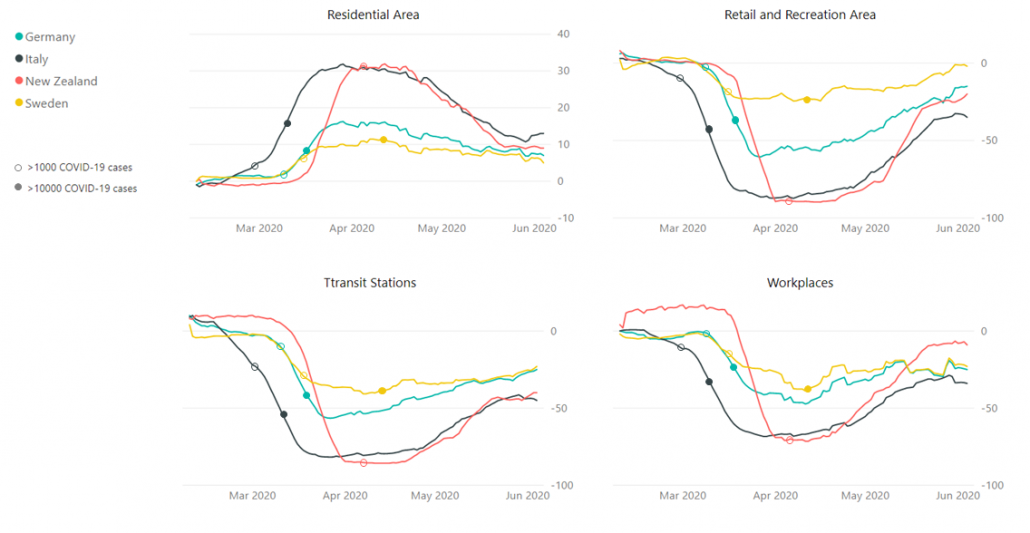
Next, let us have a look at the change in mobility in selected countries, separately for each category. Here, I compare Germany, Sweden, Italy, and New Zealand. (To see the mobility data for other countries visit https://covid19.datanomiq.de/#section-mobility).

Fig. 2 Moving average (+/- 6 days) of the mobility data.

Fig. 2 Moving average (+/- 6 days) of the mobility data.

Looking at the data, we can see that the change in mobility in Germany and Sweden was somewhat similar in orders of magnitude, in comparison to changes in mobility in countries like Italy and New Zealand. Without a doubt, the behavior in Sweden changed the least from the baseline in all the categories. Nevertheless, claiming that people’s reaction to the pandemic in Sweden in Germany were polar opposites is not necessarily correct. The biggest discrepancy between Sweden and Germany is in the retail and recreation sector out of all categories presented. The changes in Italy and New Zealand reached very comparable levels, but in New Zealand they seem to be much more dynamic, especially in approaching the baseline levels again.

The government response dataset

Oxford COVID-19 Government Response Tracker records regulations from number of countries, rates them and categorizes into a few indices. The number between 1 and 100 reflects the level of the action taken by a government. Here, I focus on the Containment and Health sub-index that includes 11 indicators from categories: containment and closure policies and health system policies[3]. The actions included in the index are for example: school and workplace closing, restrictions on public events, travel restrictions, public information campaigns, testing policy and contact tracing.

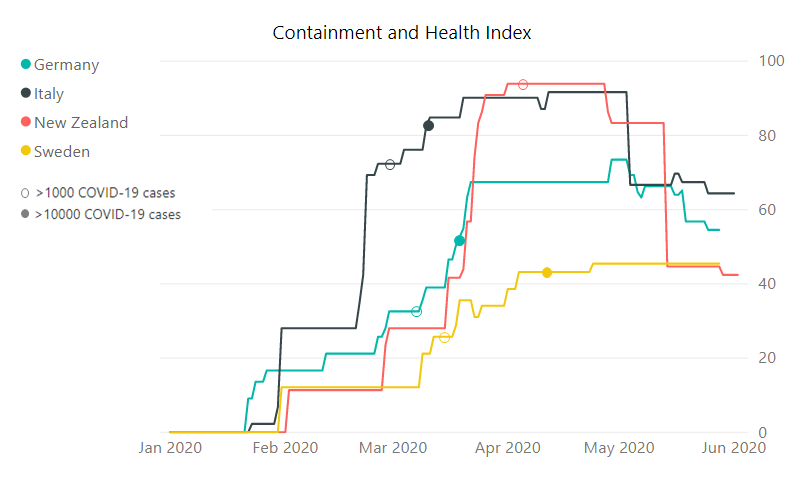
Below, we look at a plot with the Containment and Health sub-index value for the four aforementioned countries. Data and documentation is available here[4]

Fig. 3 Oxford COVID-19 Government Response Tracker, the Containment and Health sub-index.

Fig. 3 Oxford COVID-19 Government Response Tracker, the Containment and Health sub-index.

Here the difference between Sweden and the other countries that we are looking at becomes more apparent. Nevertheless, the Swedish government did take some measures in order to condemn the spread of the SARS-CoV-2. At the highest, the index reached value 45 points in Sweden, 73 in Germany, 92 in Italy and 94 in New Zealand. In all these countries except for Sweden the index started dropping again, while the drop is the most dynamic in New Zealand and the index has basically reached the level of Sweden.

Conclusions

As we have hopefully seen, the response to the COVID-19 pandemic from governments differed substantially, as well as the resulting change in mobility behavior of the inhabitants did. However, the discrepancies were probably not as big as reported in the media.

The overwhelming presence of the social media could have blown some of the mentioned differences out of proportion. For example, the discrepancy in the mobility behavior between Sweden and Germany was biggest in recreation sector, that involves cafes, restaurants, cultural resorts, and shopping centers. It is possible, that those activities were the ones that people in lockdown missed the most. Looking at Swedes, who were participating in them it was easy to extrapolate on the overall landscape of the response to the virus in the country.

It is very hard to say which of the world country’s approach will bring the best effects for the people’s well-being and the economies. The ongoing pandemic will remain a topic of extensive research for many years to come. We will (most probably) eventually find out which approach to the lockdown was the most optimal (or at least come close to finding out). For the time being, it is however important to remember that there are many factors in play and looking into one type of data might be misleading. Comparing countries with different history, weather, political and economic climate, or population density might be misleading as well. But it is still more insightful than not looking into the data at all.

[1] Hale, Thomas, Sam Webster, Anna Petherick, Toby Phillips, and Beatriz Kira (2020). Oxford COVID-19 Government Response Tracker, Blavatnik School of Government. Data use policy: Creative Commons Attribution CC BY standard.

[2] Google LLC “Google COVID-19 Community Mobility Reports”. https://www.google.com/covid19/mobility/ retrived: 04.06.2020

[3] See documentation https://github.com/OxCGRT/covid-policy-tracker/tree/master/documentation

[4] https://github.com/OxCGRT/covid-policy-tracker  retrieved on 04.06.2020

Capturing COVID: How and Why Data Mining is Being Used to Combat Coronavirus

Image Source: Pixabay (https://pixabay.com/illustrations/artificial-intelligence-brain-think-3382507/)

In just a few short months, the coronavirus pandemic has infiltrated pretty much every aspect of daily life. It has virtually decimated the global economy. It has taken our children out of their schools. It’s wrought havoc on an already overburdened healthcare system.

That, however, is changing. And technology is the reason why. Data mining is nothing new, of course, and its use in the field of healthcare is well-established.

But the importance of data mining has never been more apparent than right now, as scientists, researchers, and healthcare providers race to develop a clear and effective profile of this unseen adversary.

What is Data Mining and Why Does It Matter?

Put simply, data mining uses automated technology to scour other technologies for relevant information collected from the tech’s users. Data scientists then analyze these enormous — and we do mean enormous — quantities of data for some actionable purpose.

Big data can be used for anything from developing a targeted market plan for a large multinational based on customer research to formulating emergency preparedness plans based on community risk assessments to investigating crime scenes.

Data Mining, Healthcare, and Corona

In the face of rising healthcare costs, surging demand, and shrinking resources, data mining has proved an invaluable tool for evidence-based healthcare. For years now, anonymized patient data has been mined to identify public health concerns, individual patient risks, and customized treatment protocols. All of these are derived from the nearly instantaneous automated analysis of literally billions of gigabytes of data.

When it comes to combating coronavirus, data mining is turning out to be one of the most powerful weapons in the public health arsenal. Through healthcare data, researchers and policymakers can better describe the virus, its impacts, and its behaviors.

For example, COVID patients’ electronic health records (EHR) are being anonymized and mined for data on how the virus presented, what course it took, and what pre-existing factors, from age and gender to prior health status, the patient had. Likewise, hospital and clinical data are collected to determine how many patients, and in what demographics, were presenting with symptoms of the disease at any given time.

Once a more comprehensive description of the virus has been developed, researchers can use this information to predict who will be affected, how, and where. Armed with this knowledge, public health officials can make informed decisions on policies to help prevent or slow the spread.

Likewise, healthcare providers can devise more effective treatment plans based on success rates drawn from data accumulated from across the globe. They can even use the information drawn from mined healthcare data to determine who is at great risk for a poor outcome or severe complications, such as blood clots.

For example, these data can help determine who might be the best candidate for convalescent plasma or antivirals like Remdesivir. Scientists and healthcare providers are also increasingly cognizant of the risk of a severe autoimmune syndrome that children who have been exposed to the virus might experience, even if they had never become symptomatic for COVID.

The Really Smartphone

It’s not just patient records and other medical data that are being mined in the fight against coronavirus. As it turns out, your friendly, unassuming little smartphone is proving to be a treasure trove of essential public health data.

Your cell phone data plan allows you to live your digital life via your smartphone. When you’re streaming videos or surfing the web on your phone, you’re almost certainly using data, and that data can be mined — both for malicious (or at least questionable) purposes and for good ones.

When you link your smartphone to the network, your movements can be tracked using your phone’s geolocation capabilities. To be sure, that capability hasn’t gone without significant opposition from privacy advocates. Significant fears over the security of that data and how it might be used has fueled a long and often heated debate, both in courts of law and in the court of public opinion.

But now, in the face of a global pandemic, with the virus continuing to menace nearly every corner of the globe, the capacity to track the movements of those who have been in active hot zones, and especially of travelers coming from them, isn’t just helpful. It’s lifesaving. Through the use of cellphone data, for instance, not only can scientists track the spread of the virus, but they can also engage in more effective contract tracing. This includes the ability to warn individuals who have been in close proximity to an infected person.

The Takeaway

The coronavirus pandemic is like nothing many of us have ever seen before. This previously unknown pathogen has changed the world as we once knew it. It has not only altered the way we live, but it has threatened our own lives and the lives of those we love. But the virus will not be able to exploit its novelty for much longer. Every day, scientists and researchers are mining essential data to better understand the virus, what it does, and how it moves. Every moment, new treatment and containment strategies are emerging based on the power of big data. Every second, we are mining for the data for the weapon that will kill the enemy once and for all.